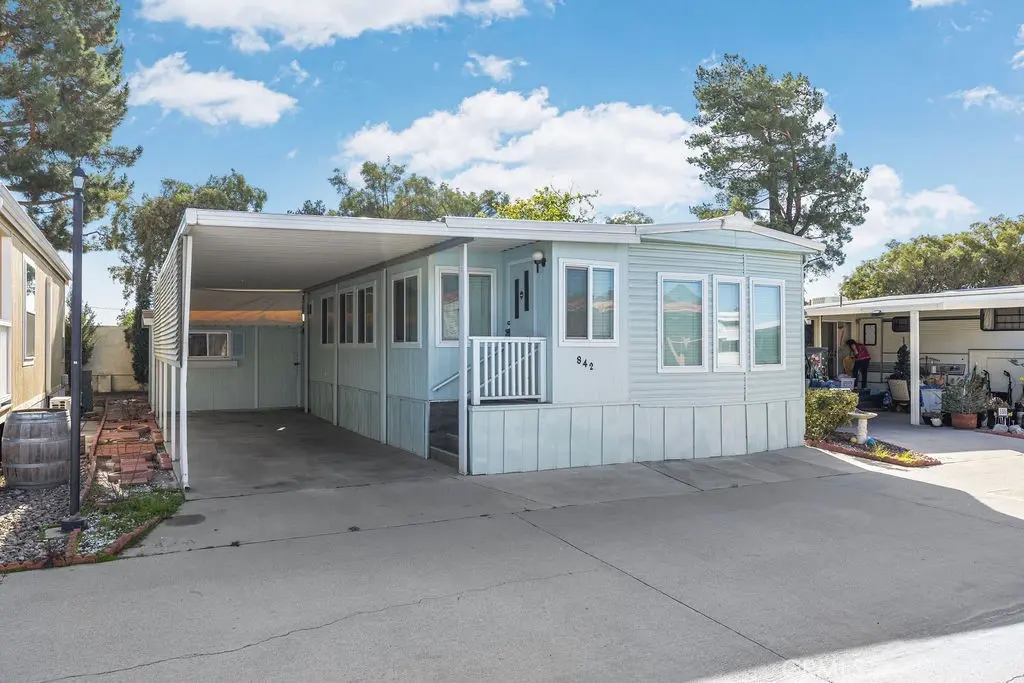
842 Acorn · San Jacinto, CA
Flood risk 5/10 · Moderate
- FEMA flood zone
- X
- Chance of flooding over 30 yrs
- 0.67%
- Est. flood insurance / yr
- $507 – $1,088
Fire risk 8/10 · Major
- Est. fire insurance / yr
- $659 – $1,223
Heat risk 7/10 · Major
- Hot days now (above 103°F)
- 7 days/yr
- Hot days in 30 yrs
- 20 days/yr
Wind risk 1/10 · Minimal
- Chance of severe wind over 30 yrs
- —
Air-quality risk 6/10 · Moderate
- Unhealthy air days now
- 12 days/yr
- Unhealthy air days in 30 yrs
- 14 days/yr
Risk factors via First Street. Map © Google.
Why this score? — see what drove the C grade
The composite is a weighted blend of 9 inputs, each scored 0–100. Each bar is that input's sub-score; the figure is the points it added to the 100-point composite (weight × sub-score).
- Cash flow +27.7/30.0
- DSCR +9.8/10.0
- 1% rule +8.0/10.0
- Rent growth +3.2/5.0
- Livability +3.2/5.0
- Condition / age +2.5/5.0
- Schools +2.1/10.0
- ARV discount +0.0/15.0
- Appreciation +0.0/10.0
$142,000
🖨 Deal sheet 📄 Offer letter ✓ Due diligence
Listing remarks MLS
55+ Manufactured home on PERMANENT LAND, so you own the land and no land lease is paid. Come make this home yours as it serves as a great retirement home, vacation home, or even a great and affordable primary residence! The home is in immaculate condition as it boasts brand new flooring throughout the entire home, new double paneled windows (which are energy efficient) in all windows of the home, brand new restroom renovation in the master room, and a gorgeous, custom made kitchen with quality carpentry. It also has a carport long enough for 2 cars and washer/dryer hookups are available. The park offers lots of amenities that are included in the low HOA fee of $200/month such as a clubhouse, gym, recreation room, billiard room, spa and pool, bike trails and a gated entrance with controlled access. Also, it includes your utilities of water, trash, sewer, internet, and cable TV ALL in the low HOA fee. And best of all, you are minutes away from the Soboba Casino Resort, grocery stores, and several high rated restaurants. Contact me for any questions or to schedule a showing appointment! Se habla Español!
Key facts
- Restroom renovation
- Clubhouse
- Recreation room
Tags
Neighborhood map
What this means for you Summary
Snapshot
- This is a 2-bed/2.0-bath manufactured listed at $142k.
Deal economics
- At list price, monthly cash flow is $429 ($5k/yr) — positive.
- The deal already cash-flows at list — no discount required.
- Meets the 1% rule at list price ($2k rent vs $142k).
- Recommended offer: $133k (6.0% below list) — sets the bar for market timing.
- Cap rate 9.9% vs local median 3.8% in San Jacinto — top-decile yield for the area; either an underpriced asset or a hidden risk that comps aren't pricing in. Stress-test before assuming the spread holds.
Location & tenants
- Location reads 63/100 on livability (#467 in CA) — a middle-class / working-renter tenant base. Strengths: housing A+; Watch: employment D+, schools D-, amenities F.
- San Jacinto Unified (suburban): math 13% / reading 36% proficiency, ranked #421 of 517 in CA (top 81%) — low school quality limits family demand, transient renter base, plan for 1-2y turnover; 68% free/reduced lunch — lower-income household profile, screen leases tightly.
- Market conditions: Rents rising (+2.6%/yr); 159 active listings in the ZIP; 10 comparable units currently listed for rent nearby; rentals lingering (median 44d on market — plan ~5-8 weeks vacancy on turnover, expect pricing pressure); 70% of comp listings sitting > 30 days — soft ceiling on asking rent; 9,195 units permitted in Riverside County in 2024 (1,512 in 5+ unit buildings).
- This rent runs 32% of the median local income ($68k/yr) — at the standard rent-burdened threshold; future hikes will face affordability resistance.
Forward outlook
- Local home prices are declining (-3.0%/yr); year-one equity from $982 of loan paydown is wiped out by about $4k of value loss. Plan a longer hold.
- Riverside County population projected at +22% by 2050 — long-run rental-demand tailwind backs the buy-and-hold thesis.
- At projected returns (-3.0% appreciation + 2.6% rent growth), your $40k cash investment doubles in ~10 years — after that, you're playing with house money.
Negotiation context
- It's been on market 81 days — a 6% lower offer ($133k) is reasonable based on typical stale-listing flexibility.
- 7 sale attempts since 10y ago with the ask held roughly flat each time — persistent listings suggest the price (not the market) is what's stuck; bring a comps-based counter.
- Current owner paid $25k; list at $142k implies a 468% gain — meaningful room to come down on a strong offer.
Risks & watch-outs
- Climate carrying-cost: moderate flood risk; severe wildfire risk; extreme-heat days projected 7→20/yr by 2055 (HVAC capex compounding) — expect insurance premiums to compound above CPI over the hold.
Questions for the listing agent
- It's been on market 81 days. Have you received any prior offers? Is the seller open to a 6% concession, seller financing, or rate buy-down credit?
- What does the HOA fee cover, when was the last increase, and are there any pending special assessments or reserve-fund shortfalls?
- Why hasn't it sold? Are there any deal-killer items the seller is aware of (foundation, flood, title, zoning, code violations)?
- Is there a deadline driving the sale (1031 exchange, divorce, estate, relocation)? That informs how much negotiation room exists.
- Schools are D-rated, which usually means shorter tenancies and higher turnover. Who's the typical renter profile here, and what's been the actual vacancy rate?
- What's the average days-on-market for RENTAL listings here right now (not sales)? A rising rental-DOM trend means longer vacancies and softer asking-rent achievability than the comps imply.
- What's the recent tenant-quality profile in this submarket — average credit score on applications, eviction rate, late-payment / NSF rate, and stable-employment percentage? A property-management company in the area should have these aggregated.
- How much new for-sale + rental construction is in the pipeline within 1–3 miles? Heavy new supply typically softens prices + rents 12–24 months out; constrained supply supports both.
Investment metrics
- 1% rule
- 1.30% ✓
- Cap rate
- 9.91%
- Cash-on-cash
- 12.93%
- DSCR
- 1.58
- GRM
- 6.4
CMA / ARV
- ARV (median comp)
- $107,400
- List price
- $142,000
- Delta
- 32.22%
- Verdict
- OVERPRICED
- Comps
- 8 within 1.0 mi
Show comp detail 10 sales within ~0.75 mi
| Address | Dist | Beds/Ba | Sqft | Sold | Price | $/sf | Match |
|---|---|---|---|---|---|---|---|
| 842 Elm Dr | 0.11mi | 2/1.0 | 800 (0%) | 19mo | $125,000 | $156 | 76 |
| 864 Chestnut Dr | 0.07mi | 1/1.0 (-1) | 756 (-6%) | 10mo | $139,000 | $184 | 70 |
| 1304 Discovery | 0.10mi | 1/1.0 (-1) | 800 (0%) | 20mo | $135,000 | $169 | 70 |
| 814 Grove Ave | 0.16mi | 1/1.0 (-1) | 800 (0%) | 19mo | $145,000 | $181 | 68 |
| 1365 Sierra Dr | 0.19mi | 1/1.0 (-1) | 824 (+3%) | 12mo | $112,000 | $136 | 67 |
| 1381 Sierra Dr | 0.20mi | 1/1.0 (-1) | 700 (-12%) | 1mo | $78,000 | $111 | 60 |
| 1427 Sierra Dr | 0.24mi | 1/1.0 (-1) | 700 (-12%) | 3mo | $145,000 | $207 | 56 |
| 833 Grove Ave | 0.17mi | 1/1.0 (-1) | 700 (-12%) | 13mo | $112,000 | $160 | 51 |
| 1423 Sierra Dr | 0.23mi | 1/1.0 (-1) | 750 (-6%) | 22mo | $129,900 | $173 | 51 |
| 1367 Western Dr | 0.22mi | 2/1.0 | 680 (-15%) | 17mo | $125,000 | $184 | 47 |
Match score weights: distance 35% · size 25% · config 20% · recency 20%. Top-matched comps best support the ARV.
Projected returns pro-forma
-3.0% appreciation · 2.61% rent growth · sell at horizon
- IRR
- 2.4%
- Equity multiple
- 1.09×
- Total profit
- $3,622
- Equity at exit
- $21,173
- IRR
- 11.6%
- Equity multiple
- 1.90×
- Total profit
- $35,599
- Equity at exit
- $12,278
Cash invested: $39,760 (down + closing). Projections, not guarantees.
Landlord ↔ Tenant lean methodology
- Overall (STATE)
- 18 Strongly Tenant-Friendly
- State California
- 18 Strongly Tenant-Friendly · D+13
- County
- — inherits STATE
- City
- — inherits STATE
ZIP-level market 92583
- Home prices YoY
- -14.8%
- Rents YoY
- 2.6%
- Active inventory
- 159
- Price-to-rent
- 6.4×
Monthly cashflow live
- Estimated rent
- $1,851 high interval (Pro) →
- Mortgage (P&I)
- −$745
- Tax from tax record
- −$30 /mo · $357/yr
- Insurance
- −$59
- HOA
- −$200
- Vacancy / Maint / Mgmt
- −$389
- Net cashflow
- $429
Break-even live
UW: 25.0% down · 7.5% · 30yr · 1.5% tax · 5.0% vac · 8.0% maint · 8.0% mgmt
Financing live
Cash to close
- Down payment
- $35,500
- Closing costs
- $4,260
- Reserves months
- —
- Total cash needed
- —
Loan-product check · same deal, 3 products live
Conventional
25% down · 7.5% · 30yr
- Down + closing
- —
- Monthly P&I
- —
- Monthly cashflow
- —
- DSCR
- —
- Eligible?
- —
Personal DTI + credit; lowest rate.
DSCR
20% down · 8.5% · 30yr
- Down + closing
- —
- Monthly P&I
- —
- Monthly cashflow
- —
- DSCR
- —
- Eligible?
- —
No personal income docs; deal must DSCR.
Hard money
10% down · 12.0% · 12mo
- Down + closing
- —
- Monthly P&I
- —
- Monthly cashflow
- —
- DSCR
- —
- Eligible?
- —
Short-term bridge; refi at stabilization.
Rent comps 10 comps
| Address | Beds | Baths | Sqft | Rent | $/sqft | DOM | Units | Dist |
|---|---|---|---|---|---|---|---|---|
| 918 Acorn Dr San Jacinto, CA | 1.0 | 1.0 | 600 | $1,600 | $2.67 | 43d | 1 | 0.09mi |
| 1311 Heritage Ranch Rd San Jacinto, CA | 2.0 | 1.5 | 900 | $1,750 | $1.94 | 43d | 1 | 0.09mi |
| 1382 Western Dr San Jacinto, CA | 1.0 | 1.0 | 700 | $1,650 | $2.36 | 43d | 1 | 0.21mi |
| 1453 Prospect Dr #82 San Jacinto, CA | 1.0 | 1.0 | 800 | $1,495 | $1.87 | 43d | 1 | 0.24mi |
| 1344 Sierra Seneca Dr San Jacinto, CA | 2.0 | 2.0 | 1100 | $2,000 | $1.82 | 5d | 1 | 0.28mi |
| 1318 Bushy Tail Trl San Jacinto, CA | 2.0 | 2.0 | 1040 | $1,750 | $1.68 | 24d | 1 | 0.33mi |
| 1397 Bushy Tail Trl San Jacinto, CA | 2.0 | 2.0 | 937 | $1,795 | $1.92 | 43d | 1 | 0.37mi |
| 419 Angela Way San Jacinto, CA | 3.0 | 1.0 | 988 | $2,150 | $2.18 | 14d | 1 | 1.03mi |
| 249 Idyllwild Dr San Jacinto, CA | 3.0 | 2.0 | 1025 | $2,300 | $2.24 | 43d | 1 | 1.12mi |
| 157 W Washburn Ave San Jacinto, CA | 2.0 | 1.0 | 850 | $1,795 | $2.11 | 43d | 1 | 1.27mi |
HOA detail
- Monthly dues
- $200 · $2,400/yr
- Likely covers
- watersewertrashinternetcablepoolgymsecurity
Listing history 34 events
-
2026-06-18days on market $142,000 Active 81 DOM
-
2026-06-17days on market $142,000 Active 80 DOM
-
2026-06-16days on market $142,000 Active 79 DOM
-
2026-06-15days on market $142,000 Active 78 DOM
-
2026-06-13days on market $142,000 Active 76 DOM
-
2026-06-13days on market $142,000 Active 75 DOM
-
2026-06-09days on market $142,000 Active 72 DOM
-
2026-06-08days on market $142,000 Active 71 DOM
-
2026-06-07days on market $142,000 Active 70 DOM
-
2026-06-04days on market $142,000 Active 67 DOM
-
2026-06-03days on market $142,000 Active 66 DOM
-
2026-06-02days on market $142,000 Active 65 DOM
-
2026-06-01days on market $142,000 Active 64 DOM
-
2026-05-31days on market $142,000 Active 63 DOM
-
2026-05-07status Active 1125-char remark
Show marketing remark (1125 chars)
55+ Manufactured home on PERMANENT LAND, so you own the land and no land lease is paid. Come make this home yours as it serves as a great retirement home, vacation home, or even a great and affordable primary residence! The home is in immaculate condition as it boasts brand new flooring throughout the entire home, new double paneled windows (which are energy efficient) in all windows of the home, brand new restroom renovation in the master room, and a gorgeous, custom made kitchen with quality carpentry. It also has a carport long enough for 2 cars and washer/dryer hookups are available. The park offers lots of amenities that are included in the low HOA fee of $200/month such as a clubhouse, gym, recreation room, billiard room, spa and pool, bike trails and a gated entrance with controlled access. Also, it includes your utilities of water, trash, sewer, internet, and cable TV ALL in the low HOA fee. And best of all, you are minutes away from the Soboba Casino Resort, grocery stores, and several high rated restaurants. Contact me for any questions or to schedule a showing appointment! Se habla Español!
-
2026-04-07status Pending Sale 1125-char remark
Show marketing remark (1125 chars)
55+ Manufactured home on PERMANENT LAND, so you own the land and no land lease is paid. Come make this home yours as it serves as a great retirement home, vacation home, or even a great and affordable primary residence! The home is in immaculate condition as it boasts brand new flooring throughout the entire home, new double paneled windows (which are energy efficient) in all windows of the home, brand new restroom renovation in the master room, and a gorgeous, custom made kitchen with quality carpentry. It also has a carport long enough for 2 cars and washer/dryer hookups are available. The park offers lots of amenities that are included in the low HOA fee of $200/month such as a clubhouse, gym, recreation room, billiard room, spa and pool, bike trails and a gated entrance with controlled access. Also, it includes your utilities of water, trash, sewer, internet, and cable TV ALL in the low HOA fee. And best of all, you are minutes away from the Soboba Casino Resort, grocery stores, and several high rated restaurants. Contact me for any questions or to schedule a showing appointment! Se habla Español!
-
2026-02-27$142,000 Active 1125-char remark
Show marketing remark (1125 chars)
55+ Manufactured home on PERMANENT LAND, so you own the land and no land lease is paid. Come make this home yours as it serves as a great retirement home, vacation home, or even a great and affordable primary residence! The home is in immaculate condition as it boasts brand new flooring throughout the entire home, new double paneled windows (which are energy efficient) in all windows of the home, brand new restroom renovation in the master room, and a gorgeous, custom made kitchen with quality carpentry. It also has a carport long enough for 2 cars and washer/dryer hookups are available. The park offers lots of amenities that are included in the low HOA fee of $200/month such as a clubhouse, gym, recreation room, billiard room, spa and pool, bike trails and a gated entrance with controlled access. Also, it includes your utilities of water, trash, sewer, internet, and cable TV ALL in the low HOA fee. And best of all, you are minutes away from the Soboba Casino Resort, grocery stores, and several high rated restaurants. Contact me for any questions or to schedule a showing appointment! Se habla Español!
-
2026-01-31historical
-
2025-10-10price $144,900
-
2025-05-14price $149,900
-
2025-04-23$159,900 Active
-
2024-12-31historical
-
2024-05-21price $155,000
-
2024-05-02$157,000 Active
-
2017-08-03historical Hold Do Not Show
-
2017-06-25price $50,000
-
2017-05-12$55,000 Active
-
2017-03-28historical
-
2017-03-21status Active
-
2017-03-08historical Hold Do Not Show
-
2017-02-06price $55,000
-
2016-12-28price $60,000
-
2016-12-23$65,000 Active
-
2004-05-14soldstatus $25,000
ⓘ Source: listings_history table (triggers on properties + properties_extension) + one-shot
backfill from property_details.listing_events for pre-trigger history.
Tax reassessment forecast CA · Resets to sale price
- Current annual tax
- $357 · $30/mo
- Projected year-2 tax
- $1,079 · $90/mo
- Expected delta
- +$722/yr (+$60/mo · 202.3%)
ⓘ Screening estimate from a state-policy table — verify with the county assessor before closing.
Climate risk First Street
- Flood 5/10 Major FEMA zone X · 67% chance over 30 yrs
- Wildfire 8/10 Severe
- Heat 7/10 Severe 7 d/yr ≥103°F today · 20 d/yr by 30 yrs out
- Wind 1/10 Low
- Air quality 6/10 Major 12 unhealthy d/yr today · 14 by 30 yrs out
Nearby sold comps map
Loading sold comps map…
Walkable amenities ~0.75 mi
Loading nearby amenities…
Taxation est. · year 1
- Rental income
- $22,210
- − Mortgage interest
- −$7,954
- − Property taxes
- −$357
- − Insurance
- −$710
- − Repairs & maintenance
- −$1,777
- − Management
- −$1,777
- − HOA
- −$2,400
- − Depreciation
- −$4,131
- Taxable income
- $3,104
- Est. tax owed @ 24.0%
- −$745
- After-tax cash flow
- $4,398/yr
For passive investors: Depreciation is non-cash, so a rental often shows a tax loss while cash-flowing — sheltering income. Rental losses are passive: they offset passive income freely, and up to $25,000/yr can offset ordinary (W-2) income if you actively participate and your MAGI is under $100k (phasing out to $0 by $150k); unused losses carry forward. On sale, claimed depreciation is recaptured at up to 25%, and gains may owe capital-gains tax (a 1031 exchange can defer both). Figures are a year-1 estimate at your 24.0% rate — not tax advice; consult a CPA.
Schools (NCES district)
- District
- San Jacinto Unified
- NCES district ID
- 0634440
- Math proficiency
- 13% ▼ -9.00%
- Reading proficiency
- 36% ▬ 0.00%
- Median HH income
- $43,560
- Composite
- 20.94/100
- National rank
- #8478
- State rank
- #421 of 517 in CA
Livability — San Jacinto
- Score
- 63/100
- State rank
- #467
- US rank
- #15889
Category grades
Schools grade is shown separately in the Schools card above.
Census & demographics
- Census place
- San Jacinto, CA
- County
- Riverside County · 2,287,001 people
- City population
- 33,778
- Metro
- Riverside-San Bernardino-Ontario, CA
- Population (ZIP)
- 33,778
- Household income
- $68,351
- Rent vs Own
- Severe rent burden
- 747.0
Population outlook (Riverside County) Hauer SSP2
- Today (2025)
- 2,664,475 people
- By 2030
- 2,802,692 · +5.2%
- By 2040
- 3,050,904 · +14.5%
- By 2050
- 3,256,783 · +22.2%
- By 2075
- 3,655,058 · +37.2%
- By 2100
- 3,766,594 · +41.4%
Race, ethnicity, and origin ACS 2023
- Neighborhood character
- Diverse neighborhood (Simpson 0.57)
- Race & ethnicity
- Hispanic / Latino 60% White 26% Two or more races 23% Black 5% Asian 3% Native American 3%
- Hispanic origin (detail)
- Mexican 52%
- Common ancestry
- Lithuanian 1% Iranian 1% Portuguese 1%
- Foreign-born
- 20% · Canada
- Languages at home
- 56% English-only · Spanish 40% Tagalog/Filipino 2% Other Asian/Pacific 1%
Political lean MEDSL · Riverside
- 2024 margin
- Toss-up / Even · D 48.0% · R 49.3% · Other 2.6%
- 2008→2024 swing
- -3.6pp toward R · 2008: 2.3pp · 2024: -1.3pp
- All cycles
- 2024: R+1.3 2020: D+8.0 2016: D+4.3 2012: R+0.4 2008: D+2.3
Not yet ingested
- Civics
- —
Market trends
- HPI YoY
- ▼ -71.15%
- Current HPI
- 407.8584
- Rent YoY
- ▲ 2.61%
- Metro
- Riverside-San Bernardino-Ontario, CA
- State GDP YoY
- ▲ 3.21%
- F500 in state
- 116
Industry mix (Fortune 500 HQ in CA)
| Industry | F500 HQs | Revenue |
|---|---|---|
| Technology | 27 | $1,492B |
|
||
| Financial Services | 3 | $174B |
|
||
| Retail | 3 | $44B |
|
||
| Insurance | 3 | $26B |
|
||
| Media / Entertainment | 2 | $115B |
|
||
| Pharmaceuticals / Biotech | 2 | $62B |
|
||
Price history
+468.0% since first listed20 events — show timeline
- 2026-05-07 Relisted — CRMLS
- 2026-04-07 Pending — CRMLS
- 2026-02-27 Listed $142,000 CRMLS
- 2026-01-31 Listing Removed — CRMLS
- 2025-10-10 Price Changed $144,900 CRMLS
- 2025-05-14 Price Changed $149,900 CRMLS
- 2025-04-23 Listed $159,900 CRMLS
- 2024-12-31 Listing Removed — CRMLS
- 2024-05-21 Price Changed $155,000 CRMLS
- 2024-05-02 Listed $157,000 CRMLS
- 2017-08-03 Delisted — CRMLS
- 2017-06-25 Price Changed $50,000 CRMLS
- 2017-05-12 Listed $55,000 CRMLS
- 2017-03-28 Listing Removed — CRMLS
- 2017-03-21 Relisted — CRMLS
- 2017-03-08 Delisted — CRMLS
- 2017-02-06 Price Changed $55,000 CRMLS
- 2016-12-28 Price Changed $60,000 CRMLS
- 2016-12-23 Listed $65,000 CRMLS
- 2004-05-14 Sold (Public Records) $25,000 Public Records
Property tax history
+2.9%/yrLatest (2014): $357 · -2.8% YoY. Source: county tax records.
Cash-flow waterfall
monthlySold comps — $/sqft
last 12 mo · ≤1 miLoading sold comps…