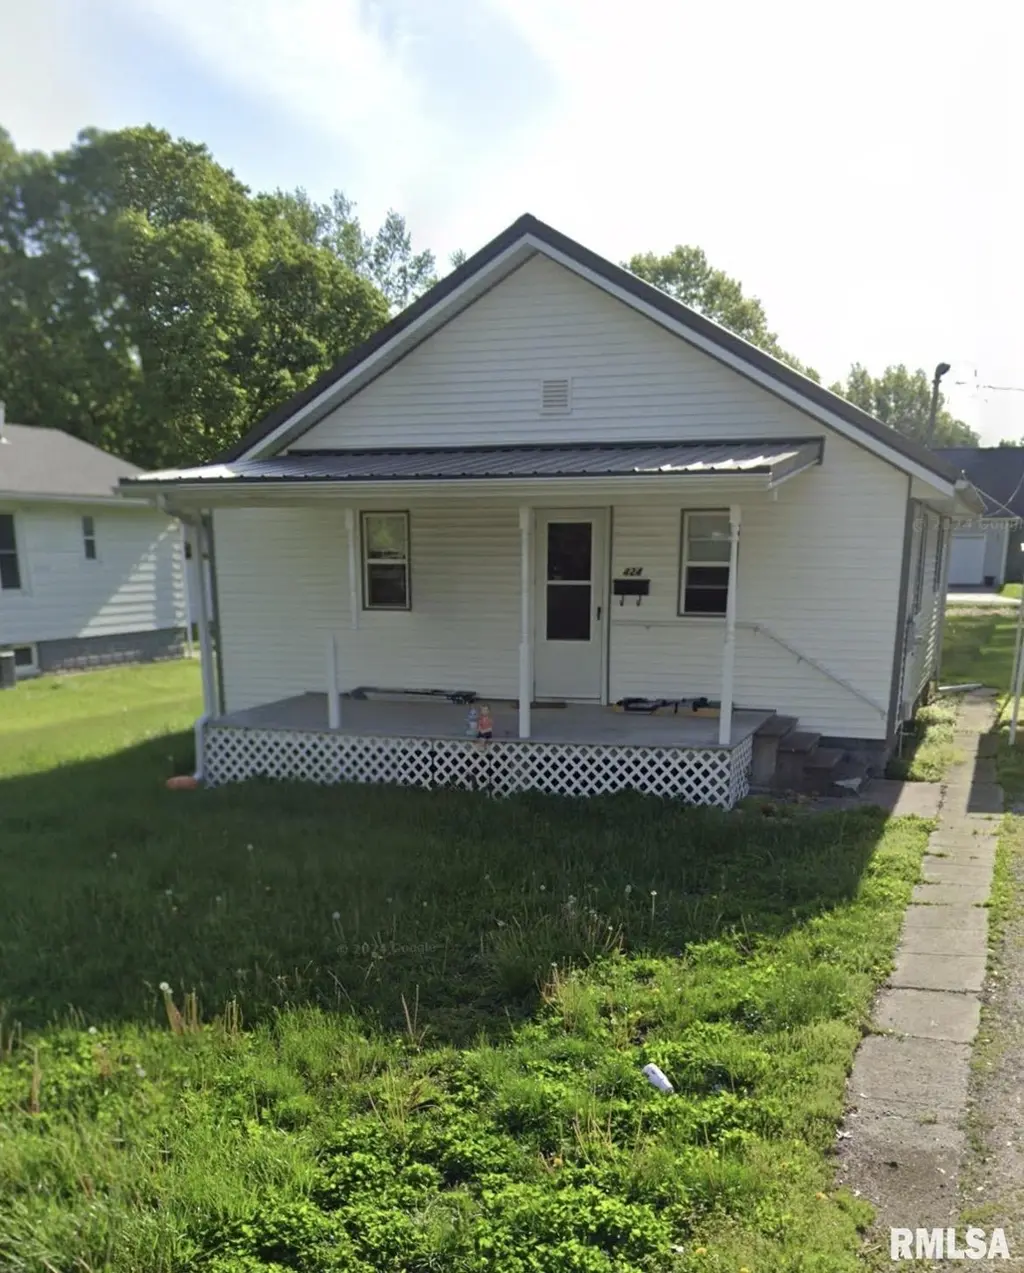
424 N White Ave · Taylorville, IL
Flood risk 4/10 · Minor
- FEMA flood zone
- X (unshaded)
- Chance of flooding over 30 yrs
- 0.22%
- Est. flood insurance / yr
- $507 – $1,088
Fire risk 1/10 · Minimal
- Est. fire insurance / yr
- $804 – $1,492
Heat risk 4/10 · Minor
- Hot days now (above 106°F)
- 7 days/yr
- Hot days in 30 yrs
- 20 days/yr
Wind risk 2/10 · Minimal
- Chance of severe wind over 30 yrs
- 2.0%
Air-quality risk 2/10 · Minimal
- Unhealthy air days now
- 1 days/yr
- Unhealthy air days in 30 yrs
- 2 days/yr
Risk factors via First Street. Map © Google.
Why this score? — see what drove the B grade
The composite is a weighted blend of 9 inputs, each scored 0–100. Each bar is that input's sub-score; the figure is the points it added to the 100-point composite (weight × sub-score).
- Cash flow +29.1/30.0
- ARV discount +13.9/15.0
- DSCR +10.0/10.0
- 1% rule +7.6/10.0
- Livability +3.4/5.0
- Rent growth +2.5/5.0
- Condition / age +2.5/5.0
- Schools +2.0/10.0
- Appreciation +0.0/10.0
$69,900
🖨 Deal sheet 📄 Offer letter ✓ Due diligence
Listing remarks MLS
50 Year Metal Roof and siding replaced in January of 2022! Cozy home in a nice neighborhood. 2-bedroom. 1 bath. Laundry on main floor. Large kitchen. Carport at end of Drive. Nice Utility shed with workbench. 1/2 Basement with Updated 100 amp breaker box and High efficiency furnace. Nice clean move in ready Home. Being Sold "AS IS".
Key facts
- 7,100 sq ft lot
- Parking
- Built 1920
Neighborhood map
What this means for you Summary
Snapshot
- This is a 2-bed/2.0-bath single-family listed at $70k.
Deal economics
- At list price, monthly cash flow is $242 ($3k/yr) — positive.
- The deal already cash-flows at list — no discount required.
- Meets the 1% rule at list price ($878 rent vs $70k).
- Cap rate 10.5% vs local median 4.1% in Taylorville — top-decile yield for the area; either an underpriced asset or a hidden risk that comps aren't pricing in. Stress-test before assuming the spread holds.
Location & tenants
- Location reads 68/100 on livability (#478 in IL) — a middle-class / working-renter tenant base. Strengths: cost of living A+, housing A+, crime B+; Watch: employment D, amenities F, commute F.
- Taylorville CUSD 3 (town): math 14% / reading 31% proficiency, ranked #383 of 620 in IL (top 62%) — low school quality limits family demand, transient renter base, plan for 1-2y turnover.
- Zoned schools: Taylorville Sr High School (math 12% / reading 17%, grade F, #479 of 693 statewide, top 71%, 781 students, 0% FRL) — zoned schools average 0% FRL vs 46% district-wide (46 pts lower); this property's tenant base skews higher-income than the district average.
- Market conditions: 85 active listings in the ZIP; 26 units permitted in Christian County in 2024 (0 in 5+ unit buildings).
Forward outlook
- Local home prices are declining (-3.0%/yr); year-one equity from $483 of loan paydown is wiped out by about $2k of value loss. Plan a longer hold.
- Christian County population projected at -24% by 2050 — secular population decline; favor cash flow + early exit over multi-decade hold.
- At projected returns (-3.0% appreciation + 3.0% rent growth), your $20k cash investment doubles in ~8 years — after that, you're playing with house money.
Negotiation context
- Only 0 days on market — expect competitive offers; lowballing is unlikely to land.
- 2 sale attempts since 4y ago with the ask held roughly flat each time — persistent listings suggest the price (not the market) is what's stuck; bring a comps-based counter.
- Current owner paid $60k; 16% above their basis — modest negotiation headroom, anchor on the comps not their cost.
Risks & watch-outs
- Watch-outs: built in 1920 — expect roof / HVAC / electrical / plumbing capex.
Questions for the listing agent
- Built in 1920 — when were the roof, HVAC, electrical panel, plumbing, and water heater last replaced?
- Is there a deadline driving the sale (1031 exchange, divorce, estate, relocation)? That informs how much negotiation room exists.
- Schools are F-rated, which usually means shorter tenancies and higher turnover. Who's the typical renter profile here, and what's been the actual vacancy rate?
- What's the average days-on-market for RENTAL listings here right now (not sales)? A rising rental-DOM trend means longer vacancies and softer asking-rent achievability than the comps imply.
- What's the recent tenant-quality profile in this submarket — average credit score on applications, eviction rate, late-payment / NSF rate, and stable-employment percentage? A property-management company in the area should have these aggregated.
- How much new for-sale + rental construction is in the pipeline within 1–3 miles? Heavy new supply typically softens prices + rents 12–24 months out; constrained supply supports both.
Investment metrics
- 1% rule
- 1.26% ✓
- Cap rate
- 10.45%
- Cash-on-cash
- 14.85%
- DSCR
- 1.66
- GRM
- 6.6
CMA / ARV
- ARV (on-the-fly)
- $81,536
- Comps found
- 5
Show comp detail 5 sales within ~0.75 mi
| Address | Dist | Beds/Ba | Sqft | Sold | Price | $/sf | Match |
|---|---|---|---|---|---|---|---|
| 417 N Cheney St | 0.18mi | 2/1.0 | 725 (-0%) | 0mo | $65,500 | $90 | 86 |
| 625 N Silver St | 0.18mi | 2/1.0 | 756 (+4%) | 7mo | $87,500 | $116 | 75 |
| 913 Hawley Ave | 0.55mi | 2/1.0 | 775 (+6%) | 7mo | $40,000 | $52 | 54 |
| 931 W Rich St | 0.73mi | 3/1.0 (+1) | 728 (0%) | 9mo | $95,000 | $130 | 50 |
| 1019 W Franklin St | 0.46mi | 2/1.0 | 672 (-8%) | 21mo | $75,000 | $112 | 44 |
Match score weights: distance 35% · size 25% · config 20% · recency 20%. Top-matched comps best support the ARV.
Projected returns pro-forma
-3.0% appreciation · 3.0% rent growth · sell at horizon
- IRR
- 5.4%
- Equity multiple
- 1.21×
- Total profit
- $4,090
- Equity at exit
- $10,422
- IRR
- 14.8%
- Equity multiple
- 2.20×
- Total profit
- $23,395
- Equity at exit
- $6,044
Cash invested: $19,572 (down + closing). Projections, not guarantees.
Landlord ↔ Tenant lean methodology
- Overall (STATE)
- 43 Moderately Tenant-Leaning
- State Illinois
- 43 Moderately Tenant-Leaning · D+7
- County
- — inherits STATE
- City
- — inherits STATE
ZIP-level market 62568
- Active inventory
- 85
- Price-to-rent
- 6.6×
Monthly cashflow live
- Estimated rent
- $878 medium interval (Pro) →
- Mortgage (P&I)
- −$367
- Tax from tax record
- −$56 /mo · $668/yr
- Insurance
- −$29
- HOA
- −$0
- Vacancy / Maint / Mgmt
- −$184
- Net cashflow
- $242
Break-even live
UW: 25.0% down · 7.5% · 30yr · 1.5% tax · 5.0% vac · 8.0% maint · 8.0% mgmt
Financing live
Cash to close
- Down payment
- $17,475
- Closing costs
- $2,097
- Reserves months
- —
- Total cash needed
- —
Loan-product check · same deal, 3 products live
Conventional
25% down · 7.5% · 30yr
- Down + closing
- —
- Monthly P&I
- —
- Monthly cashflow
- —
- DSCR
- —
- Eligible?
- —
Personal DTI + credit; lowest rate.
DSCR
20% down · 8.5% · 30yr
- Down + closing
- —
- Monthly P&I
- —
- Monthly cashflow
- —
- DSCR
- —
- Eligible?
- —
No personal income docs; deal must DSCR.
Hard money
10% down · 12.0% · 12mo
- Down + closing
- —
- Monthly P&I
- —
- Monthly cashflow
- —
- DSCR
- —
- Eligible?
- —
Short-term bridge; refi at stabilization.
Listing history 1 events
-
2026-06-18$69,900 Pending
ⓘ Source: listings_history table (triggers on properties + properties_extension) + one-shot
backfill from property_details.listing_events for pre-trigger history.
Tax reassessment forecast IL · Partial reset (capped growth)
- Current annual tax
- $668 · $56/mo
- Projected year-2 tax
- $1,127 · $94/mo
- Expected delta
- +$459/yr (+$38/mo · 68.8%)
ⓘ Screening estimate from a state-policy table — verify with the county assessor before closing.
Climate risk First Street
- Flood 4/10 Moderate FEMA zone X (unshaded) · 22% chance over 30 yrs
- Wildfire 1/10 Low
- Heat 4/10 Moderate 7 d/yr ≥106°F today · 20 d/yr by 30 yrs out
- Wind 2/10 Low 2% chance of damaging wind over 30 yrs
- Air quality 2/10 Low 1 unhealthy d/yr today · 2 by 30 yrs out
Nearby sold comps map
Loading sold comps map…
Walkable amenities ~0.75 mi
Loading nearby amenities…
Taxation est. · year 1
- Rental income
- $10,534
- − Mortgage interest
- −$3,915
- − Property taxes
- −$668
- − Insurance
- −$350
- − Repairs & maintenance
- −$843
- − Management
- −$843
- − Depreciation
- −$2,033
- Taxable income
- $1,882
- Est. tax owed @ 24.0%
- −$452
- After-tax cash flow
- $2,454/yr
For passive investors: Depreciation is non-cash, so a rental often shows a tax loss while cash-flowing — sheltering income. Rental losses are passive: they offset passive income freely, and up to $25,000/yr can offset ordinary (W-2) income if you actively participate and your MAGI is under $100k (phasing out to $0 by $150k); unused losses carry forward. On sale, claimed depreciation is recaptured at up to 25%, and gains may owe capital-gains tax (a 1031 exchange can defer both). Figures are a year-1 estimate at your 24.0% rate — not tax advice; consult a CPA.
Schools (NCES district)
- District
- Taylorville CUSD 3
- NCES district ID
- 1738700
- Math proficiency
- 14% ▼ -17.00%
- Reading proficiency
- 31% ▼ -10.00%
- Median HH income
- $45,940
- Composite
- 19.53/100
- National rank
- #8764
- State rank
- #383 of 620 in IL
Livability — Taylorville
- Score
- 68/100
- State rank
- #478
- US rank
- #9895
Category grades
Schools grade is shown separately in the Schools card above.
Census & demographics
- Census place
- Taylorville, IL
- City population
- 16,035
- Population (ZIP)
- 16,035
Population outlook (Christian County) Hauer SSP2
- Today (2025)
- 31,182 people
- By 2030
- 29,787 · -4.5%
- By 2040
- 26,793 · -14.1%
- By 2050
- 23,757 · -23.8%
- By 2075
- 17,333 · -44.4%
- By 2100
- 11,573 · -62.9%
Race, ethnicity, and origin ACS 2023
- Neighborhood character
- Predominantly White (91%)
- Race & ethnicity
- White 91% Black 4% Two or more races 2% Hispanic / Latino 2% Asian 1%
- Common ancestry
- Lithuanian 2% Slovak 2% Romanian 1%
- Foreign-born
- 2% · Canada
- Languages at home
- 97% English-only · Spanish 2% Other Indo-European 1%
Political lean MEDSL · Christian
- 2024 margin
- Solid R (+46.7) · D 25.9% · R 72.6% · Other 1.5%
- 2008→2024 swing
- -40.4pp toward R · 2008: -6.3pp · 2024: -46.7pp
- All cycles
- 2024: R+46.7 2020: R+44.6 2016: R+42.7 2012: R+23.1 2008: R+6.3
Not yet ingested
- Civics
- —
Market trends
- HPI YoY
- ▼ -171.77%
- Current HPI
- 159.2588
- Rent YoY
- —
- Metro
- —
- State GDP YoY
- ▲ 1.59%
- F500 in state
- 60
Industry mix (Fortune 500 HQ in IL)
| Industry | F500 HQs | Revenue |
|---|---|---|
| Insurance | 4 | $201B |
|
||
| Consumer Goods | 4 | $87B |
|
||
| Industrial Machinery | 3 | $64B |
|
||
| Healthcare | 2 | $55B |
|
||
| Retail / Pharmacy | 1 | $148B |
|
||
| Agriculture / Food | 1 | $86B |
|
||
Price history
+217.7% since first listed7 events — show timeline
- 2026-06-17 Listing Removed — RMLSA as Distributed by MLS Grid
- 2026-06-17 Listed $69,900 RMLSA as Distributed by MLS Grid
- 2022-11-10 Sold (MLS) $60,000 RMLSA as Distributed by MLS Grid
- 2022-10-03 Contingent — RMLSA as Distributed by MLS Grid
- 2022-09-27 Listed $59,900 RMLSA as Distributed by MLS Grid
- 2005-09-08 Sold (Public Records) $32,000 Public Records
- 1994-01-01 Sold (Public Records) $22,000 Public Records
Property tax history
+5.6%/yrLatest (2025): $668 · -1.5% YoY. Source: county tax records.
Cash-flow waterfall
monthlySold comps — $/sqft
last 12 mo · ≤1 miLoading sold comps…