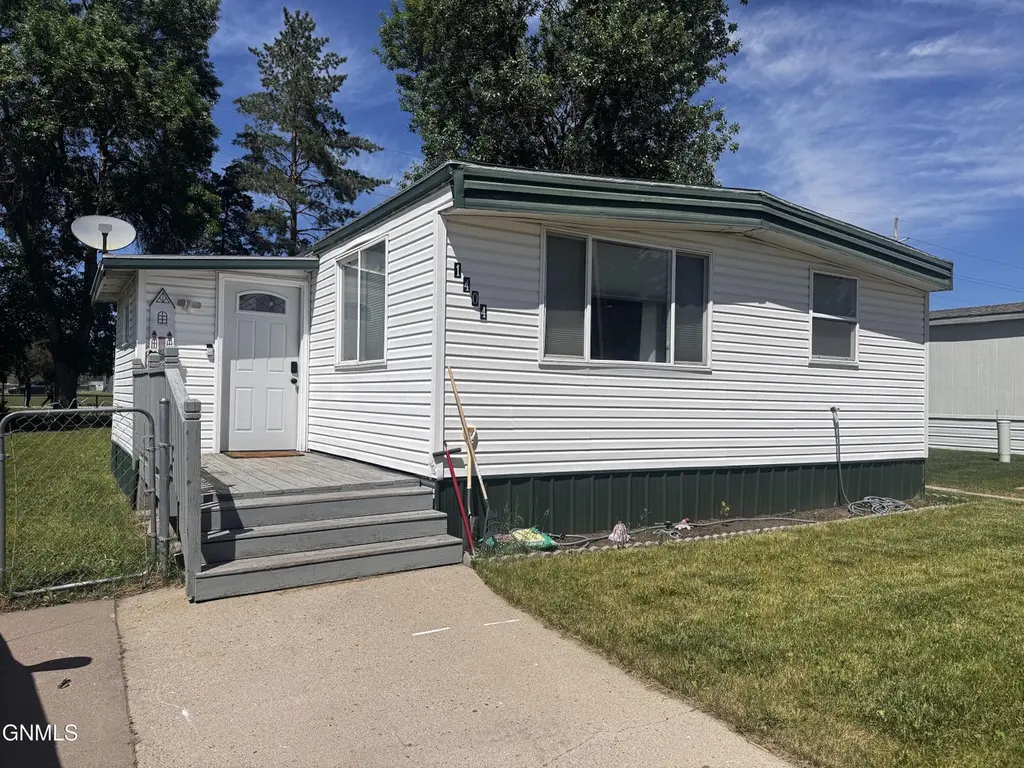
1404 Virginia Ave · Bismarck, ND
Flood risk 3/10 · Minor
- FEMA flood zone
- X (shaded)
- Chance of flooding over 30 yrs
- 0.2%
- Est. flood insurance / yr
- $473 – $860
Fire risk 4/10 · Minor
- Est. fire insurance / yr
- $1,289 – $2,393
Heat risk 2/10 · Minimal
- Hot days now (above 97°F)
- 7 days/yr
- Hot days in 30 yrs
- 12 days/yr
Wind risk 2/10 · Minimal
- Chance of severe wind over 30 yrs
- —
Air-quality risk 4/10 · Minor
- Unhealthy air days now
- 5 days/yr
- Unhealthy air days in 30 yrs
- 5 days/yr
Risk factors via First Street. Map © Google.
Why this score? — see what drove the B+ grade
The composite is a weighted blend of 9 inputs, each scored 0–100. Each bar is that input's sub-score; the figure is the points it added to the 100-point composite (weight × sub-score).
- Cash flow +30.0/30.0
- ARV discount +15.0/15.0
- 1% rule +10.0/10.0
- DSCR +10.0/10.0
- Livability +4.0/5.0
- Schools +3.7/10.0
- Rent growth +3.2/5.0
- Condition / age +2.5/5.0
- Appreciation +0.0/10.0
$39,900
🖨 Deal sheet 📄 Offer letter ✓ Due diligence
Listing remarks MLS
New front entry door, deck recently stained and updated entry shed. 3 Bedroom, 2 bath double wide in Colonial Estates. Some of the features include sheetrocked walls and ceiling, recessed lighting throughout, living room wired for surround sound, and a large primary master suite. Primary suite has a garden soak-er tub, separate walk-in shower, a nice vanity with cabinets and a walk-in closet. Open kitchen, living room, dining area and a center island with seating. New dishwasher and the furnace was replaced in 2018. No backyard neighbors. Seller has never lived in the home. Agent is related to the seller. Buyer will need the association approval prior to closing. A must to see!!
Key facts
- Fenced yard
- Updated flooring
- Walk-in shower
Tags
Property features AI
Exterior
- Utilities: Public water; Public sewer
- Home design: Single-story double wide mobile home; Residential mobile home
- Construction: Vinyl siding; Block foundation; Built as a double wide mobile home
- Exterior features: Chain link fencing; Rubber roof; No basement
Interior
- Kitchen: Electric range; Dishwasher; Refrigerator
- Bathrooms: 2 full bathrooms
- Heating & cooling: Central air; Ceiling fan(s); Forced air (natural gas)
- Interior features: Dishwasher; Dryer; Electric Range; Refrigerator; Washer; Ceiling fan(s); Central air; Forced air heating; Natural gas heating
- Laundry & utility: Washer; Dryer
Neighborhood map
What this means for you Summary
Snapshot
- This is a 3-bed/2.0-bath manufactured listed at $40k.
Deal economics
- At list price, monthly cash flow is $920 ($11k/yr) — positive.
- The deal already cash-flows at list — no discount required.
- Meets the 1% rule at list price ($1k rent vs $40k).
- Cap rate 34.0% vs local median 3.1% in Bismarck — top-decile yield for the area; either an underpriced asset or a hidden risk that comps aren't pricing in. Stress-test before assuming the spread holds.
Location & tenants
- Location reads 79/100 on livability (#5 in ND, #2,213 nationally) — a middle-class / working-renter tenant base. Strengths: housing A+, health & safety A+, cost of living A; Watch: crime C-, amenities D+, commute F.
- Bismarck 1 (urban): math 41% / reading 42% proficiency, ranked #25 of 53 in ND (top 47%) — families likely to look elsewhere, expect single-tenant / working-renter base with shorter leases; only 19% free/reduced lunch — higher-income household profile.
- Zoned schools: Jeannette Myhre Elementary School (math 22% / reading 22%, grade F, #216 of 236 statewide, top 93%, 254 students, 65% FRL); Wachter Middle School (math 34% / reading 34%, grade F, #26 of 35 statewide, top 79%, 1,000 students, 30% FRL); Bismarck High School (math 22% / reading 38%, grade F, #90 of 144 statewide, top 66%, 1,333 students, 27% FRL) — zoned schools average 41% FRL vs 19% district-wide (22 pts higher); higher-poverty schools than district average — tighter screening recommended.
- Zoned-school proficiency averages 29% at this address vs 42% district-wide (-13 pts) — the specific schools serving this property underperform the Bismarck 1 average; the district grade overstates school quality for this exact location.
- Market conditions: Rents rising (+2.8%/yr); 258 active listings in the ZIP; 14 comparable units currently listed for rent nearby; rentals at typical pace (median 21d on market — plan ~3-4 weeks tenant-placement turnaround); solid renter incomes; 259 units permitted in Burleigh County in 2024 (0 in 5+ unit buildings).
Forward outlook
- Local home prices are declining (-3.0%/yr); year-one equity from $276 of loan paydown is wiped out by about $1k of value loss. Plan a longer hold.
- Burleigh County population projected at +61% by 2050 — long-run rental-demand tailwind backs the buy-and-hold thesis.
- At projected returns (-3.0% appreciation + 2.8% rent growth), your $11k cash investment doubles in ~2 years — after that, you're playing with house money.
Negotiation context
- Only 6 days on market — expect competitive offers; lowballing is unlikely to land.
- 3 sale attempts since 12y ago with the ask held roughly flat each time — persistent listings suggest the price (not the market) is what's stuck; bring a comps-based counter.
Questions for the listing agent
- Built in 1973 — when were the roof, HVAC, electrical panel, plumbing, and water heater last replaced?
- Is there a deadline driving the sale (1031 exchange, divorce, estate, relocation)? That informs how much negotiation room exists.
- Schools are B-rated — typically a magnet for longer-tenancy family renters. What's the average tenant stay here, and is there a school-zone premium baked into asking?
- What's the average days-on-market for RENTAL listings here right now (not sales)? A rising rental-DOM trend means longer vacancies and softer asking-rent achievability than the comps imply.
- What's the recent tenant-quality profile in this submarket — average credit score on applications, eviction rate, late-payment / NSF rate, and stable-employment percentage? A property-management company in the area should have these aggregated.
- How much new for-sale + rental construction is in the pipeline within 1–3 miles? Heavy new supply typically softens prices + rents 12–24 months out; constrained supply supports both.
Investment metrics
- 1% rule
- 3.68% ✓
- Cap rate
- 33.95%
- Cash-on-cash
- 98.79%
- DSCR
- 5.40
- GRM
- 2.3
CMA / ARV
- ARV (on-the-fly)
- $69,888
- Comps found
- 8
Show comp detail 8 sales within ~0.75 mi
| Address | Dist | Beds/Ba | Sqft | Sold | Price | $/sf | Match |
|---|---|---|---|---|---|---|---|
| 1119 University Dr #1101 | 0.35mi | 3/2.0 | 1,344 (0%) | 0mo | $95,000 | $71 | 83 |
| 227 Connecticut St | 0.20mi | 3/2.0 | 1,456 (+8%) | 0mo | $57,000 | $39 | 76 |
| 1119 University Dr #1705 | 0.35mi | 4/2.0 (+1) | 1,440 (+7%) | 0mo | $57,600 | $40 | 66 |
| 725 S 12th St #204 | 0.17mi | 4/2.0 (+1) | 1,440 (+7%) | 19mo | $75,000 | $52 | 59 |
| 246 Boeing Ave | 0.50mi | 3/2.0 | 1,424 (+6%) | 10mo | $39,000 | $27 | 58 |
| 129 New Jersey St | 0.16mi | 3/2.0 | 1,216 (-10%) | 23mo | $72,900 | $60 | 57 |
| 101 Northwest Dr | 0.52mi | 3/2.0 | 1,165 (-13%) | 12mo | $79,000 | $68 | 44 |
| 162 Northwest Dr | 0.65mi | 3/2.0 | 1,216 (-10%) | 15mo | $63,000 | $52 | 42 |
Match score weights: distance 35% · size 25% · config 20% · recency 20%. Top-matched comps best support the ARV.
Projected returns pro-forma
-3.0% appreciation · 2.81% rent growth · sell at horizon
- IRR
- 99.6%
- Equity multiple
- 5.64×
- Total profit
- $51,832
- Equity at exit
- $5,949
- IRR
- —
- Equity multiple
- 11.69×
- Total profit
- $119,418
- Equity at exit
- $3,450
Cash invested: $11,172 (down + closing). Projections, not guarantees.
Landlord ↔ Tenant lean methodology
- Overall (STATE)
- 82 Strongly Landlord-Friendly
- State North Dakota
- 82 Strongly Landlord-Friendly · R+20
- County
- — inherits STATE
- City
- — inherits STATE
ZIP-level market 58504
- Rents YoY
- 2.8%
- Active inventory
- 258
- Price-to-rent
- 2.3×
Monthly cashflow live
- Estimated rent
- $1,467 high interval (Pro) →
- Mortgage (P&I)
- −$209
- Tax from tax record
- −$14 /mo · $162/yr
- Insurance
- −$17
- HOA
- −$0
- Vacancy / Maint / Mgmt
- −$308
- Net cashflow
- $920
Break-even live
UW: 25.0% down · 7.5% · 30yr · 1.5% tax · 5.0% vac · 8.0% maint · 8.0% mgmt
Financing live
Cash to close
- Down payment
- $9,975
- Closing costs
- $1,197
- Reserves months
- —
- Total cash needed
- —
Loan-product check · same deal, 3 products live
Conventional
25% down · 7.5% · 30yr
- Down + closing
- —
- Monthly P&I
- —
- Monthly cashflow
- —
- DSCR
- —
- Eligible?
- —
Personal DTI + credit; lowest rate.
DSCR
20% down · 8.5% · 30yr
- Down + closing
- —
- Monthly P&I
- —
- Monthly cashflow
- —
- DSCR
- —
- Eligible?
- —
No personal income docs; deal must DSCR.
Hard money
10% down · 12.0% · 12mo
- Down + closing
- —
- Monthly P&I
- —
- Monthly cashflow
- —
- DSCR
- —
- Eligible?
- —
Short-term bridge; refi at stabilization.
Rent comps 14 comps
| Address | Beds | Baths | Sqft | Rent | $/sqft | DOM | Units | Dist |
|---|---|---|---|---|---|---|---|---|
| 505 1/2 S 10th St Bismarck, ND | 3.0 | 1.0 | 1500 | $1,600 | $1.07 | 21d | 1 | 0.54mi |
| 2020 S 12th St Bismarck, ND | 3.0 | 1.0–2.0 | 1185 | $1,955 | $1.65 | 21d | 19 | 0.87mi |
| 215 E Arbor Ave Unit 205-305G Bismarck, ND | 2.0 | 2.0 | 1031 | $995 | $0.97 | 21d | 1 | 0.87mi |
| 215 E Arbor Ave Unit 201-302E Bismarck, ND | 2.0 | 1.0 | 1100 | $995 | $0.90 | 21d | 1 | 0.87mi |
| 172 Boise Ave Bismarck, ND | 2.0 | 1.0 | 1200 | $1,050 | $0.88 | 21d | 1 | 0.89mi |
| 205 E Arbor Ave Bismarck, ND | 2.0 | 2.0 | 1031 | $995 | $0.97 | 21d | 1 | 0.92mi |
| 201 E Arbor Ave Bismarck, ND | 2.0 | 1.0 | 1100 | $995 | $0.90 | 21d | 1 | 0.94mi |
| 2130 S 12th St Bismarck, ND | 1.0–3.0 | 1.0–2.0 | 1152 | $1,980 | $1.72 | 21d | 12 | 0.98mi |
| 407 N 12th St Unit 3/4 Bismarck, ND | 2.0 | 1.0 | 1100 | $1,200 | $1.09 | 21d | 1 | 1.03mi |
| 2316 E Broadway Ave Bismarck, ND | 3.0 | 1.0 | 1113 | $1,250 | $1.12 | 21d | 1 | 1.12mi |
| 1543 S Washington St Bismarck, ND | 3.0 | 2.0 | 1500 | $2,050 | $1.37 | 21d | 1 | 1.20mi |
| 2220 East Avenue A Unit 1/2 Bismarck, ND | 3.0 | 1.0 | 1227 | $1,150 | $0.94 | 21d | 1 | 1.24mi |
| 700 N 22nd St Bismarck, ND | 2.0 | 1.0 | 1000 | $1,500 | $1.50 | 21d | 1 | 1.35mi |
| 127 Stuttgart Dr Unit 1 Bismarck, ND | 2.0 | 2.0 | 1600 | $1,400 | $0.88 | 21d | 1 | 1.39mi |
Listing history 5 events
-
2026-06-10status $39,900 Pending 6 DOM
-
2026-06-09days on market $39,900 Active 6 DOM
-
2026-06-08days on market $39,900 Active 5 DOM
-
2026-06-07days on market $39,900 Active 4 DOM
-
2026-06-03$39,900 Active 1 DOM
ⓘ Source: listings_history table (triggers on properties + properties_extension) + one-shot
backfill from property_details.listing_events for pre-trigger history.
Tax reassessment forecast ND · Resets to sale price
- Current annual tax
- $162 · $14/mo
- Projected year-2 tax
- $391 · $33/mo
- Expected delta
- +$229/yr (+$19/mo · 141.4%)
ⓘ Screening estimate from a state-policy table — verify with the county assessor before closing.
Climate risk First Street
- Flood 3/10 Moderate FEMA zone X (shaded) · 20% chance over 30 yrs
- Wildfire 4/10 Moderate
- Heat 2/10 Low 7 d/yr ≥97°F today · 12 d/yr by 30 yrs out
- Wind 2/10 Low
- Air quality 4/10 Moderate 5 unhealthy d/yr today · 5 by 30 yrs out
Nearby sold comps map
Loading sold comps map…
Walkable amenities ~0.75 mi
Loading nearby amenities…
Taxation est. · year 1
- Rental income
- $17,607
- − Mortgage interest
- −$2,235
- − Property taxes
- −$162
- − Insurance
- −$200
- − Repairs & maintenance
- −$1,409
- − Management
- −$1,409
- − Depreciation
- −$1,161
- Taxable income
- $11,032
- Est. tax owed @ 24.0%
- −$2,648
- After-tax cash flow
- $8,389/yr
For passive investors: Depreciation is non-cash, so a rental often shows a tax loss while cash-flowing — sheltering income. Rental losses are passive: they offset passive income freely, and up to $25,000/yr can offset ordinary (W-2) income if you actively participate and your MAGI is under $100k (phasing out to $0 by $150k); unused losses carry forward. On sale, claimed depreciation is recaptured at up to 25%, and gains may owe capital-gains tax (a 1031 exchange can defer both). Figures are a year-1 estimate at your 24.0% rate — not tax advice; consult a CPA.
Schools (NCES district)
- District
- Bismarck 1
- NCES district ID
- 3800014
- Math proficiency
- 41% ▼ -5.00%
- Reading proficiency
- 42% ▼ -6.00%
- Median HH income
- $60,649
- Composite
- 36.76/100
- National rank
- #4577
- State rank
- #25 of 53 in ND
Livability — Bismarck
- Score
- 79/100
- State rank
- #5
- US rank
- #2213
Category grades
Schools grade is shown separately in the Schools card above.
Census & demographics
- Census place
- Bismarck, ND
- County
- Burleigh County · 97,300 people
- Metro
- Bismarck, ND
- Population (ZIP)
- 30,212
- Household income
- $85,637
- Rent vs Own
- Severe rent burden
- 400.0
Population outlook (Burleigh County) Hauer SSP2
- Today (2025)
- 119,359 people
- By 2030
- 133,047 · +11.5%
- By 2040
- 161,545 · +35.3%
- By 2050
- 191,960 · +60.8%
- By 2075
- 274,569 · +130.0%
- By 2100
- 350,910 · +194.0%
Race, ethnicity, and origin ACS 2023
- Neighborhood character
- Predominantly White (84%)
- Race & ethnicity
- White 84% Native American 8% Two or more races 5% Hispanic / Latino 4%
- Common ancestry
- Portuguese 13% Scotch-Irish 5% Romanian 2%
- Foreign-born
- 2% · Canada
- Languages at home
- 97% English-only · Spanish 2%
Political lean MEDSL · Burleigh
- 2024 margin
- Solid R (+43.2) · D 27.5% · R 70.7% · Other 1.8%
- 2008→2024 swing
- -19.7pp toward R · 2008: -23.6pp · 2024: -43.2pp
- All cycles
- 2024: R+43.2 2020: R+40.2 2016: R+46.1 2012: R+32.1 2008: R+23.6
Not yet ingested
- Civics
- —
Market trends
- HPI YoY
- ▼ -158.70%
- Current HPI
- 210.0651
- Rent YoY
- ▲ 2.81%
- Metro
- Bismarck, ND
- State GDP YoY
- ▲ 2.09%
- F500 in state
- 2
Industry mix (Fortune 500 HQ in ND)
| Industry | F500 HQs | Revenue |
|---|---|---|
| Utilities / Construction | 1 | $6B |
|
||
Price history
+0.0% since first listed5 events — show timeline
- 2026-06-03 Listed $39,900 GNMLS
- 2022-11-07 Sold (MLS) — GNMLS
- 2022-08-04 Listed $39,900 GNMLS
- 2014-10-14 Sold (MLS) — GNMLS
- 2014-08-27 Listed $39,900 GNMLS
Cash-flow waterfall
monthlySold comps — $/sqft
last 12 mo · ≤1 miLoading sold comps…