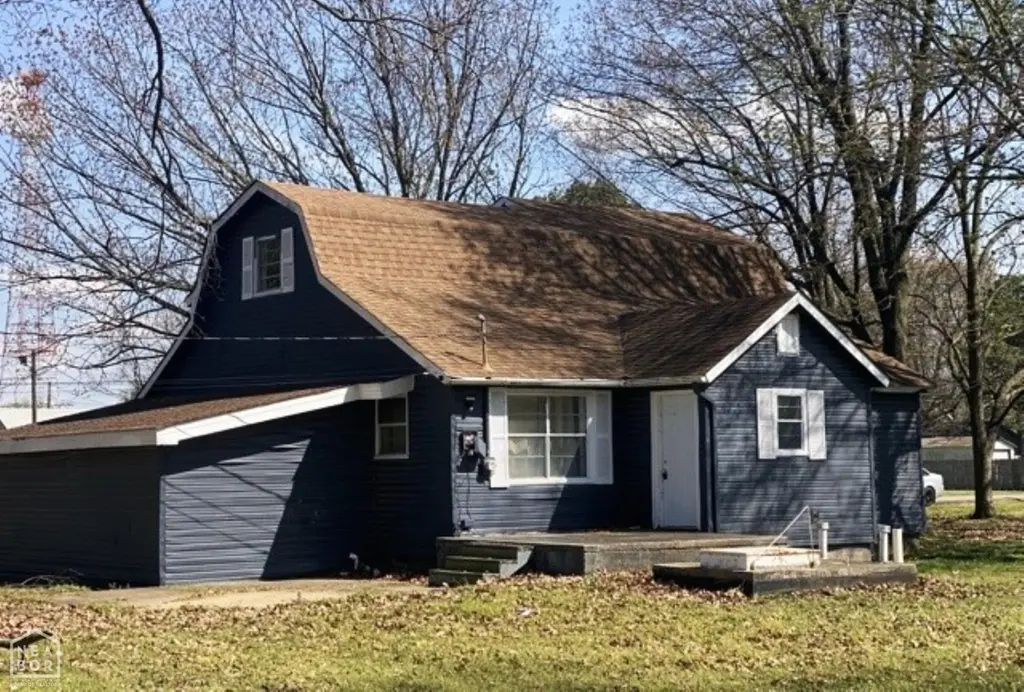
217 Forrest St · Bay, AR
Flood risk 3/10 · Minor
- FEMA flood zone
- AE
- Chance of flooding over 30 yrs
- 0.2%
- Est. flood insurance / yr
- $1,737 – $8,500
Fire risk 1/10 · Minimal
- Est. fire insurance / yr
- $1,499 – $2,785
Heat risk 6/10 · Moderate
- Hot days now (above 109°F)
- 7 days/yr
- Hot days in 30 yrs
- 22 days/yr
Wind risk 4/10 · Minor
- Chance of severe wind over 30 yrs
- 10.0%
Air-quality risk 2/10 · Minimal
- Unhealthy air days now
- 0 days/yr
- Unhealthy air days in 30 yrs
- 1 days/yr
Risk factors via First Street. Map © Google.
Why this score? — see what drove the B+ grade
The composite is a weighted blend of 9 inputs, each scored 0–100. Each bar is that input's sub-score; the figure is the points it added to the 100-point composite (weight × sub-score).
- Cash flow +30.0/30.0
- 1% rule +10.0/10.0
- DSCR +10.0/10.0
- Appreciation +8.8/10.0
- ARV discount +7.5/15.0
- Livability +3.6/5.0
- Schools +2.9/10.0
- Rent growth +2.5/5.0
- Condition / age +2.5/5.0
$55,000
🖨 Deal sheet (PDF) 📄 Offer letter ✓ Due diligence
Listing remarks MLS
3 bedroom, 2 bathroom fixer-upper. Current systems/appliances are not guaranteed to work. To be sold AS-IS but this property has great potential! On the main level find 1 bedroom and 1 bathroom along with the Laundry room. Upstairs are 2 bedrooms and 1 bathroom. This home will not work for FHA, VA, RD or any Secondary Market loan. Agents see private remarks.
Key facts
- 0.24 acre lot
- Parking
- Listed 40 days
Neighborhood map
What this means for you Summary
Snapshot
- This is a 3-bed/2.0-bath single-family listed at $55k.
Deal economics
- At list price, monthly cash flow is $34 ($405/yr) — positive.
- The deal already cash-flows at list — no discount required.
- Meets the 1% rule at list price ($1k rent vs $55k).
- Recommended offer: $53k (3.0% below list) — sets the bar for market timing.
Location & tenants
- Location reads 72/100 on livability (#28 in AR) — a middle-class / working-renter tenant base. Strengths: crime A+, cost of living A+, housing A+; Watch: employment C-, amenities F, commute F.
- Bay School District (rural): math 33% / reading 37% proficiency, ranked #120 of 238 in AR (top 50%) — families likely to look elsewhere, expect single-tenant / working-renter base with shorter leases.
- Zoned schools: Bay Elementary School (math 42% / reading 32%, grade F, #229 of 454 statewide, top 54%, 321 students, 63% FRL); Bay High School (math 27% / reading 42%, grade F, #92 of 292 statewide, top 37%, 241 students, 52% FRL).
- Market conditions: 13 active listings in the ZIP; 926 units permitted in Craighead County in 2024 (69 in 5+ unit buildings).
Forward outlook
- In year one you build about $5k of equity ($380 loan paydown + $4k appreciation (7.5% local appreciation)).
- Craighead County population projected at +38% by 2050 — long-run rental-demand tailwind backs the buy-and-hold thesis.
- At projected returns (7.5% appreciation + 3.0% rent growth), your $15k cash investment doubles in ~3 years — after that, you're playing with house money.
- By year 7, paydown + projected appreciation supports a ~$31k cash-out refi (75% LTV) — recoverable capital for the next deal without selling this one.
Negotiation context
- It's been on market 40 days — a 3% lower offer ($53k) is reasonable based on typical stale-listing flexibility.
- 10 sale attempts since 6y ago with the ask held roughly flat each time — persistent listings suggest the price (not the market) is what's stuck; bring a comps-based counter.
Risks & watch-outs
- Watch-outs: flood insurance adds $427/mo.
- Climate carrying-cost: in FEMA flood zone AE (mandatory federal flood insurance); extreme-heat days projected 7→22/yr by 2055 (HVAC capex compounding) — expect insurance premiums to compound above CPI over the hold.
Questions for the listing agent
- It's been on market 40 days. Have you received any prior offers? Is the seller open to a 3% concession, seller financing, or rate buy-down credit?
- What's the actual annual flood-insurance premium (NFIP or private), and is the property in a SFHA with mandatory coverage?
- Is there a deadline driving the sale (1031 exchange, divorce, estate, relocation)? That informs how much negotiation room exists.
- Schools are D-rated, which usually means shorter tenancies and higher turnover. Who's the typical renter profile here, and what's been the actual vacancy rate?
- What's the average days-on-market for RENTAL listings here right now (not sales)? A rising rental-DOM trend means longer vacancies and softer asking-rent achievability than the comps imply.
- What's the recent tenant-quality profile in this submarket — average credit score on applications, eviction rate, late-payment / NSF rate, and stable-employment percentage? A property-management company in the area should have these aggregated.
- How much new for-sale + rental construction is in the pipeline within 1–3 miles? Heavy new supply typically softens prices + rents 12–24 months out; constrained supply supports both.
Investment metrics
- 1% rule
- 1.85% ✓
- Cap rate
- 16.34%
- Cash-on-cash
- 35.87%
- DSCR
- 2.60
- GRM
- 4.5
CMA / ARV
- ARV (median comp)
- $166,427
- List price
- $55,000
- Delta
- -66.95%
- Verdict
- UNDERPRICED
- Comps
- 20 within 1.0 mi
Show comp detail 9 sales within ~0.75 mi
| Address | Dist | Beds/Ba | Sqft | Sold | Price | $/sf | Match |
|---|---|---|---|---|---|---|---|
| 110 Church St | 0.14mi | 3/2.0 | 1,536 (-2%) | 13mo | $199,900 | $130 | 79 |
| 204 Fielder St | 0.36mi | 3/2.0 | 1,484 (-5%) | 2mo | $179,900 | $121 | 73 |
| 205 Sparkey Dr | 0.35mi | 4/3.0 (+1) | 1,451 (-8%) | 9mo | $161,100 | $111 | 55 |
| 600 Fielder St | 0.34mi | 3/1.5 | 1,367 (-13%) | 8mo | $185,000 | $135 | 54 |
| 125 Summer Leigh Cv | 0.38mi | 3/2.0 | 1,345 (-14%) | 6mo | $194,500 | $145 | 54 |
| 213 N Bay | 0.48mi | 3/2.0 | 1,728 (+10%) | 14mo | $220,000 | $127 | 49 |
| 114 Mallard Cv | 0.55mi | 4/2.0 (+1) | 1,693 (+8%) | 11mo | $210,000 | $124 | 46 |
| 102 Woody Ln | 0.67mi | 3/2.0 | 1,734 (+11%) | 7mo | $250,000 | $144 | 45 |
| 504 Holmes | 0.56mi | 2/1.0 (-1) | 1,418 (-10%) | 20mo | $95,700 | $67 | 32 |
Match score weights: distance 35% · size 25% · config 20% · recency 20%. Top-matched comps best support the ARV.
Projected returns pro-forma
7.54% appreciation · 3.0% rent growth · sell at horizon
- IRR
- 21.2%
- Equity multiple
- 2.52×
- Total profit
- $23,457
- Equity at exit
- $40,077
- IRR
- 19.8%
- Equity multiple
- 5.35×
- Total profit
- $66,970
- Equity at exit
- $77,977
Cash invested: $15,400 (down + closing). Projections, not guarantees.
Landlord ↔ Tenant lean methodology
- Overall (STATE)
- 92 Strongly Landlord-Friendly
- State Arkansas
- 92 Strongly Landlord-Friendly · R+14
- County
- — inherits STATE
- City
- — inherits STATE
ZIP-level market 72411
- Home prices YoY
- 3.5%
- Active inventory
- 13
- Price-to-rent
- 4.5×
Monthly cashflow live
- Estimated rent
- $1,019 medium interval (Pro) →
- Mortgage (P&I)
- −$288
- Tax from tax record
- −$33 /mo · $397/yr
- Insurance
- −$23
- Flood insurance flood zone
- −$427 /mo · $5,118/yr
- HOA
- −$0
- Vacancy / Maint / Mgmt
- −$214
- Net cashflow
- $34
Break-even live
Sensitivity live
| Price | -10% $65 | -5% $49 | +0% $34 | +5% $18 | +10% $3 |
|---|---|---|---|---|---|
| Rent | -10% $-47 | -5% $-6 | +0% $34 | +5% $74 | +10% $114 |
| Rate | -1.0pp $61 | -0.5pp $48 | base $34 | +0.5pp $20 | +1.0pp $5 |
UW: 25.0% down · 7.5% · 30yr · 1.5% tax · 5.0% vac · 8.0% maint · 8.0% mgmt
Financing live
Cash to close
- Down payment
- $13,750
- Closing costs
- $1,650
- Reserves months
- —
- Total cash needed
- —
Loan-product check · same deal, 3 products live
Conventional
25% down · 7.5% · 30yr
- Down + closing
- —
- Monthly P&I
- —
- Monthly cashflow
- —
- DSCR
- —
- Eligible?
- —
Personal DTI + credit; lowest rate.
DSCR
20% down · 8.5% · 30yr
- Down + closing
- —
- Monthly P&I
- —
- Monthly cashflow
- —
- DSCR
- —
- Eligible?
- —
No personal income docs; deal must DSCR.
Hard money
10% down · 12.0% · 12mo
- Down + closing
- —
- Monthly P&I
- —
- Monthly cashflow
- —
- DSCR
- —
- Eligible?
- —
Short-term bridge; refi at stabilization.
Listing history 23 events
-
2026-04-11$55,000 Active 360-char remark
Show marketing remark (360 chars)
3 bedroom, 2 bathroom fixer-upper. Current systems/appliances are not guaranteed to work. To be sold AS-IS but this property has great potential! On the main level find 1 bedroom and 1 bathroom along with the Laundry room. Upstairs are 2 bedrooms and 1 bathroom. This home will not work for FHA, VA, RD or any Secondary Market loan. Agents see private remarks.
-
2026-04-10$55,000 New Listing 360-char remark
Show marketing remark (360 chars)
3 bedroom, 2 bathroom fixer-upper. Current systems/appliances are not guaranteed to work. To be sold AS-IS but this property has great potential! On the main level find 1 bedroom and 1 bathroom along with the Laundry room. Upstairs are 2 bedrooms and 1 bathroom. This home will not work for FHA, VA, RD or any Secondary Market loan. Agents see private remarks.
-
2025-07-03historical
-
2025-05-20status Back on Market
-
2025-05-20status Active
-
2025-04-22historical
-
2025-04-22status Under Contract
-
2024-12-23status Back on Market
-
2024-12-23status Active
-
2024-11-24historical
-
2024-11-24status Under Contract
-
2024-08-20price $147,900
-
2024-08-19price $147,900
-
2024-07-25$154,900 Active
-
2024-07-25$154,900 New Listing
-
2022-02-10soldstatus $129,000
-
2022-02-09soldstatus $129,000
-
2021-11-24$124,900
-
2020-04-23soldstatus $67,500
-
2020-01-30$79,900
-
2010-03-09soldstatus $66,000
-
2007-03-09soldstatus $60,000
-
1996-08-20soldstatus $47,000
ⓘ Source: listings_history table (triggers on properties + properties_extension) + one-shot
backfill from property_details.listing_events for pre-trigger history.
Tax reassessment forecast AR · Resets to sale price
- Current annual tax
- $397 · $33/mo
- Projected year-2 tax
- $397 · $33/mo
- Expected delta
- $0/yr ($0/mo · 0.0%)
ⓘ Screening estimate from a state-policy table — verify with the county assessor before closing.
Climate risk First Street
- Flood 3/10 Moderate FEMA zone AE · 20% chance over 30 yrs
- Wildfire 1/10 Low
- Heat 6/10 Major 7 d/yr ≥109°F today · 22 d/yr by 30 yrs out
- Wind 4/10 Moderate 10% chance of damaging wind over 30 yrs
- Air quality 2/10 Low 0 unhealthy d/yr today · 1 by 30 yrs out
Nearby sold comps map
Loading sold comps map…
Walkable amenities ~0.75 mi
Loading nearby amenities…
Taxation est. · year 1
- Rental income
- $12,224
- − Mortgage interest
- −$3,081
- − Property taxes
- −$397
- − Insurance
- −$5,394
- − Repairs & maintenance
- −$978
- − Management
- −$978
- − Depreciation
- −$1,600
- Taxable loss
- −$203
- Est. tax savings @ 24.0%
- +$49
- After-tax cash flow
- $454/yr
For passive investors: Depreciation is non-cash, so a rental often shows a tax loss while cash-flowing — sheltering income. Rental losses are passive: they offset passive income freely, and up to $25,000/yr can offset ordinary (W-2) income if you actively participate and your MAGI is under $100k (phasing out to $0 by $150k); unused losses carry forward. On sale, claimed depreciation is recaptured at up to 25%, and gains may owe capital-gains tax (a 1031 exchange can defer both). Figures are a year-1 estimate at your 24.0% rate — not tax advice; consult a CPA.
Schools (NCES district)
- District
- Bay School District
- NCES district ID
- 0502820
- Math proficiency
- 33% ▼ -6.00%
- Reading proficiency
- 37% ▼ -5.00%
- Median HH income
- $37,197
- Composite
- 29.12/100
- National rank
- #6587
- State rank
- #120 of 238 in AR
Livability — Bay
- Score
- 72/100
- State rank
- #28
- US rank
- #5958
Category grades
Schools grade is shown separately in the Schools card above.
Census & demographics
- Census place
- Bay, AR
- Population (ZIP)
- 3,072
Population outlook (Craighead County) Hauer SSP2
- Today (2025)
- 122,235 people
- By 2030
- 131,338 · +7.4%
- By 2040
- 149,862 · +22.6%
- By 2050
- 168,034 · +37.5%
- By 2075
- 208,094 · +70.2%
- By 2100
- 233,251 · +90.8%
Race, ethnicity, and origin ACS 2023
- Neighborhood character
- Predominantly White (81%)
- Race & ethnicity
- White 81% Hispanic / Latino 15% Two or more races 3% Black 1%
- Hispanic origin (detail)
- Mexican 15%
- Common ancestry
- Slovak 8% Iranian 2% Lithuanian 1%
- Foreign-born
- 5% · Canada
- Languages at home
- 89% English-only · Spanish 11%
Political lean MEDSL · Craighead
- 2024 margin
- Solid R (+37.4) · D 30.1% · R 67.5% · Other 2.4%
- 2008→2024 swing
- -12.9pp toward R · 2008: -24.5pp · 2024: -37.4pp
- All cycles
- 2024: R+37.4 2020: R+35.4 2016: R+35.2 2012: R+31.1 2008: R+24.5
Not yet ingested
- Civics
- —
Market trends
- HPI YoY
- ▲ 7.54%
- Current HPI
- 222.9201
- Rent YoY
- —
- Metro
- —
- State GDP YoY
- ▲ 3.80%
- F500 in state
- 10
Industry mix (Fortune 500 HQ in AR)
| Industry | F500 HQs | Revenue |
|---|---|---|
| Retail | 1 | $681B |
|
||
| Food / Agriculture | 1 | $53B |
|
||
| Retail / Energy | 1 | $22B |
|
||
| Transportation / Logistics | 1 | $12B |
|
||
| Energy | 1 | $4B |
|
||
Price history
+17.0% since first listed23 events — show timeline
- 2026-04-11 Listed $55,000 NEABOR MLS
- 2026-04-10 Listed $55,000 CARMLS
- 2025-07-03 Listing Removed — CARMLS
- 2025-05-20 Relisted — CARMLS
- 2025-05-20 Relisted — NEABOR MLS
- 2025-04-22 Delisted — NEABOR MLS
- 2025-04-22 Pending — CARMLS
- 2024-12-23 Relisted — CARMLS
- 2024-12-23 Relisted — NEABOR MLS
- 2024-11-24 Delisted — NEABOR MLS
- 2024-11-24 Pending — CARMLS
- 2024-08-20 Price Changed $147,900 CARMLS
- 2024-08-19 Price Changed $147,900 NEABOR MLS
- 2024-07-25 Listed $154,900 CARMLS
- 2024-07-25 Listed $154,900 NEABOR MLS
- 2022-02-10 Sold (Public Records) $129,000 Public Records
- 2022-02-09 Sold (MLS) $129,000 NEABOR MLS
- 2021-11-24 Listed $124,900 NEABOR MLS
- 2020-04-23 Sold (MLS) $67,500 NEABOR MLS
- 2020-01-30 Listed $79,900 NEABOR MLS
- 2010-03-09 Sold (Public Records) $66,000 Public Records
- 2007-03-09 Sold (Public Records) $60,000 Public Records
- 1996-08-20 Sold (Public Records) $47,000 Public Records
Property tax history
+2.9%/yrLatest (2025): $397 · -20.1% YoY. Source: county tax records.
Cash-flow waterfall
monthlySold comps — $/sqft
last 12 mo · ≤1 miLoading sold comps…