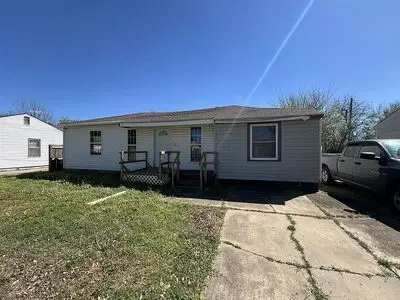
700 Procter Pl · Midwest City, OK
Flood risk 1/10 · Minimal
- FEMA flood zone
- X (unshaded)
- Chance of flooding over 30 yrs
- 0.0%
- Est. flood insurance / yr
- $507 – $1,088
Fire risk 1/10 · Minimal
- Est. fire insurance / yr
- $2,463 – $4,575
Heat risk 6/10 · Moderate
- Hot days now (above 107°F)
- 7 days/yr
- Hot days in 30 yrs
- 19 days/yr
Wind risk 2/10 · Minimal
- Chance of severe wind over 30 yrs
- 4.0%
Air-quality risk 2/10 · Minimal
- Unhealthy air days now
- 1 days/yr
- Unhealthy air days in 30 yrs
- 2 days/yr
Risk factors via First Street. Map © Google.
Why this score? — see what drove the B grade
The composite is a weighted blend of 9 inputs, each scored 0–100. Each bar is that input's sub-score; the figure is the points it added to the 100-point composite (weight × sub-score).
- Cash flow +30.0/30.0
- ARV discount +15.0/15.0
- DSCR +10.0/10.0
- 1% rule +7.9/10.0
- Livability +3.6/5.0
- Rent growth +3.2/5.0
- Condition / age +2.5/5.0
- Schools +1.2/10.0
- Appreciation +0.0/10.0
$99,900
🖨 Deal sheet 📄 Offer letter ✓ Due diligence
Listing remarks
Huge potential for flip or rehab and rent. Square footage includes converted garage, master bedroom add-on, and dining room (which was formerly an enclosed porch). County assessor shows only 1232 original feet. Detached garage/workshop is 720 square feet. House needs work on exterior and interior. Formerly had a swimming pool that has been filled with dirt. Rough plumbing and electrical appear to be in good shape. Home needs drywall, subfloor, flooring, finish plumbing, finish electrical, etc. Siding and trim repairs needed on house and garage. Owner is a licensed real estate broker - license # 160529. Email or text for code to view.
Key facts
- Built 1949
- Listed 23 days
Neighborhood map
What this means for you Summary
Snapshot
- This is a 3-bed/2.0-bath single-family listed at $100k.
Deal economics
- At list price, monthly cash flow is $403 ($5k/yr) — positive.
- The deal already cash-flows at list — no discount required.
- Meets the 1% rule at list price ($1k rent vs $100k).
- Recommended offer: $98k (1.5% below list) — sets the bar for market timing.
- Cap rate 11.1% vs local median 5.6% in Midwest City — top-decile yield for the area; either an underpriced asset or a hidden risk that comps aren't pricing in. Stress-test before assuming the spread holds.
Location & tenants
- Location reads 71/100 on livability (#30 in OK) — a middle-class / working-renter tenant base. Strengths: cost of living A+, housing A+, health & safety A; Watch: crime D+, schools D, employment D.
- Midwest City-Del City (suburban): math 10% / reading 17% proficiency, ranked #231 of 270 in OK (top 86%) — low school quality limits family demand, transient renter base, plan for 1-2y turnover.
- Market conditions: Rents rising (+3.0%/yr); 171 active listings in the ZIP; 40 comparable units currently listed for rent nearby; rentals at typical pace (median 17d on market — plan ~3-4 weeks tenant-placement turnaround); 5,365 units permitted in Oklahoma County in 2024 (569 in 5+ unit buildings).
- This rent runs 30% of the median local income ($51k/yr) — at the standard rent-burdened threshold; future hikes will face affordability resistance.
Forward outlook
- Local home prices are declining (-3.0%/yr); year-one equity from $691 of loan paydown is wiped out by about $3k of value loss. Plan a longer hold.
- Oklahoma County population projected at +41% by 2050 — long-run rental-demand tailwind backs the buy-and-hold thesis.
- At projected returns (-3.0% appreciation + 3.0% rent growth), your $28k cash investment doubles in ~7 years — after that, you're playing with house money.
Negotiation context
- It's been on market 23 days — a 2% lower offer ($98k) is reasonable based on typical stale-listing flexibility.
- Current owner paid $40k; list at $100k implies a 150% gain — meaningful room to come down on a strong offer.
Risks & watch-outs
- Watch-outs: built in 1949 — expect roof / HVAC / electrical / plumbing capex.
- Climate carrying-cost: extreme-heat days projected 7→19/yr by 2055 (HVAC capex compounding) — expect insurance premiums to compound above CPI over the hold.
Questions for the listing agent
- Built in 1949 — when were the roof, HVAC, electrical panel, plumbing, and water heater last replaced?
- Is there a deadline driving the sale (1031 exchange, divorce, estate, relocation)? That informs how much negotiation room exists.
- Schools are D-rated, which usually means shorter tenancies and higher turnover. Who's the typical renter profile here, and what's been the actual vacancy rate?
- Crime grade is D in this area — have there been break-ins, vandalism, or insurance claims at this property in the last 3 years? What carrier currently insures it and at what premium?
- What's the average days-on-market for RENTAL listings here right now (not sales)? A rising rental-DOM trend means longer vacancies and softer asking-rent achievability than the comps imply.
- What's the recent tenant-quality profile in this submarket — average credit score on applications, eviction rate, late-payment / NSF rate, and stable-employment percentage? A property-management company in the area should have these aggregated.
- How much new for-sale + rental construction is in the pipeline within 1–3 miles? Heavy new supply typically softens prices + rents 12–24 months out; constrained supply supports both.
Investment metrics
- 1% rule
- 1.29% ✓
- Cap rate
- 11.13%
- Cash-on-cash
- 17.28%
- DSCR
- 1.77
- GRM
- 6.5
CMA / ARV
- ARV (on-the-fly)
- $165,088
- Comps found
- 12
Show comp detail 12 sales within ~0.75 mi
| Address | Dist | Beds/Ba | Sqft | Sold | Price | $/sf | Match |
|---|---|---|---|---|---|---|---|
| 1945 Rulane Dr | 0.38mi | 3/1.5 | 1,224 (-1%) | 0mo | $170,000 | $139 | 79 |
| 1009 Stansell Dr | 0.29mi | 3/2.0 | 1,350 (+10%) | 0mo | $164,900 | $122 | 70 |
| 1616 Rulane Dr | 0.13mi | 3/1.5 | 1,089 (-12%) | 4mo | $169,500 | $156 | 69 |
| 6609 SE 15th St | 0.05mi | 4/1.5 (+1) | 1,363 (+11%) | 8mo | $183,000 | $134 | 66 |
| 114 E Northrup Dr | 0.69mi | 3/2.0 | 1,216 (-1%) | 11mo | $165,000 | $136 | 57 |
| 311 W Lilac Ln | 0.48mi | 4/2.0 (+1) | 1,332 (+8%) | 5mo | $170,000 | $128 | 55 |
| 1111 N Redbud Dr | 0.51mi | 2/1.0 (-1) | 1,154 (-6%) | 3mo | $155,000 | $134 | 55 |
| 913 E Lockheed Dr | 0.69mi | 3/1.0 | 1,246 (+1%) | 10mo | $178,000 | $143 | 54 |
| 6213 SE 9th St | 0.48mi | 4/1.5 (+1) | 1,305 (+6%) | 9mo | $165,000 | $126 | 53 |
| 127 W Lilac Ln | 0.63mi | 3/1.0 | 1,142 (-7%) | 10mo | $150,000 | $131 | 46 |
| 204 Elm St | 0.59mi | 3/1.0 | 1,098 (-11%) | 6mo | $85,000 | $77 | 45 |
| 104 E Mimosa Dr | 0.61mi | 3/1.5 | 1,058 (-14%) | 10mo | $150,000 | $142 | 38 |
Match score weights: distance 35% · size 25% · config 20% · recency 20%. Top-matched comps best support the ARV.
Projected returns pro-forma
-3.0% appreciation · 2.99% rent growth · sell at horizon
- IRR
- 8.6%
- Equity multiple
- 1.34×
- Total profit
- $9,432
- Equity at exit
- $14,895
- IRR
- 17.8%
- Equity multiple
- 2.47×
- Total profit
- $41,089
- Equity at exit
- $8,638
Cash invested: $27,972 (down + closing). Projections, not guarantees.
Landlord ↔ Tenant lean methodology
- Overall (STATE)
- 83 Strongly Landlord-Friendly
- State Oklahoma
- 83 Strongly Landlord-Friendly · R+20
- County
- — inherits STATE
- City
- — inherits STATE
ZIP-level market 73110
- Rents YoY
- 3.0%
- Active inventory
- 171
- Price-to-rent
- 6.5×
Monthly cashflow live
- Estimated rent
- $1,286 high interval (Pro) →
- Mortgage (P&I)
- −$524
- Tax from tax record
- −$48 /mo · $570/yr
- Insurance
- −$42
- HOA
- −$0
- Vacancy / Maint / Mgmt
- −$270
- Net cashflow
- $403
Break-even live
UW: 25.0% down · 7.5% · 30yr · 1.5% tax · 5.0% vac · 8.0% maint · 8.0% mgmt
Financing live
Cash to close
- Down payment
- $24,975
- Closing costs
- $2,997
- Reserves months
- —
- Total cash needed
- —
Loan-product check · same deal, 3 products live
Conventional
25% down · 7.5% · 30yr
- Down + closing
- —
- Monthly P&I
- —
- Monthly cashflow
- —
- DSCR
- —
- Eligible?
- —
Personal DTI + credit; lowest rate.
DSCR
20% down · 8.5% · 30yr
- Down + closing
- —
- Monthly P&I
- —
- Monthly cashflow
- —
- DSCR
- —
- Eligible?
- —
No personal income docs; deal must DSCR.
Hard money
10% down · 12.0% · 12mo
- Down + closing
- —
- Monthly P&I
- —
- Monthly cashflow
- —
- DSCR
- —
- Eligible?
- —
Short-term bridge; refi at stabilization.
Rent comps 40 comps
| Address | Beds | Baths | Sqft | Rent | $/sqft | DOM | Units | Dist |
|---|---|---|---|---|---|---|---|---|
| 6608 SE 15th St Oklahoma City, OK | 3.0 | 2.0 | 1103 | $1,425 | $1.29 | 21d | 1 | 0.05mi |
| 1111 Jet Dr Oklahoma City, OK | 3.0 | 1.0 | 1067 | $1,095 | $1.03 | 21d | 1 | 0.26mi |
| 1111 Jet Dr Oklahoma City, OK | 3.0 | 1.0 | 1067 | $1,095 | $1.03 | 4d | 1 | 0.26mi |
| 317 W Peach St Oklahoma City, OK | 2.0 | 1.0 | 878 | $1,045 | $1.19 | 2d | 1 | 0.31mi |
| 313 W Peach St Oklahoma City, OK | 2.0 | 1.0 | 724 | $975 | $1.35 | 17d | 1 | 0.33mi |
| 314 W Peach St Midwest City, OK | 2.0 | 1.0 | 736 | $950 | $1.29 | 23d | 1 | 0.34mi |
| 1933 Rulane Dr Oklahoma City, OK | 4.0 | 1.0 | 1500 | $1,250 | $0.83 | 23d | 1 | 0.38mi |
| 110 E Myrtle Dr Oklahoma City, OK | 3.0 | 1.5 | 1236 | $1,300 | $1.05 | 11d | 1 | 0.52mi |
| 7122 SE 15th St Oklahoma City, OK | 2.0 | 1.0 | 816 | $1,100 | $1.35 | 4d | 1 | 0.52mi |
| 2220 S Air Depot Blvd Oklahoma City, OK | 3.0 | 1.0 | 1020 | $1,395 | $1.37 | 23d | 1 | 0.56mi |
| 1436 Maple Dr Oklahoma City, OK | 4.0 | 2.0 | 1409 | $1,350 | $0.96 | 16d | 1 | 0.57mi |
| 204 Elm St Oklahoma City, OK | 3.0 | 2.0 | 1098 | $1,250 | $1.14 | 23d | 1 | 0.58mi |
| 210 W Jacobs Dr Oklahoma City, OK | 3.0 | 1.0 | 1200 | $1,200 | $1.00 | 23d | 1 | 0.62mi |
| 6001 SE 8th St Oklahoma City, OK | 3.0 | 2.0 | 1435 | $1,900 | $1.32 | 1d | 1 | 0.65mi |
| 215 W McArthur Dr Oklahoma City, OK | 2.0 | 1.0–2.0 | 795 | $1,122 | $1.41 | 2d | 5 | 0.66mi |
| 407 W Fairchild Dr Oklahoma City, OK | 3.0 | 1.0 | 1062 | $1,045 | $0.98 | 2d | 1 | 0.68mi |
| 120 E Northrup Dr Oklahoma City, OK | 4.0 | 2.0 | 1364 | $1,475 | $1.08 | 23d | 1 | 0.69mi |
| 124 E Northrup Dr Oklahoma City, OK | 4.0 | 1.0 | 1085 | $1,400 | $1.29 | 23d | 1 | 0.71mi |
| 2105 Maple Dr Midwest City, OK | 3.0 | 2.0 | 1032 | $1,295 | $1.25 | 23d | 1 | 0.75mi |
| 201 W Fairchild Dr Oklahoma City, OK | 3.0 | 1.0 | 984 | $975 | $0.99 | 2d | 1 | 0.78mi |
| 423 W Douglas Dr Oklahoma City, OK | 3.0 | 1.0 | 1014 | $1,095 | $1.08 | 21d | 1 | 0.78mi |
| 312 Bolton Pl Oklahoma City, OK | 3.0 | 1.5 | 756 | $1,099 | $1.45 | 23d | 1 | 0.83mi |
| 208 W Ercoupe Dr Oklahoma City, OK | 3.0 | 1.0 | 1125 | $1,500 | $1.33 | 23d | 1 | 0.83mi |
| 209 W Douglas Dr Oklahoma City, OK | 2.0 | 1.0 | 952 | $895 | $0.94 | 17d | 1 | 0.87mi |
| 204 W Lockheed Dr Oklahoma City, OK | 2.0 | 1.0 | 864 | $1,150 | $1.33 | 17d | 1 | 0.89mi |
| 404 Mid America Blvd Oklahoma City, OK | 2.0 | 1.0 | 831 | $1,150 | $1.38 | 2d | 1 | 0.90mi |
| 413 E Northrup Dr Oklahoma City, OK | 3.0 | 1.0 | 800 | $1,395 | $1.74 | 2d | 1 | 0.93mi |
| 422 E Northrup Dr Oklahoma City, OK | 3.0 | 1.0 | 819 | $1,395 | $1.70 | 1d | 1 | 0.99mi |
| 221 E Kerr Dr Oklahoma City, OK | 3.0 | 1.5 | 1339 | $1,145 | $0.86 | 4d | 1 | 1.01mi |
| 306 E Grumman Dr Oklahoma City, OK | 3.0 | 1.0 | 1219 | $1,300 | $1.07 | 23d | 1 | 1.01mi |
| 6000 E Reno Ave Oklahoma City, OK | 1.0–2.0 | 1.0–2.0 | 692 | $989 | $1.43 | 23d | 1 | 1.01mi |
| 316 E Harmon Dr Oklahoma City, OK | 3.0 | 1.0 | 1212 | $1,395 | $1.15 | 2d | 1 | 1.02mi |
| 444 1/2 Babb Dr Oklahoma City, OK | 2.0 | 1.0 | 920 | $895 | $0.97 | 4d | 1 | 1.05mi |
| 442 Babb Dr Oklahoma City, OK | 2.0 | 2.0 | 920 | $925 | $1.01 | 4d | 1 | 1.05mi |
| 322 E Kerr Dr Oklahoma City, OK | 3.0 | 1.0 | 1086 | $1,200 | $1.10 | 23d | 1 | 1.13mi |
| 407 E Key Blvd Oklahoma City, OK | 4.0 | 2.0 | 1200 | $1,395 | $1.16 | 23d | 1 | 1.14mi |
| 536 E Northrup Dr Oklahoma City, OK | 2.0 | 1.0 | 858 | $889 | $1.04 | 2d | 1 | 1.15mi |
| 4812 Gina Pl Oklahoma City, OK | 3.0 | 1.5 | 1138 | $1,100 | $0.97 | 23d | 1 | 1.17mi |
| 121 Gill Dr Oklahoma City, OK | 3.0 | 1.0 | 950 | $1,150 | $1.21 | 1d | 1 | 1.18mi |
| 421 N Key Blvd Oklahoma City, OK | 2.0 | 1.0 | 780 | $900 | $1.15 | 23d | 1 | 1.20mi |
Listing history 17 events
-
2026-06-18days on market $99,900 Active 23 DOM
-
2026-06-17days on market $99,900 Active 22 DOM
-
2026-06-16days on market $99,900 Active 21 DOM
-
2026-06-15days on market $99,900 Active 20 DOM
-
2026-06-13days on market $99,900 Active 18 DOM
-
2026-06-13days on market $99,900 Active 17 DOM
-
2026-06-09days on market $99,900 Active 14 DOM
-
2026-06-08days on market $99,900 Active 13 DOM
-
2026-06-07days on market $99,900 Active 12 DOM
-
2026-06-05days on market $99,900 Active 9 DOM
-
2026-06-03days on market $99,900 Active 8 DOM
-
2026-06-02days on market $99,900 Active 7 DOM
-
2026-06-01days on market $99,900 Active 6 DOM
-
2026-05-31days on market $99,900 Active 5 DOM
-
2026-05-26$99,900 Active
-
1997-10-06soldstatus $40,000
-
1987-04-08soldstatus $34,000
ⓘ Source: listings_history table (triggers on properties + properties_extension) + one-shot
backfill from property_details.listing_events for pre-trigger history.
Tax reassessment forecast OK · Resets to sale price
- Current annual tax
- $570 · $48/mo
- Projected year-2 tax
- $899 · $75/mo
- Expected delta
- +$329/yr (+$27/mo · 57.7%)
ⓘ Screening estimate from a state-policy table — verify with the county assessor before closing.
Climate risk First Street
- Flood 1/10 Low FEMA zone X (unshaded) · 0% chance over 30 yrs
- Wildfire 1/10 Low
- Heat 6/10 Major 7 d/yr ≥107°F today · 19 d/yr by 30 yrs out
- Wind 2/10 Low 4% chance of damaging wind over 30 yrs
- Air quality 2/10 Low 1 unhealthy d/yr today · 2 by 30 yrs out
Nearby sold comps map
Loading sold comps map…
Walkable amenities ~0.75 mi
Loading nearby amenities…
Taxation est. · year 1
- Rental income
- $15,432
- − Mortgage interest
- −$5,596
- − Property taxes
- −$570
- − Insurance
- −$500
- − Repairs & maintenance
- −$1,235
- − Management
- −$1,235
- − Depreciation
- −$2,906
- Taxable income
- $3,391
- Est. tax owed @ 24.0%
- −$814
- After-tax cash flow
- $4,021/yr
For passive investors: Depreciation is non-cash, so a rental often shows a tax loss while cash-flowing — sheltering income. Rental losses are passive: they offset passive income freely, and up to $25,000/yr can offset ordinary (W-2) income if you actively participate and your MAGI is under $100k (phasing out to $0 by $150k); unused losses carry forward. On sale, claimed depreciation is recaptured at up to 25%, and gains may owe capital-gains tax (a 1031 exchange can defer both). Figures are a year-1 estimate at your 24.0% rate — not tax advice; consult a CPA.
Schools (NCES district)
- District
- Midwest City-Del City
- NCES district ID
- 4019950
- Math proficiency
- 10% ▼ -11.00%
- Reading proficiency
- 17% ▼ -8.00%
- Median HH income
- $45,724
- Composite
- 12.09/100
- National rank
- #9658
- State rank
- #231 of 270 in OK
Livability — Midwest City
- Score
- 71/100
- State rank
- #30
- US rank
- #6637
Category grades
Schools grade is shown separately in the Schools card above.
Census & demographics
- Census place
- Midwest City, OK
- County
- Oklahoma County · 771,644 people
- City population
- 57,386
- Metro
- Oklahoma City, OK
- Population (ZIP)
- 32,348
- Household income
- $51,228
- Rent vs Own
- Severe rent burden
- 1440.0
Population outlook (Oklahoma County) Hauer SSP2
- Today (2025)
- 911,875 people
- By 2030
- 982,413 · +7.7%
- By 2040
- 1,130,468 · +24.0%
- By 2050
- 1,288,422 · +41.3%
- By 2075
- 1,711,482 · +87.7%
- By 2100
- 2,088,448 · +129.0%
Race, ethnicity, and origin ACS 2023
- Neighborhood character
- Diverse neighborhood (Simpson 0.63)
- Race & ethnicity
- White 55% Black 25% Two or more races 11% Hispanic / Latino 7% Native American 4% Asian 1%
- Hispanic origin (detail)
- Mexican 5%
- Common ancestry
- Lithuanian 2% Slovak 1% Serbian 1%
- Foreign-born
- 3% · Canada, Vietnam
- Languages at home
- 95% English-only · Spanish 3%
Political lean MEDSL · Oklahoma
- 2024 margin
- Toss-up / Even · D 48.0% · R 49.7% · Other 2.3%
- 2008→2024 swing
- +15.1pp toward D · 2008: -16.8pp · 2024: -1.7pp
- All cycles
- 2024: R+1.7 2020: R+1.1 2016: R+10.5 2012: R+16.7 2008: R+16.8
Not yet ingested
- Civics
- —
Market trends
- HPI YoY
- ▼ -156.25%
- Current HPI
- 257.0791
- Rent YoY
- ▲ 2.99%
- Metro
- Oklahoma City, OK
- State GDP YoY
- ▲ 1.55%
- F500 in state
- 6
Industry mix (Fortune 500 HQ in OK)
| Industry | F500 HQs | Revenue |
|---|---|---|
| Energy | 3 | $48B |
|
||
Price history
+193.8% since first listed3 events — show timeline
- 2026-05-26 Listed $99,900 FSBO.com
- 1997-10-06 Sold (Public Records) $40,000 Public Records
- 1987-04-08 Sold (Public Records) $34,000 Public Records
Property tax history
+2.5%/yrLatest (2025): $570 · +2.5% YoY. Source: county tax records.
Cash-flow waterfall
monthlySold comps — $/sqft
last 12 mo · ≤1 miLoading sold comps…