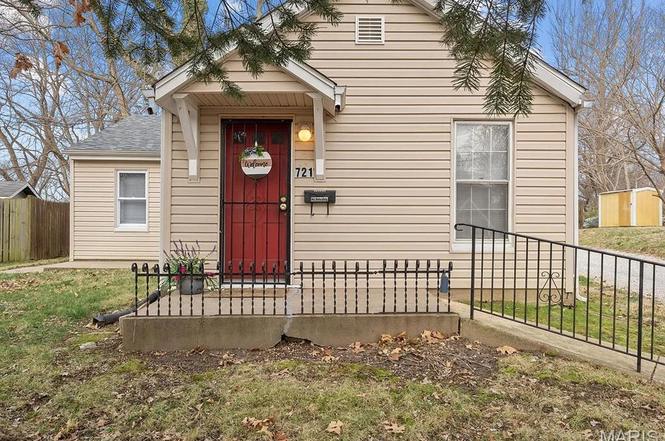
721 N Elizabeth Ave · Ferguson, MO
Flood risk 1/10 · Minimal
- FEMA flood zone
- X (unshaded)
- Chance of flooding over 30 yrs
- 0.0%
- Est. flood insurance / yr
- $473 – $860
Fire risk 1/10 · Minimal
- Est. fire insurance / yr
- $1,054 – $1,958
Heat risk 4/10 · Minor
- Hot days now (above 106°F)
- 7 days/yr
- Hot days in 30 yrs
- 19 days/yr
Wind risk 2/10 · Minimal
- Chance of severe wind over 30 yrs
- 1.0%
Air-quality risk 3/10 · Minor
- Unhealthy air days now
- 3 days/yr
- Unhealthy air days in 30 yrs
- 5 days/yr
Risk factors via First Street. Map © Google.
Why this score? — see what drove the C grade
The composite is a weighted blend of 9 inputs, each scored 0–100. Each bar is that input's sub-score; the figure is the points it added to the 100-point composite (weight × sub-score).
- Cash flow +24.5/30.0
- DSCR +7.9/10.0
- ARV discount +6.3/15.0
- 1% rule +5.8/10.0
- Rent growth +4.8/5.0
- Livability +2.9/5.0
- Condition / age +2.5/5.0
- Schools +1.2/10.0
- Appreciation +0.0/10.0
$119,900
🖨 Deal sheet (PDF) 📄 Offer letter ✓ Due diligence
Listing remarks MLS
Lots of living & storage space inside & out in this clean 2 bedroom, 1.5 bath cottage. Bright kitchen with pantry opens to large extra room allowing for multi-use as extra dining area for crowds, family or play room for the kids, or use a corner for office space. Huge lot provides a lovely park-like setting with shade in the summer or provides room for expansion. The unfinished basement is clean & dry, and it features a half bath; great opportunity to add additional living space and value to the property or to use for loads of storage & workspace. Unwind or entertain on the private, covered back patio, just off the kitchen. Gravel driveway leads to plenty of rear parking space. Need more storage? Two sheds on property plus storage area attached to the home, accessible from the outside. Roof 2 years, HVAC 6 years old will assure peace of mind for buyers. Located close to major employers with nearby public transportation & easy access to Highways 70, 170 and 270.
Key facts
- Solid bones
- Recent updates
- Clean systems
Tags
Property features AI
Finance
- Financial info: Lease not considered
Exterior
- Parking: Has carport with 2 spaces; Has garage
- Utilities: Public water; Public sewer; 220 volt electrical service; Electricity available; Natural gas available
- Home design: Single family residence; One story
- Construction: Concrete construction
- Exterior features: Storage; No fencing
Interior
- Kitchen: Microwave; Electric range; Refrigerator
- Bedrooms: 2 bedrooms (both on the main level)
- Flooring: Hardwood flooring; Laminate flooring
- Bathrooms: 1 full bathroom; 1 half bathroom
- Heating & cooling: Electric heating; Ceiling fans; Electric cooling
- Interior features: Full basement; Storage
Neighborhood map
What this means for you Summary
Snapshot
- This is a 2-bed/1.5-bath single-family listed at $120k.
Deal economics
- At list price, monthly cash flow is $246 ($3k/yr) — positive.
- The deal already cash-flows at list — no discount required.
- Meets the 1% rule at list price ($1k rent vs $120k).
Location & tenants
- Location reads 58/100 on livability (#586 in MO) — a working-class tenant base; expect higher turnover. Strengths: cost of living A+, housing B+; Watch: health & safety C-, crime F, amenities F.
- Ferguson-Florissant R-II (suburban): math 7% / reading 20% proficiency, ranked #311 of 324 in MO (top 96%) — low school quality limits family demand, transient renter base, plan for 1-2y turnover; 70% free/reduced lunch — lower-income household profile, screen leases tightly.
- Zoned schools: Lee Hamilton Elementary (math 5% / reading 16%, grade F, #1,026 of 1,115 statewide, top 92%, 278 students, 99% FRL); Ferguson Middle (math 3% / reading 14%, grade F, #376 of 391 statewide, top 96%, 615 students, 100% FRL); Mccluer High (math 0% / reading 17%, grade F, #511 of 521 statewide, top 98%, 1,181 students, 100% FRL) — zoned schools average 99% FRL vs 70% district-wide (30 pts higher); higher-poverty schools than district average — tighter screening recommended.
- Market conditions: Rents rising fast (+9.0%/yr); 171 active listings in the ZIP; 40 comparable units currently listed for rent nearby; rentals at typical pace (median 26d on market — plan ~3-4 weeks tenant-placement turnaround); 920 units permitted in St. Louis County in 2024 (250 in 5+ unit buildings).
Forward outlook
- Local home prices are declining (-3.0%/yr); year-one equity from $829 of loan paydown is wiped out by about $4k of value loss. Plan a longer hold.
- At projected returns (-3.0% appreciation + 8.0% rent growth), your $34k cash investment doubles in ~8 years — after that, you're playing with house money.
Negotiation context
- Only 4 days on market — expect competitive offers; lowballing is unlikely to land.
- 3 sale attempts since 15y ago with the ask held roughly flat each time — persistent listings suggest the price (not the market) is what's stuck; bring a comps-based counter.
- Current owner paid $93k; 29% above their basis — modest negotiation headroom, anchor on the comps not their cost.
Risks & watch-outs
- Watch-outs: built in 1913 — expect roof / HVAC / electrical / plumbing capex.
Questions for the listing agent
- Built in 1913 — when were the roof, HVAC, electrical panel, plumbing, and water heater last replaced?
- Is there a deadline driving the sale (1031 exchange, divorce, estate, relocation)? That informs how much negotiation room exists.
- Schools are F-rated, which usually means shorter tenancies and higher turnover. Who's the typical renter profile here, and what's been the actual vacancy rate?
- Crime grade is F in this area — have there been break-ins, vandalism, or insurance claims at this property in the last 3 years? What carrier currently insures it and at what premium?
- What's the average days-on-market for RENTAL listings here right now (not sales)? A rising rental-DOM trend means longer vacancies and softer asking-rent achievability than the comps imply.
- What's the recent tenant-quality profile in this submarket — average credit score on applications, eviction rate, late-payment / NSF rate, and stable-employment percentage? A property-management company in the area should have these aggregated.
- How much new for-sale + rental construction is in the pipeline within 1–3 miles? Heavy new supply typically softens prices + rents 12–24 months out; constrained supply supports both.
Investment metrics
- 1% rule
- 1.08% ✓
- Cap rate
- 8.76%
- Cash-on-cash
- 8.80%
- DSCR
- 1.39
- GRM
- 7.7
CMA / ARV
- ARV (on-the-fly)
- $116,816
- Comps found
- 12
Show comp detail 12 sales within ~0.75 mi
| Address | Dist | Beds/Ba | Sqft | Sold | Price | $/sf | Match |
|---|---|---|---|---|---|---|---|
| 418 Millman Dr | 0.23mi | 2/1.0 | 1,027 (-2%) | 6mo | $68,600 | $67 | 79 |
| 435 N Clay Ave | 0.21mi | 2/1.5 | 972 (-7%) | 3mo | $155,000 | $159 | 76 |
| 7 Bromley Dr | 0.34mi | 3/2.0 (+1) | 1,060 (+2%) | 2mo | $192,500 | $182 | 73 |
| 315 Coppinger Dr | 0.42mi | 2/1.0 | 1,034 (-1%) | 5mo | $84,900 | $82 | 73 |
| 613 Plantmore Dr | 0.28mi | 3/1.0 (+1) | 1,008 (-3%) | 4mo | $119,900 | $119 | 71 |
| 601 Chanslor | 0.44mi | 2/1.0 | 1,008 (-3%) | 7mo | $39,900 | $40 | 66 |
| 702 Palace Ct | 0.20mi | 3/1.0 (+1) | 1,144 (+10%) | 8mo | $114,900 | $100 | 61 |
| 405 Teston Dr | 0.22mi | 2/1.0 | 888 (-15%) | 7mo | $125,000 | $141 | 57 |
| 404 Ballman Ave | 0.29mi | 2/1.0 | 892 (-14%) | 4mo | $99,900 | $112 | 56 |
| 610 Superior Dr | 0.25mi | 3/1.0 (+1) | 900 (-14%) | 3mo | $139,000 | $154 | 56 |
| 818 Robert Ave | 0.40mi | 3/1.0 (+1) | 1,137 (+9%) | 5mo | $120,000 | $106 | 55 |
| 315 Royal Ave | 0.30mi | 3/1.0 (+1) | 1,176 (+13%) | 3mo | $95,000 | $81 | 55 |
Match score weights: distance 35% · size 25% · config 20% · recency 20%. Top-matched comps best support the ARV.
Projected returns pro-forma
-3.0% appreciation · 8.0% rent growth · sell at horizon
- IRR
- 2.3%
- Equity multiple
- 1.09×
- Total profit
- $3,085
- Equity at exit
- $17,877
- IRR
- 16.1%
- Equity multiple
- 2.61×
- Total profit
- $53,989
- Equity at exit
- $10,367
Cash invested: $33,572 (down + closing). Projections, not guarantees.
Landlord ↔ Tenant lean methodology
- Overall (STATE)
- 81 Strongly Landlord-Friendly
- State Missouri
- 81 Strongly Landlord-Friendly · R+10
- County
- — inherits STATE
- City
- — inherits STATE
ZIP-level market 63135
- Rents YoY
- 9.0%
- Active inventory
- 171
- Price-to-rent
- 7.7×
Monthly cashflow live
- Estimated rent
- $1,296 high interval (Pro) →
- Mortgage (P&I)
- −$629
- Tax from tax record
- −$99 /mo · $1,182/yr
- Insurance
- −$50
- HOA
- −$0
- Lot rent
- −$0
- Vacancy / Maint / Mgmt
- −$272
- Net cashflow
- $246
Break-even live
Sensitivity live
| Price | -10% $314 | -5% $280 | +0% $246 | +5% $212 | +10% $178 |
|---|---|---|---|---|---|
| Rent | -10% $144 | -5% $195 | +0% $246 | +5% $297 | +10% $349 |
| Rate | -1.0pp $307 | -0.5pp $277 | base $246 | +0.5pp $215 | +1.0pp $184 |
UW: 25.0% down · 7.5% · 30yr · 1.5% tax · 5.0% vac · 8.0% maint · 8.0% mgmt
Financing live
Cash to close
- Down payment
- $29,975
- Closing costs
- $3,597
- Reserves months
- —
- Total cash needed
- —
Loan-product check · same deal, 3 products live
Conventional
25% down · 7.5% · 30yr
- Down + closing
- —
- Monthly P&I
- —
- Monthly cashflow
- —
- DSCR
- —
- Eligible?
- —
Personal DTI + credit; lowest rate.
DSCR
20% down · 8.5% · 30yr
- Down + closing
- —
- Monthly P&I
- —
- Monthly cashflow
- —
- DSCR
- —
- Eligible?
- —
No personal income docs; deal must DSCR.
Hard money
10% down · 12.0% · 12mo
- Down + closing
- —
- Monthly P&I
- —
- Monthly cashflow
- —
- DSCR
- —
- Eligible?
- —
Short-term bridge; refi at stabilization.
Rent comps 40 comps
| Address | Beds | Baths | Sqft | Rent | $/sqft | DOM | Units | Dist |
|---|---|---|---|---|---|---|---|---|
| 401 Millman Dr Saint Louis, MO | 3.0 | 1.0 | 1008 | $1,450 | $1.44 | 18d | 1 | 0.28mi |
| 650 Robert Ave Ferguson, MO | 3.0 | 1.0 | 816 | $1,224 | $1.50 | 46d | 1 | 0.28mi |
| 415 Ames Pl Saint Louis, MO | 3.0 | 1.0 | 816 | $1,400 | $1.72 | 46d | 1 | 0.35mi |
| 920 Hutton Pl Saint Louis, MO | 3.0 | 1.0 | 912 | $1,195 | $1.31 | 46d | 1 | 0.45mi |
| 307 Coppinger Dr Saint Louis, MO | 3.0 | 1.0 | 960 | $1,095 | $1.14 | 20d | 1 | 0.46mi |
| 338 La Motte Ln Saint Louis, MO | 2.0 | 1.0 | 904 | $1,150 | $1.27 | 46d | 1 | 0.48mi |
| 338 La Motte Ln Saint Louis, MO | 2.0 | 1.0 | 904 | $1,150 | $1.27 | 1d | 1 | 0.48mi |
| 502 Averill Ave Saint Louis, MO | 2.0 | 1.0 | 840 | $1,250 | $1.49 | 46d | 1 | 0.52mi |
| 13 N Hartnett Ave Saint Louis, MO | 3.0 | 1.0 | 1140 | $1,400 | $1.23 | 13d | 1 | 0.65mi |
| 35 S Barat Ave Saint Louis, MO | 2.0 | 1.0 | 984 | $1,150 | $1.17 | 1d | 1 | 0.74mi |
| 324 Emmett Ave Saint Louis, MO | 3.0 | 2.0 | 1357 | $1,650 | $1.22 | 26d | 1 | 0.84mi |
| 541 Hentschel Pl Saint Louis, MO | 2.0 | 1.0 | 1305 | $1,500 | $1.15 | 7d | 1 | 0.90mi |
| 104 Fenwick Dr Saint Louis, MO | 3.0 | 1.0 | 960 | $1,250 | $1.30 | 26d | 1 | 0.94mi |
| 24 Vierling Dr Saint Louis, MO | 2.0 | 1.0 | 850 | $1,290 | $1.52 | 10d | 1 | 0.96mi |
| 227 Meadowcrest Dr Saint Louis, MO | 3.0 | 1.0 | 960 | $1,500 | $1.56 | 46d | 1 | 0.98mi |
| 601 Carson Rd Saint Louis, MO | 2.0 | 1.0 | 743 | $950 | $1.28 | 26d | 1 | 1.01mi |
| 222 Henquin Dr Saint Louis, MO | 2.0 | 1.0 | 816 | $1,050 | $1.29 | 1d | 1 | 1.02mi |
| 222 Henquin Dr Saint Louis, MO | 2.0 | 1.0 | 816 | $1,050 | $1.29 | 20d | 1 | 1.02mi |
| 249 S Hartnett Ave Saint Louis, MO | 3.0 | 1.0 | 960 | $1,220 | $1.27 | 26d | 1 | 1.02mi |
| 945 Edgehill Dr Saint Louis, MO | 3.0 | 1.0 | 1110 | $1,575 | $1.42 | 46d | 1 | 1.03mi |
| 338 Saint Louis Ave Saint Louis, MO | 3.0 | 1.0 | 1200 | $1,200 | $1.00 | 46d | 1 | 1.05mi |
| 6625 Thurston Ave Saint Louis, MO | 2.0 | 1.0 | 939 | $1,300 | $1.38 | 46d | 1 | 1.09mi |
| 6625 Thurston Ave Saint Louis, MO | 2.0 | 1.0 | 939 | $1,400 | $1.49 | 26d | 1 | 1.09mi |
| 60 Mayme Dr Saint Louis, MO | 3.0 | 1.0 | 960 | $1,225 | $1.28 | 1d | 1 | 1.12mi |
| 3582 Pershall Rd Unit 3631 Ferguson, MO | 2.0 | 2.0 | 1500 | $1,295 | $0.86 | 46d | 1 | 1.13mi |
| 6156 Wulff Dr Saint Louis, MO | 3.0 | 2.0 | 960 | $1,395 | $1.45 | 1d | 1 | 1.13mi |
| 110 Paul Ave Saint Louis, MO | 3.0 | 1.0 | 875 | $1,025 | $1.17 | 1d | 1 | 1.14mi |
| 419 S Florissant Rd Ferguson, MO | 2.0 | 1.0 | 1100 | $1,200 | $1.09 | 46d | 1 | 1.14mi |
| 3585 Pershall Rd Ferguson, MO | 2.0 | 2.0 | 1388 | $1,400 | $1.01 | 46d | 1 | 1.14mi |
| 296 Meadowcrest Dr Saint Louis, MO | 3.0 | 1.0 | 960 | $1,550 | $1.61 | 17d | 1 | 1.15mi |
| 46 Bascom Dr Saint Louis, MO | 2.0 | 1.0 | 932 | $1,175 | $1.26 | 46d | 1 | 1.16mi |
| 910 Disco Dr Saint Louis, MO | 3.0 | 1.0 | 924 | $1,235 | $1.34 | 1d | 1 | 1.17mi |
| 246 Louisa Ave Saint Louis, MO | 3.0 | 1.0 | 1036 | $1,600 | $1.54 | 46d | 1 | 1.18mi |
| 6867 Thurston Ave Saint Louis, MO | 3.0 | 2.0 | 1243 | $1,580 | $1.27 | 46d | 1 | 1.18mi |
| 224 S Harvey Ave Saint Louis, MO | 2.0 | 1.0 | 936 | $995 | $1.06 | 1d | 1 | 1.19mi |
| 222 Randolph Ave Saint Louis, MO | 2.0 | 1.0 | 964 | $1,400 | $1.45 | 10d | 1 | 1.20mi |
| 153 Bascom Dr Saint Louis, MO | 3.0 | 1.0 | 1076 | $1,195 | $1.11 | 22d | 1 | 1.22mi |
| 10329 Chesley Dr Saint Louis, MO | 3.0 | 1.0 | 1014 | $1,350 | $1.33 | 26d | 1 | 1.22mi |
| 12 Lee Ave Saint Louis, MO | 2.0 | 1.0 | 832 | $1,080 | $1.30 | 1d | 1 | 1.23mi |
| 12 Lee Ave Saint Louis, MO | 2.0 | 1.0 | 832 | $1,080 | $1.30 | 10d | 1 | 1.23mi |
Listing history 4 events
-
2026-06-22days on market $119,900 Active 4 DOM
-
2026-06-21days on market $119,900 Active 3 DOM
-
2026-06-19remarks 444-char remark
-
2026-06-19$119,900 Active 1 DOM
ⓘ Source: listings_history table (triggers on properties + properties_extension) + one-shot
backfill from property_details.listing_events for pre-trigger history.
Tax reassessment forecast MO · Resets to sale price
- Current annual tax
- $1,182 · $99/mo
- Projected year-2 tax
- $1,182 · $99/mo
- Expected delta
- $0/yr ($0/mo · 0.0%)
ⓘ Screening estimate from a state-policy table — verify with the county assessor before closing.
Climate risk First Street
- Flood 1/10 Low FEMA zone X (unshaded) · 0% chance over 30 yrs
- Wildfire 1/10 Low
- Heat 4/10 Moderate 7 d/yr ≥106°F today · 19 d/yr by 30 yrs out
- Wind 2/10 Low 100% chance of damaging wind over 30 yrs
- Air quality 3/10 Moderate 3 unhealthy d/yr today · 5 by 30 yrs out
Nearby sold comps map
Loading sold comps map…
Walkable amenities ~0.75 mi
Loading nearby amenities…
Taxation est. · year 1
- Rental income
- $15,546
- − Mortgage interest
- −$6,716
- − Property taxes
- −$1,182
- − Insurance
- −$600
- − Repairs & maintenance
- −$1,244
- − Management
- −$1,244
- − Depreciation
- −$3,488
- Taxable income
- $1,073
- Est. tax owed @ 24.0%
- −$257
- After-tax cash flow
- $2,697/yr
For passive investors: Depreciation is non-cash, so a rental often shows a tax loss while cash-flowing — sheltering income. Rental losses are passive: they offset passive income freely, and up to $25,000/yr can offset ordinary (W-2) income if you actively participate and your MAGI is under $100k (phasing out to $0 by $150k); unused losses carry forward. On sale, claimed depreciation is recaptured at up to 25%, and gains may owe capital-gains tax (a 1031 exchange can defer both). Figures are a year-1 estimate at your 24.0% rate — not tax advice; consult a CPA.
Schools (NCES district)
- District
- Ferguson-Florissant R-II
- NCES district ID
- 2912010
- Math proficiency
- 7% ▼ -9.00%
- Reading proficiency
- 20% ▼ -6.00%
- Median HH income
- $44,610
- Composite
- 11.96/100
- National rank
- #9666
- State rank
- #311 of 324 in MO
Livability — Ferguson
- Score
- 58/100
- State rank
- #586
- US rank
- #20809
Category grades
Schools grade is shown separately in the Schools card above.
Census & demographics
- Census place
- Ferguson, MO
- County
- Saint Louis County · 888,823 people
- City population
- 18,381
- Metro
- St. Louis, MO-IL
- Population (ZIP)
- 18,381
- Household income
- $52,328
- Rent vs Own
- Severe rent burden
- 957.0
Population outlook (St. Louis County) Hauer SSP2
- Today (2025)
- 1,025,227 people
- By 2030
- 1,028,023 · +0.3%
- By 2040
- 1,020,940 · -0.4%
- By 2050
- 1,007,280 · -1.8%
- By 2075
- 987,277 · -3.7%
- By 2100
- 921,984 · -10.1%
Race, ethnicity, and origin ACS 2023
- Neighborhood character
- Predominantly Black (66%)
- Race & ethnicity
- Black 66% White 28% Two or more races 3% Hispanic / Latino 2%
- Common ancestry
- Lithuanian 1% Iranian 1% Romanian 1%
- Foreign-born
- 1% · Canada
- Languages at home
- 95% English-only · Spanish 4%
Political lean MEDSL · St. Louis
- 2024 margin
- Strong D (+23.4) · D 60.8% · R 37.4% · Other 1.7%
- 2008→2024 swing
- +3.5pp toward D · 2008: 19.9pp · 2024: 23.4pp
- All cycles
- 2024: D+23.4 2020: D+24.0 2016: D+16.2 2012: D+13.7 2008: D+19.9
Not yet ingested
- Civics
- —
Market trends
- HPI YoY
- ▼ -152.56%
- Current HPI
- 138.6781
- Rent YoY
- ▲ 9.03%
- Metro
- St. Louis, MO-IL
- State GDP YoY
- ▲ 1.84%
- F500 in state
- 20
Industry mix (Fortune 500 HQ in MO)
| Industry | F500 HQs | Revenue |
|---|---|---|
| Healthcare | 1 | $163B |
|
||
| Insurance | 1 | $21B |
|
||
| Industrial Technology | 1 | $17B |
|
||
| Retail | 1 | $16B |
|
||
| Industrial Distribution | 1 | $10B |
|
||
| Utilities | 1 | $9B |
|
||
Price history
+531.1% since first listed13 events — show timeline
- 2026-06-18 Listed $119,900 MARIS as Distributed by MLS Grid
- 2022-05-09 Sold (Public Records) $93,100 Public Records
- 2022-05-02 Sold (MLS) — MARIS as Distributed by MLS Grid
- 2022-04-01 Pending — MARIS as Distributed by MLS Grid
- 2022-03-31 Listed $85,000 MARIS as Distributed by MLS Grid
- 2022-03-14 Coming Soon $85,000 MARIS as Distributed by MLS Grid
- 2018-06-04 Price Changed $56,900 MARIS as Distributed by MLS Grid
- 2012-01-17 Sold (Public Records) $21,500 Public Records
- 2012-01-13 Sold (MLS) — MARIS as Distributed by MLS Grid
- 2011-11-14 Listed $27,900 MARIS as Distributed by MLS Grid
- 2005-08-30 Sold (Public Records) $19,000 Public Records
- 2005-08-30 Sold (Public Records) — Public Records
- 1969-12-18 Sold (Public Records) — Public Records
Property tax history
+0.2%/yrLatest (2022): $1,182 · +3.3% YoY. Source: county tax records.
Cash-flow waterfall
monthlySold comps — $/sqft
last 12 mo · ≤1 miLoading sold comps…