 Duplex
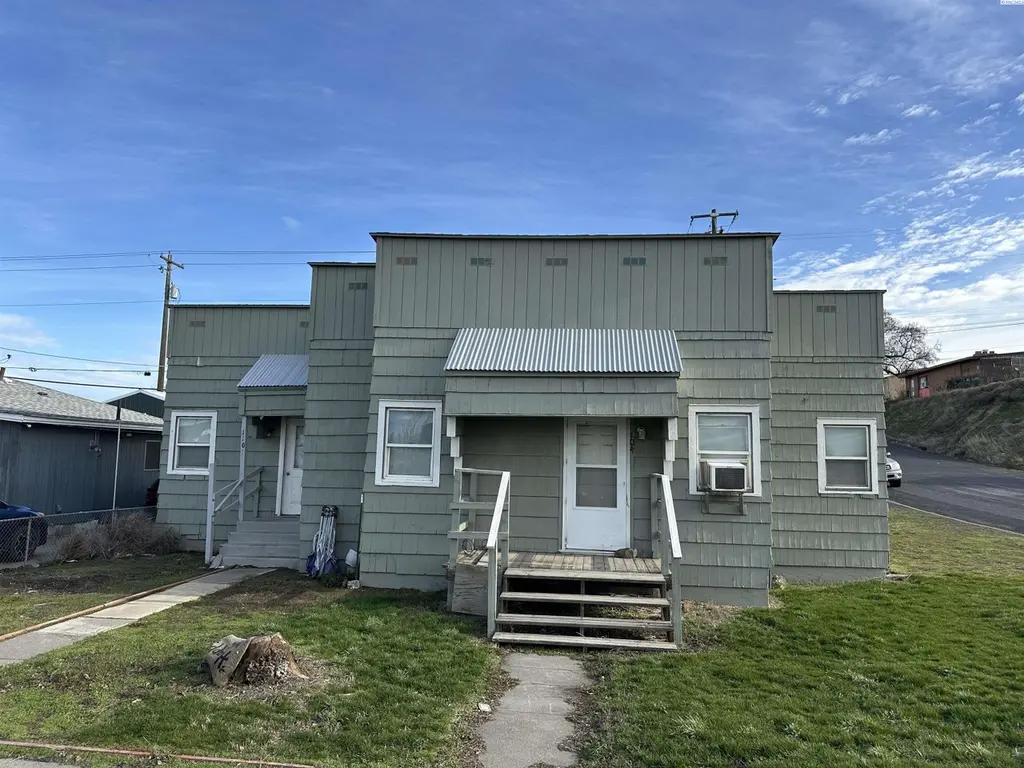
104 N Almira Ave · Connell, WA
Flood risk 8/10 · Major
- FEMA flood zone
- X
- Chance of flooding over 30 yrs
- 0.78%
- Est. flood insurance / yr
- $507 – $1,088
Fire risk 4/10 · Minor
- Est. fire insurance / yr
- $604 – $1,122
Heat risk 4/10 · Minor
- Hot days now (above 98°F)
- 7 days/yr
- Hot days in 30 yrs
- 15 days/yr
Wind risk 1/10 · Minimal
- Chance of severe wind over 30 yrs
- —
Air-quality risk 8/10 · Major
- Unhealthy air days now
- 12 days/yr
- Unhealthy air days in 30 yrs
- 14 days/yr
Risk factors via First Street. Map © Google.
Why this score? — see what drove the B- grade
The composite is a weighted blend of 9 inputs, each scored 0–100. Each bar is that input's sub-score; the figure is the points it added to the 100-point composite (weight × sub-score).
- Cash flow +29.2/30.0
- DSCR +10.0/10.0
- ARV discount +7.5/15.0
- 1% rule +7.4/10.0
- Schools +3.5/10.0
- Livability +3.5/5.0
- Rent growth +2.5/5.0
- Condition / age +2.5/5.0
- Appreciation +0.0/10.0
$175,000
🖨 Deal sheet 📄 Offer letter ✓ Due diligence
Multi-family units
County records classify this as Multi-Family (2-4 Unit). Listing-text estimate: 2 units. confirmed
Listing remarks MLS
MLS# 289835 Excellent investment opportunity in the heart of Connell. This well-located duplex offers immediate income potential and strong flexibility for investors and/or affordable housing for anyone looking to purchase a home. The property features a spacious 3-bedroom unit and a 2-bedroom unit, each with one bathroom. Both units are currently fully rented on a month-to-month basis, providing immediate cash flow with future repositioning options. One unit has been updated, adding value and appeal. Additional highlights include a fenced backyard and a central location close to local amenities. Priced competitively, this is a solid opportunity for investors seeking income with upside.
Key facts
- Central location
- Fenced backyard
- Fully renovated unit
Tags
Neighborhood map
What this means for you Summary
Snapshot
- This is a 2 × 2-bed/1.0-bath units multifamily listed at $175k.
Deal economics
- At list price, monthly cash flow is $542 ($7k/yr) — positive. Per door: $271/mo.
- The deal already cash-flows at list — no discount required.
- Meets the 1% rule at list price ($2k rent vs $175k).
- Recommended offer: $154k (12.0% below list) — sets the bar for market timing.
Location & tenants
- Location reads 70/100 on livability (#250 in WA) — a middle-class / working-renter tenant base. Strengths: crime A+, housing A+, employment A; Watch: schools F, amenities F, commute F.
- North Franklin School District (rural): math 32% / reading 42% proficiency, ranked #235 of 291 in WA (top 81%) — families likely to look elsewhere, expect single-tenant / working-renter base with shorter leases; 68% free/reduced lunch — lower-income household profile, screen leases tightly.
- Market conditions: 41 active listings in the ZIP; 981 units permitted in Franklin County in 2024 (517 in 5+ unit buildings).
Forward outlook
- Local home prices are declining (-3.0%/yr); year-one equity from $1k of loan paydown is wiped out by about $5k of value loss. Plan a longer hold.
- Franklin County population projected at +50% by 2050 — long-run rental-demand tailwind backs the buy-and-hold thesis.
- At projected returns (-3.0% appreciation + 3.0% rent growth), your $49k cash investment doubles in ~9 years — after that, you're playing with house money.
Negotiation context
- It's been on market 148 days — a 12% lower offer ($154k) is reasonable based on typical stale-listing flexibility.
- 2 sale attempts with the ask held roughly flat each time — persistent listings suggest the price (not the market) is what's stuck; bring a comps-based counter.
Risks & watch-outs
- Watch-outs: flood insurance adds $66/mo; built in 1940 — expect roof / HVAC / electrical / plumbing capex.
- Climate carrying-cost: severe flood risk — expect insurance premiums to compound above CPI over the hold.
Questions for the listing agent
- It's been on market 148 days. Have you received any prior offers? Is the seller open to a 12% concession, seller financing, or rate buy-down credit?
- Can we see the unit-by-unit rent roll, current vacancy, and any below-market leases? What's the average tenancy length?
- What capital expenditures (roof, boiler, parking lot, exteriors) have been made in the last 5 years, and what's planned in the next 2?
- Built in 1940 — when were the roof, HVAC, electrical panel, plumbing, and water heater last replaced?
- What's the actual annual flood-insurance premium (NFIP or private), and is the property in a SFHA with mandatory coverage?
- Why hasn't it sold? Are there any deal-killer items the seller is aware of (foundation, flood, title, zoning, code violations)?
- Is there a deadline driving the sale (1031 exchange, divorce, estate, relocation)? That informs how much negotiation room exists.
- Schools are F-rated, which usually means shorter tenancies and higher turnover. Who's the typical renter profile here, and what's been the actual vacancy rate?
- What's the average days-on-market for RENTAL listings here right now (not sales)? A rising rental-DOM trend means longer vacancies and softer asking-rent achievability than the comps imply.
- What's the recent tenant-quality profile in this submarket — average credit score on applications, eviction rate, late-payment / NSF rate, and stable-employment percentage? A property-management company in the area should have these aggregated.
- How much new apartment / multifamily construction is in the pipeline within 1–3 miles? Heavy new supply (>2% of stock underway) typically softens rents 12–24 months out; light construction supports rent growth.
Investment metrics
- 1% rule
- 1.24% ✓
- Cap rate
- 10.47%
- Cash-on-cash
- 14.90%
- DSCR
- 1.66
- GRM
- 6.7
CMA / ARV
No comps found within radius.
Projected returns pro-forma
-3.0% appreciation · 3.0% rent growth · sell at horizon
- IRR
- 3.3%
- Equity multiple
- 1.13×
- Total profit
- $6,179
- Equity at exit
- $26,093
- IRR
- 12.8%
- Equity multiple
- 2.02×
- Total profit
- $49,868
- Equity at exit
- $15,131
Cash invested: $49,000 (down + closing). Projections, not guarantees.
Landlord ↔ Tenant lean methodology
- Overall (STATE)
- 28 Tenant-Leaning
- State Washington
- 28 Tenant-Leaning · D+8
- County
- — inherits STATE
- City
- — inherits STATE
ZIP-level market 99326
- Home prices YoY
- -5.1%
- Active inventory
- 41
- Price-to-rent
- 13.5×
Monthly cashflow live
- Estimated rent
- $2,162 medium interval (Pro) →
- Mortgage (P&I)
- −$918
- Tax from tax record
- −$109 /mo · $1,305/yr
- Insurance
- −$73
- Flood insurance flood zone
- −$66 /mo · $798/yr
- HOA
- −$0
- Vacancy / Maint / Mgmt
- −$454
- Net cashflow
- $542
Break-even live
2-unit breakdown (identical units grouped — click to expand)
| Units | Beds | Baths | Est. rent |
|---|---|---|---|
| 2× units | 2 | 1 | $2,162 |
| #1 | 2 | 1 | $1,081 |
| #2 | 2 | 1 | $1,081 |
| Total (2 units) | $2,162 | ||
UW: 25.0% down · 7.5% · 30yr · 1.5% tax · 5.0% vac · 8.0% maint · 8.0% mgmt
Financing live
Cash to close
- Down payment
- $43,750
- Closing costs
- $5,250
- Reserves months
- —
- Total cash needed
- —
Loan-product check · same deal, 3 products live
Conventional
25% down · 7.5% · 30yr
- Down + closing
- —
- Monthly P&I
- —
- Monthly cashflow
- —
- DSCR
- —
- Eligible?
- —
Personal DTI + credit; lowest rate.
DSCR
20% down · 8.5% · 30yr
- Down + closing
- —
- Monthly P&I
- —
- Monthly cashflow
- —
- DSCR
- —
- Eligible?
- —
No personal income docs; deal must DSCR.
Hard money
10% down · 12.0% · 12mo
- Down + closing
- —
- Monthly P&I
- —
- Monthly cashflow
- —
- DSCR
- —
- Eligible?
- —
Short-term bridge; refi at stabilization.
Listing history 19 events
-
2026-06-18days on market $175,000 Active 148 DOM
-
2026-06-17days on market $175,000 Active 147 DOM
-
2026-06-16days on market $175,000 Active 146 DOM
-
2026-06-15days on market $175,000 Active 145 DOM
-
2026-06-14days on market $175,000 Active 143 DOM
-
2026-06-13days on market $175,000 Active 142 DOM
-
2026-06-10days on market $175,000 Active 140 DOM
-
2026-06-09days on market $175,000 Active 139 DOM
-
2026-06-08days on market $175,000 Active 138 DOM
-
2026-06-07days on market $175,000 Active 137 DOM
-
2026-06-05days on market $175,000 Active 134 DOM
-
2026-06-03days on market $175,000 Active 133 DOM
-
2026-06-02days on market $175,000 Active 132 DOM
-
2026-06-01days on market $175,000 Active 131 DOM
-
2026-05-31days on market $175,000 Active 130 DOM
-
2026-05-30days on market $175,000 Active 129 DOM
-
2026-04-28status Active 695-char remark
Show marketing remark (695 chars)
MLS# 289835 Excellent investment opportunity in the heart of Connell. This well-located duplex offers immediate income potential and strong flexibility for investors and/or affordable housing for anyone looking to purchase a home. The property features a spacious 3-bedroom unit and a 2-bedroom unit, each with one bathroom. Both units are currently fully rented on a month-to-month basis, providing immediate cash flow with future repositioning options. One unit has been updated, adding value and appeal. Additional highlights include a fenced backyard and a central location close to local amenities. Priced competitively, this is a solid opportunity for investors seeking income with upside.
-
2026-04-22status Pending 695-char remark
Show marketing remark (695 chars)
MLS# 289835 Excellent investment opportunity in the heart of Connell. This well-located duplex offers immediate income potential and strong flexibility for investors and/or affordable housing for anyone looking to purchase a home. The property features a spacious 3-bedroom unit and a 2-bedroom unit, each with one bathroom. Both units are currently fully rented on a month-to-month basis, providing immediate cash flow with future repositioning options. One unit has been updated, adding value and appeal. Additional highlights include a fenced backyard and a central location close to local amenities. Priced competitively, this is a solid opportunity for investors seeking income with upside.
-
2026-01-15$175,000 Active 695-char remark
Show marketing remark (695 chars)
MLS# 289835 Excellent investment opportunity in the heart of Connell. This well-located duplex offers immediate income potential and strong flexibility for investors and/or affordable housing for anyone looking to purchase a home. The property features a spacious 3-bedroom unit and a 2-bedroom unit, each with one bathroom. Both units are currently fully rented on a month-to-month basis, providing immediate cash flow with future repositioning options. One unit has been updated, adding value and appeal. Additional highlights include a fenced backyard and a central location close to local amenities. Priced competitively, this is a solid opportunity for investors seeking income with upside.
ⓘ Source: listings_history table (triggers on properties + properties_extension) + one-shot
backfill from property_details.listing_events for pre-trigger history.
Tax reassessment forecast WA · Resets to sale price
- Current annual tax
- $1,305 · $109/mo
- Projected year-2 tax
- $1,715 · $143/mo
- Expected delta
- +$410/yr (+$34/mo · 31.4%)
ⓘ Screening estimate from a state-policy table — verify with the county assessor before closing.
Climate risk First Street
- Flood 8/10 Severe FEMA zone X · 78% chance over 30 yrs
- Wildfire 4/10 Moderate
- Heat 4/10 Moderate 7 d/yr ≥98°F today · 15 d/yr by 30 yrs out
- Wind 1/10 Low
- Air quality 8/10 Severe 12 unhealthy d/yr today · 14 by 30 yrs out
Nearby sold comps map
Loading sold comps map…
Walkable amenities ~0.75 mi
Loading nearby amenities…
Taxation est. · year 1
- Rental income
- $25,944
- − Mortgage interest
- −$9,803
- − Property taxes
- −$1,305
- − Insurance
- −$1,672
- − Repairs & maintenance
- −$2,076
- − Management
- −$2,076
- − Depreciation
- −$5,091
- Taxable income
- $3,922
- Est. tax owed @ 24.0%
- −$941
- After-tax cash flow
- $5,565/yr
For passive investors: Depreciation is non-cash, so a rental often shows a tax loss while cash-flowing — sheltering income. Rental losses are passive: they offset passive income freely, and up to $25,000/yr can offset ordinary (W-2) income if you actively participate and your MAGI is under $100k (phasing out to $0 by $150k); unused losses carry forward. On sale, claimed depreciation is recaptured at up to 25%, and gains may owe capital-gains tax (a 1031 exchange can defer both). Figures are a year-1 estimate at your 24.0% rate — not tax advice; consult a CPA.
Schools (NCES district)
- District
- North Franklin School District
- NCES district ID
- 5305730
- Math proficiency
- 32% ▼ -2.00%
- Reading proficiency
- 42% ▲ 1.00%
- Median HH income
- $51,090
- Composite
- 34.64/100
- National rank
- #10073
- State rank
- #235 of 291 in WA
Livability — Connell
- Score
- 70/100
- State rank
- #250
- US rank
- #8022
Category grades
Schools grade is shown separately in the Schools card above.
Census & demographics
- Census place
- Connell, WA
- Population (ZIP)
- 5,875
Population outlook (Franklin County) Hauer SSP2
- Today (2025)
- 108,530 people
- By 2030
- 118,705 · +9.4%
- By 2040
- 140,053 · +29.0%
- By 2050
- 162,360 · +49.6%
- By 2075
- 217,667 · +100.6%
- By 2100
- 264,533 · +143.7%
Race, ethnicity, and origin ACS 2023
- Neighborhood character
- Diverse neighborhood (Simpson 0.59)
- Race & ethnicity
- White 48% Hispanic / Latino 42% Two or more races 10% Black 4% Asian 2%
- Hispanic origin (detail)
- Mexican 39%
- Common ancestry
- Lithuanian 4% Portuguese 2% Romanian 1%
- Foreign-born
- 19% · Canada, Vietnam
- Languages at home
- 66% English-only · Spanish 32% Other Asian/Pacific 1%
Political lean MEDSL · Franklin
- 2024 margin
- Strong R (+22.7) · D 37.4% · R 60.1% · Other 2.4%
- 2008→2024 swing
- +1.0pp toward D · 2008: -23.7pp · 2024: -22.7pp
- All cycles
- 2024: R+22.7 2020: R+14.5 2016: R+17.1 2012: R+25.2 2008: R+23.7
Not yet ingested
- Civics
- —
Market trends
- HPI YoY
- ▼ -16.03%
- Current HPI
- 297.9832
- Rent YoY
- —
- Metro
- —
- State GDP YoY
- ▲ 4.65%
- F500 in state
- 22
Industry mix (Fortune 500 HQ in WA)
| Industry | F500 HQs | Revenue |
|---|---|---|
| Retail | 2 | $269B |
|
||
| Technology / Retail | 1 | $638B |
|
||
| Technology | 1 | $245B |
|
||
| Telecommunications | 1 | $38B |
|
||
| Food / Beverage | 1 | $36B |
|
||
| Automotive / Trucks | 1 | $34B |
|
||
Price history
3 events — show timeline
- 2026-04-28 Relisted — PACMLS
- 2026-04-22 Pending — PACMLS
- 2026-01-15 Listed $175,000 PACMLS
Property tax history
+4.8%/yrLatest (2026): $1,305 · +33.8% YoY. Source: county tax records.
Cash-flow waterfall
monthlySold comps — $/sqft
last 12 mo · ≤1 miLoading sold comps…