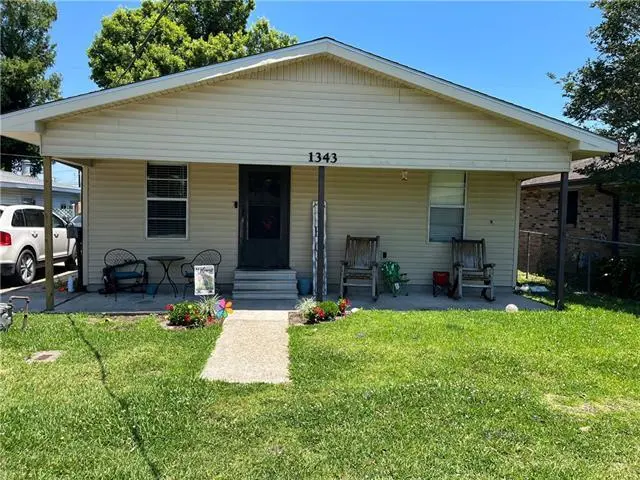
1343 Central Ave · Westwego, LA
Flood risk No data
- FEMA flood zone
- —
- Chance of flooding over 30 yrs
- —
- Est. flood insurance / yr
- —
Fire risk No data
- Est. fire insurance / yr
- —
Heat risk No data
- Hot days now (above threshold)
- —
- Hot days in 30 yrs
- —
Wind risk No data
- Chance of severe wind over 30 yrs
- —
Air-quality risk No data
- Unhealthy air days now
- —
- Unhealthy air days in 30 yrs
- —
Risk factors via First Street. Map © Google.
Why this score? — see what drove the C+ grade
The composite is a weighted blend of 9 inputs, each scored 0–100. Each bar is that input's sub-score; the figure is the points it added to the 100-point composite (weight × sub-score).
- Cash flow +24.2/30.0
- ARV discount +15.0/15.0
- DSCR +7.8/10.0
- 1% rule +5.0/10.0
- Livability +3.4/5.0
- Schools +2.5/10.0
- Condition / age +2.5/5.0
- Rent growth +2.3/5.0
- Appreciation +0.0/10.0
$175,000
🖨 Deal sheet 📄 Offer letter ✓ Due diligence
Listing remarks MLS
This open floorplan 3/2 in the heart of Westwego is ready for your special touch to make this house your home. The large, open living room has vaulted ceilings. Formal dining in between kitchen and living room can also be used as a den or sitting area. The kitchen has windows overlooking the backyard. The large backyard has a metal workshop and two citrus trees. Flood zone X!
Key facts
- Formal dining
- Open floorplan
- Large backyard
Tags
Property features AI
Exterior
- Parking: Driveway
- Utilities: Public water; Public sewer
- Home design: Single-story home; Average condition; Raised foundation
- Construction: Vinyl siding; Shingle roof
- Exterior features: Covered patio/porch; Shed(s); Workshop; City lot; Rectangular lot; Lot dimensions approximately 50 x 120
Interior
- Kitchen: Microwave; Oven; Range; Refrigerator
- Bathrooms: 2 full bathrooms
- Heating & cooling: Central heating; Central air conditioning
- Interior features: Ceiling fans; Pantry
Neighborhood map
What this means for you Summary
Snapshot
- This is a 3-bed/2.0-bath single-family listed at $175k.
Deal economics
- At list price, monthly cash flow is $349 ($4k/yr) — positive.
- The deal already cash-flows at list — no discount required.
- Meets the 1% rule at list price ($2k rent vs $175k).
- Recommended offer: $172k (1.5% below list) — sets the bar for market timing.
- Cap rate 8.7% vs local median 6.5% in Westwego — top-decile yield for the area; either an underpriced asset or a hidden risk that comps aren't pricing in. Stress-test before assuming the spread holds.
Location & tenants
- Location reads 68/100 on livability (#97 in LA) — a middle-class / working-renter tenant base. Strengths: cost of living A+, health & safety A+; Watch: schools C-, crime D, amenities D-.
- Jefferson Parish (suburban): math 24% / reading 34% proficiency, ranked #44 of 98 in LA (top 45%) — low school quality limits family demand, transient renter base, plan for 1-2y turnover; 70% free/reduced lunch — lower-income household profile, screen leases tightly.
- Market conditions: Rents soft (-0.8%/yr); 186 active listings in the ZIP; 16 comparable units currently listed for rent nearby; rentals at typical pace (median 24d on market — plan ~3-4 weeks tenant-placement turnaround); 44% of comp listings sitting > 30 days — soft ceiling on asking rent; 518 units permitted in Jefferson Parish in 2024 (43 in 5+ unit buildings).
- This rent runs 39% of the median local income ($54k/yr) — at the standard rent-burdened threshold; future hikes will face affordability resistance.
Forward outlook
- Local home prices are declining (-3.0%/yr); year-one equity from $1k of loan paydown is wiped out by about $5k of value loss. Plan a longer hold.
Negotiation context
- It's been on market 28 days — a 2% lower offer ($172k) is reasonable based on typical stale-listing flexibility.
- 3 sale attempts; this cycle's ask has dropped $24k (12%) from the opening price — seller is motivated, your offer sets the floor, not the list.
- Current owner paid $38k; list at $175k implies a 361% gain — meaningful room to come down on a strong offer.
Questions for the listing agent
- Built in 1979 — when were the roof, HVAC, electrical panel, plumbing, and water heater last replaced?
- Is there a deadline driving the sale (1031 exchange, divorce, estate, relocation)? That informs how much negotiation room exists.
- Crime grade is D in this area — have there been break-ins, vandalism, or insurance claims at this property in the last 3 years? What carrier currently insures it and at what premium?
- What's the average days-on-market for RENTAL listings here right now (not sales)? A rising rental-DOM trend means longer vacancies and softer asking-rent achievability than the comps imply.
- What's the recent tenant-quality profile in this submarket — average credit score on applications, eviction rate, late-payment / NSF rate, and stable-employment percentage? A property-management company in the area should have these aggregated.
- How much new for-sale + rental construction is in the pipeline within 1–3 miles? Heavy new supply typically softens prices + rents 12–24 months out; constrained supply supports both.
Investment metrics
- 1% rule
- 1.00% ✓
- Cap rate
- 8.69%
- Cash-on-cash
- 8.55%
- DSCR
- 1.38
- GRM
- 8.3
CMA / ARV
- ARV (on-the-fly)
- $230,400
- Comps found
- 12
Show comp detail 12 sales within ~0.75 mi
| Address | Dist | Beds/Ba | Sqft | Sold | Price | $/sf | Match |
|---|---|---|---|---|---|---|---|
| 1233 Kingswood Dr | 0.17mi | 3/2.0 | 1,627 (+2%) | 1mo | $285,000 | $175 | 88 |
| 1344 Central Ave | 0.03mi | 3/2.0 | 1,738 (+9%) | 10mo | $285,000 | $164 | 76 |
| 653 Vic A Pitre Dr | 0.36mi | 3/2.0 | 1,491 (-7%) | 1mo | $245,000 | $164 | 71 |
| 1217 Olde Oaks Dr | 0.19mi | 4/2.0 (+1) | 1,677 (+5%) | 12mo | $215,000 | $128 | 68 |
| 1220 Jung Blvd | 0.56mi | 3/2.5 | 1,585 (-1%) | 16mo | $229,000 | $144 | 57 |
| 1135 Kenny Dr | 0.38mi | 4/2.0 (+1) | 1,761 (+10%) | 8mo | $145,000 | $82 | 54 |
| 1108 Kenney Dr | 0.43mi | 3/2.0 | 1,730 (+8%) | 16mo | $131,600 | $76 | 53 |
| 1175 Avenue C | 0.60mi | 3/2.0 | 1,800 (+12%) | 2mo | $180,000 | $100 | 50 |
| 815 W Crystal Ct | 0.71mi | 3/2.0 | 1,486 (-7%) | 15mo | $239,900 | $161 | 43 |
| 1229 Lee St | 0.54mi | 4/2.0 (+1) | 1,447 (-10%) | 16mo | $234,000 | $162 | 40 |
| 1235 Avenue A | 0.69mi | 3/2.0 | 1,784 (+12%) | 11mo | $201,000 | $113 | 40 |
| 821 Barbe St | 0.69mi | 3/2.0 | 1,433 (-10%) | 18mo | $174,900 | $122 | 36 |
Match score weights: distance 35% · size 25% · config 20% · recency 20%. Top-matched comps best support the ARV.
Projected returns pro-forma
-3.0% appreciation · 0.0% rent growth · sell at horizon
- IRR
- -6.4%
- Equity multiple
- 0.77×
- Total profit
- $-11,336
- Equity at exit
- $26,093
- IRR
- -0.5%
- Equity multiple
- 0.97×
- Total profit
- $-1,421
- Equity at exit
- $15,131
Cash invested: $49,000 (down + closing). Projections, not guarantees.
Landlord ↔ Tenant lean methodology
- Overall (STATE)
- 90 Strongly Landlord-Friendly
- State Louisiana
- 90 Strongly Landlord-Friendly · R+12
- County
- — inherits STATE
- City
- — inherits STATE
ZIP-level market 70094
- Rents YoY
- -0.8%
- Active inventory
- 186
- Price-to-rent
- 8.3×
Monthly cashflow live
- Estimated rent
- $1,754 high interval (Pro) →
- Mortgage (P&I)
- −$918
- Tax from tax record
- −$46 /mo · $550/yr
- Insurance
- −$73
- HOA
- −$0
- Vacancy / Maint / Mgmt
- −$368
- Net cashflow
- $349
Break-even live
UW: 25.0% down · 7.5% · 30yr · 1.5% tax · 5.0% vac · 8.0% maint · 8.0% mgmt
Financing live
Cash to close
- Down payment
- $43,750
- Closing costs
- $5,250
- Reserves months
- —
- Total cash needed
- —
Loan-product check · same deal, 3 products live
Conventional
25% down · 7.5% · 30yr
- Down + closing
- —
- Monthly P&I
- —
- Monthly cashflow
- —
- DSCR
- —
- Eligible?
- —
Personal DTI + credit; lowest rate.
DSCR
20% down · 8.5% · 30yr
- Down + closing
- —
- Monthly P&I
- —
- Monthly cashflow
- —
- DSCR
- —
- Eligible?
- —
No personal income docs; deal must DSCR.
Hard money
10% down · 12.0% · 12mo
- Down + closing
- —
- Monthly P&I
- —
- Monthly cashflow
- —
- DSCR
- —
- Eligible?
- —
Short-term bridge; refi at stabilization.
Rent comps 16 comps
| Address | Beds | Baths | Sqft | Rent | $/sqft | DOM | Units | Dist |
|---|---|---|---|---|---|---|---|---|
| 1233 Central Ave Westwego, LA | 3.0 | 1.5 | 1357 | $1,500 | $1.11 | 23d | 1 | 0.19mi |
| 653 Vic a Pitre Dr Westwego, LA | 3.0 | 2.0 | 1491 | $2,200 | $1.48 | 4d | 1 | 0.33mi |
| 1226 Kenny Dr Westwego, LA | 4.0 | 2.0 | 1300 | $1,650 | $1.27 | 23d | 1 | 0.34mi |
| 1029 Joyce St Marrero, LA | 3.0 | 2.0 | 1300 | $1,650 | $1.27 | 14d | 1 | 0.57mi |
| 1060 Avenue B Unit A Westwego, LA | 3.0 | 2.0 | 1124 | $1,550 | $1.38 | 23d | 1 | 0.71mi |
| 1501 Somerset Pl Marrero, LA | 3.0 | 2.0 | 1697 | $1,850 | $1.09 | 43d | 1 | 0.85mi |
| 1501 Somerset Pl Marrero, LA | 3.0 | 2.0 | 1697 | $1,850 | $1.09 | 23d | 1 | 0.86mi |
| 22 Gladiola Ct Marrero, LA | 3.0 | 2.0 | 1933 | $2,200 | $1.14 | 43d | 1 | 0.87mi |
| 520 Bellina Ln Marrero, LA | 2.0 | 1.0 | 1200 | $1,200 | $1.00 | 43d | 1 | 1.09mi |
| 569 Magnolia Dr Marrero, LA | 2.0 | 1.5 | 1450 | $1,500 | $1.03 | 43d | 1 | 1.10mi |
| 181 Louisiana St Westwego, LA | 4.0 | 2.0 | 1500 | $1,550 | $1.03 | 43d | 1 | 1.10mi |
| 517 Bellina Ln Marrero, LA | 2.0 | 1.0 | 1200 | $1,400 | $1.17 | 43d | 1 | 1.11mi |
| 1917 Gladstone Dr Marrero, LA | 3.0 | 2.0 | 1090 | $1,600 | $1.47 | 23d | 1 | 1.30mi |
| 525 Emile Ave Westwego, LA | 3.0 | 2.0 | 1329 | $800 | $0.60 | 23d | 1 | 1.39mi |
| 412 Avenue A Westwego, LA | 2.0 | 1.0 | 1103 | $1,500 | $1.36 | 43d | 1 | 1.44mi |
| 1510 Javez St Marrero, LA | 3.0 | 2.0 | 1578 | $2,200 | $1.39 | 23d | 1 | 1.44mi |
Listing history 18 events
-
2026-06-19price $175,000 Active 28 DOM
-
2026-06-18days on market $199,000 Active 28 DOM
-
2026-06-17days on market $199,000 Active 27 DOM
-
2026-06-16days on market $199,000 Active 26 DOM
-
2026-06-15days on market $199,000 Active 25 DOM
-
2026-06-13days on market $199,000 Active 23 DOM
-
2026-06-10days on market $199,000 Active 20 DOM
-
2026-06-09days on market $199,000 Active 19 DOM
-
2026-06-08days on market $199,000 Active 18 DOM
-
2026-06-07days on market $199,000 Active 17 DOM
-
2026-06-03days on market $199,000 Active 13 DOM
-
2026-06-02days on market $199,000 Active 12 DOM
-
2026-06-01days on market $199,000 Active 11 DOM
-
2026-05-31days on market $199,000 Active 10 DOM
-
2026-05-21$199,000 Active 378-char remark
Show marketing remark (378 chars)
This open floorplan 3/2 in the heart of Westwego is ready for your special touch to make this house your home. The large, open living room has vaulted ceilings. Formal dining in between kitchen and living room can also be used as a den or sitting area. The kitchen has windows overlooking the backyard. The large backyard has a metal workshop and two citrus trees. Flood zone X!
-
2026-05-21$199,000 Active
Show marketing remark (378 chars)
This open floorplan 3/2 in the heart of Westwego is ready for your special touch to make this house your home. The large, open living room has vaulted ceilings. Formal dining in between kitchen and living room can also be used as a den or sitting area. The kitchen has windows overlooking the backyard. The large backyard has a metal workshop and two citrus trees. Flood zone X!
-
2025-02-28$175,000 Active
-
1988-11-01soldstatus $38,000
ⓘ Source: listings_history table (triggers on properties + properties_extension) + one-shot
backfill from property_details.listing_events for pre-trigger history.
Tax reassessment forecast LA · Resets to sale price
- Current annual tax
- $550 · $46/mo
- Projected year-2 tax
- $962 · $80/mo
- Expected delta
- +$412/yr (+$34/mo · 74.9%)
ⓘ Screening estimate from a state-policy table — verify with the county assessor before closing.
Nearby sold comps map
Loading sold comps map…
Walkable amenities ~0.75 mi
Loading nearby amenities…
Taxation est. · year 1
- Rental income
- $21,049
- − Mortgage interest
- −$9,803
- − Property taxes
- −$550
- − Insurance
- −$875
- − Repairs & maintenance
- −$1,684
- − Management
- −$1,684
- − Depreciation
- −$5,091
- Taxable income
- $1,362
- Est. tax owed @ 24.0%
- −$327
- After-tax cash flow
- $3,864/yr
For passive investors: Depreciation is non-cash, so a rental often shows a tax loss while cash-flowing — sheltering income. Rental losses are passive: they offset passive income freely, and up to $25,000/yr can offset ordinary (W-2) income if you actively participate and your MAGI is under $100k (phasing out to $0 by $150k); unused losses carry forward. On sale, claimed depreciation is recaptured at up to 25%, and gains may owe capital-gains tax (a 1031 exchange can defer both). Figures are a year-1 estimate at your 24.0% rate — not tax advice; consult a CPA.
Schools (NCES district)
- District
- Jefferson Parish
- NCES district ID
- 2200840
- Math proficiency
- 24% ▼ -36.00%
- Reading proficiency
- 34% ▼ -30.00%
- Median HH income
- $48,421
- Composite
- 25.19/100
- National rank
- #7511
- State rank
- #44 of 98 in LA
Livability — Westwego
- Score
- 68/100
- State rank
- #97
- US rank
- #9851
Category grades
Schools grade is shown separately in the Schools card above.
Census & demographics
- Census place
- Westwego, LA
- County
- Jefferson Parish · 426,999 people
- City population
- 32,130
- Metro
- New Orleans-Metairie, LA
- Population (ZIP)
- 32,130
- Household income
- $53,597
- Rent vs Own
- Severe rent burden
- 1457.0
Population outlook (Jefferson County) Hauer SSP2
- Today (2025)
- 451,696 people
- By 2030
- 455,451 · +0.8%
- By 2040
- 458,308 · +1.5%
- By 2050
- 461,031 · +2.1%
- By 2075
- 476,351 · +5.5%
- By 2100
- 499,377 · +10.6%
Race, ethnicity, and origin ACS 2023
- Neighborhood character
- Diverse neighborhood (Simpson 0.65)
- Race & ethnicity
- Black 46% White 36% Hispanic / Latino 13% Two or more races 6% Asian 2%
- Hispanic origin (detail)
- Mexican 2% Dominican 2%
- Common ancestry
- Lithuanian 9% Scottish 1%
- Foreign-born
- 8% · Canada, Vietnam
- Languages at home
- 86% English-only · Spanish 11% Vietnamese 2% French/Haitian/Cajun 1%
Political lean MEDSL · Jefferson
- 2024 margin
- R (+12.9) · D 42.5% · R 55.5% · Other 2.1%
- 2008→2024 swing
- +13.6pp toward D · 2008: -26.6pp · 2024: -12.9pp
- All cycles
- 2024: R+12.9 2020: R+11.1 2016: R+14.8 2012: R+18.4 2008: R+26.6
Not yet ingested
- Civics
- —
Market trends
- HPI YoY
- ▼ -111.56%
- Current HPI
- 102.9992
- Rent YoY
- ▼ -0.80%
- Metro
- New Orleans-Metairie, LA
- State GDP YoY
- ▲ 3.29%
- F500 in state
- 10
Industry mix (Fortune 500 HQ in LA)
| Industry | F500 HQs | Revenue |
|---|---|---|
| Telecommunications | 2 | $23B |
|
||
| Utilities | 1 | $12B |
|
||
| Wholesale / Distribution | 1 | $5B |
|
||
| Advertising | 1 | $2B |
|
||
Price history
+423.7% since first listed4 events — show timeline
- 2026-05-21 Listed $199,000 GSREIN
- 2026-05-21 Listed $199,000 AcadianaMLS
- 2025-02-28 Listed $175,000 AcadianaMLS
- 1988-11-01 Sold (Public Records) $38,000 Public Records
Property tax history
+2.3%/yrLatest (2025): $550 · -0.2% YoY. Source: county tax records.
Cash-flow waterfall
monthlySold comps — $/sqft
last 12 mo · ≤1 miLoading sold comps…