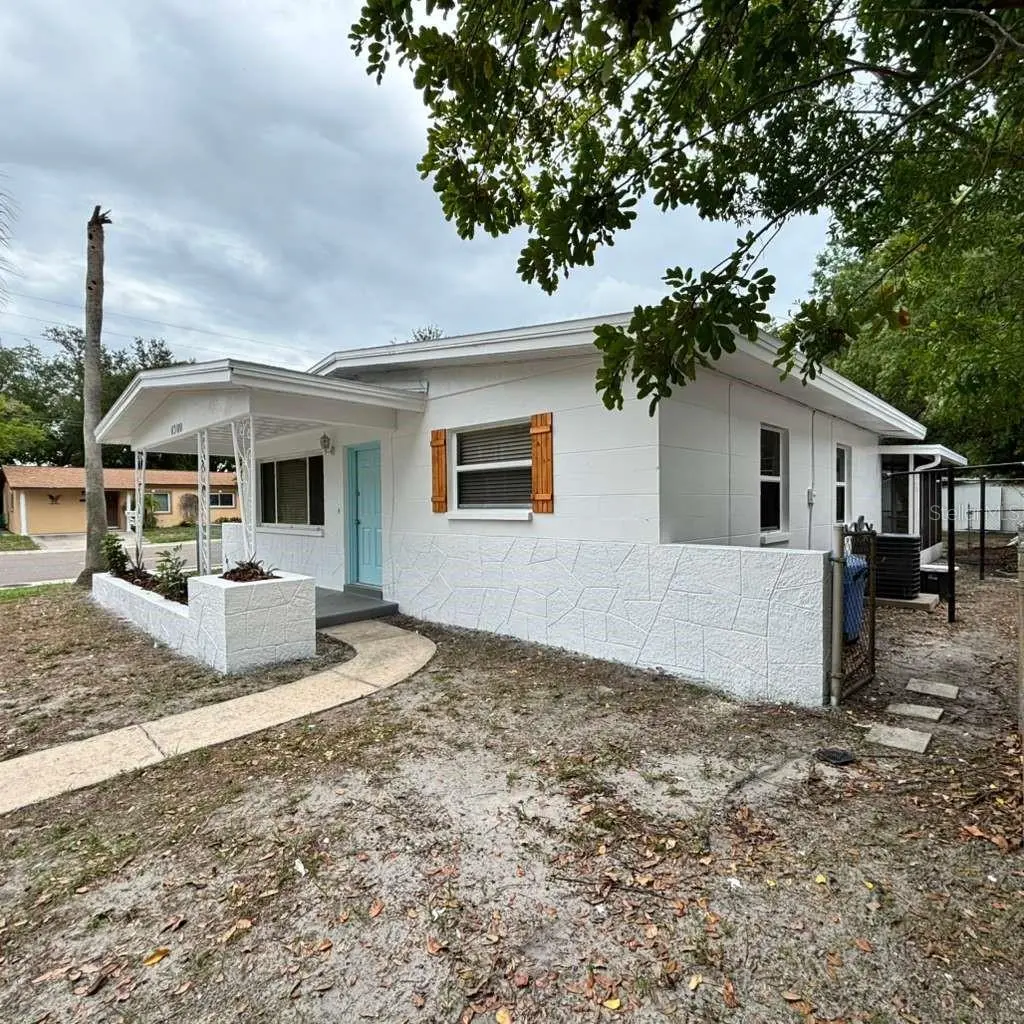
4300 72nd Ave N · Pinellas Park, FL
Flood risk 4/10 · Minor
- FEMA flood zone
- X
- Chance of flooding over 30 yrs
- 0.22%
- Est. flood insurance / yr
- $507 – $1,088
Fire risk 1/10 · Minimal
- Est. fire insurance / yr
- $947 – $1,759
Heat risk 10/10 · Severe
- Hot days now (above 107°F)
- 7 days/yr
- Hot days in 30 yrs
- 26 days/yr
Wind risk 10/10 · Severe
- Chance of severe wind over 30 yrs
- 99.0%
Air-quality risk 4/10 · Minor
- Unhealthy air days now
- 4 days/yr
- Unhealthy air days in 30 yrs
- 4 days/yr
Risk factors via First Street. Map © Google.
Why this score? — see what drove the D+ grade
The composite is a weighted blend of 9 inputs, each scored 0–100. Each bar is that input's sub-score; the figure is the points it added to the 100-point composite (weight × sub-score).
- ARV discount +15.0/15.0
- Cash flow +13.0/30.0
- Schools +4.3/10.0
- DSCR +3.9/10.0
- Livability +3.9/5.0
- 1% rule +3.6/10.0
- Condition / age +2.5/5.0
- Rent growth +1.8/5.0
- Appreciation +0.0/10.0
$283,900
🖨 Deal sheet 📄 Offer letter ✓ Due diligence
Listing remarks MLS
Cute, well-maintained home and land on corner lot. Move in ready. Large Master Bedroom. Great central location. Near shopping mall, bus lines and schools. Inside work and utility room, Bathroom remodeled recently with designer tiles. Large screened in private porch. Fenced in yard. Workshop/laundry room could easily be made into another bathroom.
Key facts
- 6,168 sq ft lot
- Parking
- Built 1959
Property features AI
Finance
- Other: Property type: Residential, single-family; Corner lot with easy access to Park Blvd and US 19N
- Financial info: No lease restrictions indicated
- HOA & community: No HOA association indicated
Exterior
- Parking: Carport (1 space)
- Utilities: Public water; Public sewer; Electricity available
- Home design: Single-family residence; One-story; Faces north
- Construction: Block construction; Shingle roof; Slab foundation; Built area about 1,369 sq ft living (building total 1,732 sq ft)
- Exterior features: Rear screened porch; Other exterior features; Asphalt road access; Lot approximately 50 x 118 (0.14 acres)
Interior
- Kitchen: Range; Refrigerator
- Bedrooms: 3 bedrooms
- Flooring: Other flooring
- Bathrooms: 1 full bathroom
- Heating & cooling: Central heating; Central air conditioning
- Interior features: Ceiling fans
- Laundry & utility: Laundry area (other)
Neighborhood map
What this means for you Summary
Snapshot
- This is a 3-bed/1.0-bath single-family listed at $284k.
Deal economics
- At list price, monthly cash flow is $-15 ($-184/yr) — negative.
- To cash-flow at today's rent, offer at most $281k (1.0% below list).
- To meet the 1% rule (rent ≥ 1% of price), the offer needs to be $243k (14.3% below list).
- Recommended offer: $243k (14.3% below list) — sets the bar for 1% rule.
- Cap rate 6.2% vs local median 4.0% in Pinellas Park — top-decile yield for the area; either an underpriced asset or a hidden risk that comps aren't pricing in. Stress-test before assuming the spread holds.
Location & tenants
- Location reads 78/100 on livability (#170 in FL, #2,546 nationally) — a middle-class / working-renter tenant base. Strengths: commute A+, cost of living A+, housing A+; Watch: employment D+, schools D-, amenities F.
- Pinellas (suburban): math 51% / reading 51% proficiency, ranked #31 of 73 in FL (top 42%) — acceptable for families but not a draw, mixed tenant base, ~2y average lease.
- Market conditions: Rents soft (-3.0%/yr); 226 active listings in the ZIP; 25 comparable units currently listed for rent nearby; rentals at typical pace (median 24d on market — plan ~3-4 weeks tenant-placement turnaround); 2,676 units permitted in Pinellas County in 2024 (1,422 in 5+ unit buildings).
- At $2,432/mo this rent would consume 51% of the median local household income ($58k/yr) (locally 1115% of renters already pay >50% of income on rent) — very limited rent-growth headroom before tenants either downsize or default.
Forward outlook
- Local home prices are declining (-3.0%/yr); year-one equity from $2k of loan paydown is wiped out by about $9k of value loss. Plan a longer hold.
- Pinellas County population projected at +14% by 2050 — modest demand growth; plan on rents tracking national, not racing it.
Negotiation context
- It's been on market 20 days — a 2% lower offer ($280k) is reasonable based on typical stale-listing flexibility.
- 2 sale attempts since 12y ago with the ask held roughly flat each time — persistent listings suggest the price (not the market) is what's stuck; bring a comps-based counter.
- Current owner paid $88k; list at $284k implies a 223% gain — meaningful room to come down on a strong offer.
Risks & watch-outs
- Watch-outs: built in 1959 — expect roof / HVAC / electrical / plumbing capex.
- Climate carrying-cost: severe wind risk, 99% chance of damaging wind over 30y; extreme-heat days projected 7→26/yr by 2055 (HVAC capex compounding) — expect insurance premiums to compound above CPI over the hold.
Questions for the listing agent
- What do current leases actually rent for vs. the listed asking? Can we see a recent rent roll and the last 12 months of T-12 income?
- Built in 1959 — when were the roof, HVAC, electrical panel, plumbing, and water heater last replaced?
- Is there a deadline driving the sale (1031 exchange, divorce, estate, relocation)? That informs how much negotiation room exists.
- Schools are D-rated, which usually means shorter tenancies and higher turnover. Who's the typical renter profile here, and what's been the actual vacancy rate?
- The area grade is low — what's the realistic commute time and amenity access for the typical tenant pool here? Any planned neighborhood developments (good or bad) we should know about?
- What's the average days-on-market for RENTAL listings here right now (not sales)? A rising rental-DOM trend means longer vacancies and softer asking-rent achievability than the comps imply.
- What's the recent tenant-quality profile in this submarket — average credit score on applications, eviction rate, late-payment / NSF rate, and stable-employment percentage? A property-management company in the area should have these aggregated.
- How much new for-sale + rental construction is in the pipeline within 1–3 miles? Heavy new supply typically softens prices + rents 12–24 months out; constrained supply supports both.
Investment metrics
- 1% rule
- 0.86% ✗
- Cap rate
- 6.23%
- Cash-on-cash
- -0.23%
- DSCR
- 0.99
- GRM
- 9.7
CMA / ARV
- ARV (on-the-fly)
- $377,844
- Comps found
- 11
Show comp detail 11 sales within ~0.75 mi
| Address | Dist | Beds/Ba | Sqft | Sold | Price | $/sf | Match |
|---|---|---|---|---|---|---|---|
| 4357 70th Ave N | 0.11mi | 3/3.0 | 1,343 (-2%) | 6mo | $369,570 | $275 | 78 |
| 4373 68th Ave N | 0.24mi | 3/2.0 | 1,328 (-3%) | 9mo | $355,000 | $267 | 73 |
| 4191 71st Ave N | 0.08mi | 3/2.0 | 1,250 (-9%) | 10mo | $380,000 | $304 | 69 |
| 7631 46th Way N | 0.39mi | 3/2.0 | 1,280 (-6%) | 6mo | $340,000 | $266 | 62 |
| 6821 44th St N | 0.24mi | 3/2.0 | 1,259 (-8%) | 18mo | $417,000 | $331 | 56 |
| 4410 67th Ave N | 0.34mi | 3/2.0 | 1,307 (-4%) | 24mo | $275,000 | $210 | 53 |
| 3881 67th Ave N | 0.44mi | 3/1.5 | 1,450 (+6%) | 22mo | $370,000 | $255 | 50 |
| 3450 Beechwood Ter N | 0.72mi | 4/2.0 (+1) | 1,340 (-2%) | 8mo | $395,000 | $295 | 48 |
| 4230 82nd Ave N | 0.63mi | 3/2.0 | 1,325 (-3%) | 17mo | $367,500 | $277 | 47 |
| 7700 47th St N | 0.51mi | 3/3.0 | 1,393 (+2%) | 22mo | $385,000 | $276 | 47 |
| 4330 82nd Ave N | 0.63mi | 3/2.0 | 1,228 (-10%) | 19mo | $375,000 | $305 | 34 |
Match score weights: distance 35% · size 25% · config 20% · recency 20%. Top-matched comps best support the ARV.
Projected returns pro-forma
-3.0% appreciation · 0.0% rent growth · sell at horizon
- IRR
- -20.1%
- Equity multiple
- 0.32×
- Total profit
- $-54,088
- Equity at exit
- $42,330
- IRR
- -21.3%
- Equity multiple
- 0.05×
- Total profit
- $-75,818
- Equity at exit
- $24,546
Cash invested: $79,492 (down + closing). Projections, not guarantees.
Landlord ↔ Tenant lean methodology
- Overall (STATE)
- 87 Strongly Landlord-Friendly
- State Florida
- 87 Strongly Landlord-Friendly · R+3
- County
- — inherits STATE
- City
- — inherits STATE
ZIP-level market 33781
- Rents YoY
- -3.0%
- Active inventory
- 226
- Price-to-rent
- 9.7×
Monthly cashflow live
- Estimated rent
- $2,432 high interval (Pro) →
- Mortgage (P&I)
- −$1,489
- Tax from tax record
- −$330 /mo · $3,956/yr
- Insurance
- −$118
- HOA
- −$0
- Vacancy / Maint / Mgmt
- −$511
- Net cashflow
- $-15
Break-even live
UW: 25.0% down · 7.5% · 30yr · 1.5% tax · 5.0% vac · 8.0% maint · 8.0% mgmt
Financing live
Cash to close
- Down payment
- $70,975
- Closing costs
- $8,517
- Reserves months
- —
- Total cash needed
- —
Loan-product check · same deal, 3 products live
Conventional
25% down · 7.5% · 30yr
- Down + closing
- —
- Monthly P&I
- —
- Monthly cashflow
- —
- DSCR
- —
- Eligible?
- —
Personal DTI + credit; lowest rate.
DSCR
20% down · 8.5% · 30yr
- Down + closing
- —
- Monthly P&I
- —
- Monthly cashflow
- —
- DSCR
- —
- Eligible?
- —
No personal income docs; deal must DSCR.
Hard money
10% down · 12.0% · 12mo
- Down + closing
- —
- Monthly P&I
- —
- Monthly cashflow
- —
- DSCR
- —
- Eligible?
- —
Short-term bridge; refi at stabilization.
Rent comps 25 comps
| Address | Beds | Baths | Sqft | Rent | $/sqft | DOM | Units | Dist |
|---|---|---|---|---|---|---|---|---|
| 4057 71st Ter N Pinellas Park, FL | 3.0 | 2.5 | 1420 | $2,650 | $1.87 | 4d | 1 | 0.18mi |
| 4631 69th Pl N Pinellas Park, FL | 3.0 | 2.5 | 1420 | $2,595 | $1.83 | 24d | 1 | 0.31mi |
| 4627 67th Ave N Pinellas Park, FL | 3.0 | 2.5 | 1610 | $2,500 | $1.55 | 24d | 1 | 0.38mi |
| 6898 47th Ln N Pinellas Park, FL | 3.0 | 2.5 | 1500 | $2,525 | $1.68 | 24d | 1 | 0.43mi |
| 7050 48th St N Pinellas Park, FL | 3.0 | 1.5 | 1008 | $2,350 | $2.33 | 24d | 1 | 0.43mi |
| 4732 68th Ave N Pinellas Park, FL | 2.0 | 3.0 | 1210 | $2,000 | $1.65 | 24d | 1 | 0.45mi |
| 4771 78th Ave N Pinellas Park, FL | 2.0 | 2.0 | 903 | $1,640 | $1.82 | 23d | 1 | 0.65mi |
| 4091 58th Ave N Unit F St. Petersburg, FL | 2.0 | 1.0 | 900 | $1,595 | $1.77 | 2d | 1 | 0.81mi |
| 7800 52nd St N Pinellas Park, FL | 3.0 | 1.0 | 1163 | $1,850 | $1.59 | 24d | 1 | 0.87mi |
| 7911 52nd Way N Pinellas Park, FL | 4.0 | 1.0 | 1036 | $2,500 | $2.41 | 24d | 1 | 0.91mi |
| 3725 57th Ave N Saint Petersburg, FL | 3.0 | 2.0 | 1800 | $3,200 | $1.78 | 4d | 1 | 1.00mi |
| 8851 US Highway 19 N Pinellas Park, FL | 1.0–3.0 | 1.0–2.0 | 993 | $2,850 | $2.87 | 1d | 23 | 1.04mi |
| 5511 65th Ter N Pinellas Park, FL | 3.0 | 2.0 | 1212 | $2,466 | $2.03 | 14d | 1 | 1.08mi |
| 5345 60th Ave N Saint Petersburg, FL | 3.0 | 2.5 | 1740 | $2,400 | $1.38 | 7d | 1 | 1.16mi |
| 4701 88th Ave N Pinellas Park, FL | 1.0–2.0 | 1.0–2.0 | 855 | $1,853 | $2.17 | 10d | 20 | 1.17mi |
| 3584 54th Ave N Saint Petersburg, FL | 3.0 | 1.0 | 1012 | $1,950 | $1.93 | 4d | 1 | 1.27mi |
| 6379 29th St N Saint Petersburg, FL | 3.0 | 2.0 | 1323 | $2,869 | $2.17 | 24d | 1 | 1.30mi |
| 3110 Grand Ave Pinellas Park, FL | 1.0–3.0 | 1.0–2.0 | 1104 | $3,038 | $2.75 | 1d | 34 | 1.30mi |
| 5660 81st Ave N Pinellas Park, FL | 4.0 | 1.0 | 1300 | $2,295 | $1.77 | 4d | 1 | 1.30mi |
| 7005 59th St N Pinellas Park, FL | 3.0 | 2.0 | 1274 | $2,889 | $2.27 | 24d | 1 | 1.34mi |
| 5384 56th Ave N Saint Petersburg, FL | 3.0 | 2.0 | 1568 | $3,400 | $2.17 | 24d | 1 | 1.36mi |
| 3132 56th Ave N Saint Petersburg, FL | 3.0 | 2.0 | 1063 | $2,850 | $2.68 | 24d | 1 | 1.37mi |
| 4973 91st Ave Unit C Pinellas Park, FL | 2.0 | 2.0 | 875 | $1,475 | $1.69 | 13d | 1 | 1.40mi |
| 4973 91st Ave Unit 12 (C) Pinellas Park, FL | 2.0 | 2.0 | 875 | $1,475 | $1.69 | 14d | 1 | 1.40mi |
| 2715 63rd Ter N Unit B St. Petersburg, FL | 2.0 | 2.0 | 1030 | $1,900 | $1.84 | 24d | 1 | 1.43mi |
Listing history 14 events
-
2026-06-18days on market $283,900 Active 20 DOM
-
2026-06-17days on market $283,900 Active 19 DOM
-
2026-06-16days on market $283,900 Active 18 DOM
-
2026-06-15days on market $283,900 Active 17 DOM
-
2026-06-13days on market $283,900 Active 15 DOM
-
2026-06-09days on market $283,900 Active 11 DOM
-
2026-06-08pricedays on market $283,900 Active 10 DOM
-
2026-06-07days on market $295,000 Active 9 DOM
-
2026-06-04days on market $295,000 Active 6 DOM
-
2026-06-03days on market $295,000 Active 5 DOM
-
2026-06-02days on market $295,000 Active 4 DOM
-
2026-06-01days on market $295,000 Active 3 DOM
-
2026-05-31remarks 618-char remark
-
2026-05-31days on market $295,000 Active 2 DOM
ⓘ Source: listings_history table (triggers on properties + properties_extension) + one-shot
backfill from property_details.listing_events for pre-trigger history.
Tax reassessment forecast FL · Resets to sale price
- Current annual tax
- $3,956 · $330/mo
- Projected year-2 tax
- $3,956 · $330/mo
- Expected delta
- $0/yr ($0/mo · 0.0%)
ⓘ Screening estimate from a state-policy table — verify with the county assessor before closing.
Climate risk First Street
- Flood 4/10 Moderate FEMA zone X · 22% chance over 30 yrs
- Wildfire 1/10 Low
- Heat 10/10 Extreme 7 d/yr ≥107°F today · 26 d/yr by 30 yrs out
- Wind 10/10 Extreme 99% chance of damaging wind over 30 yrs
- Air quality 4/10 Moderate 4 unhealthy d/yr today · 4 by 30 yrs out
Nearby sold comps map
Loading sold comps map…
Walkable amenities ~0.75 mi
Loading nearby amenities…
Taxation est. · year 1
- Rental income
- $29,186
- − Mortgage interest
- −$15,903
- − Property taxes
- −$3,956
- − Insurance
- −$1,420
- − Repairs & maintenance
- −$2,335
- − Management
- −$2,335
- − Depreciation
- −$8,259
- Taxable loss
- −$5,021
- Est. tax savings @ 24.0%
- +$1,205
- After-tax cash flow
- $1,021/yr
For passive investors: Depreciation is non-cash, so a rental often shows a tax loss while cash-flowing — sheltering income. Rental losses are passive: they offset passive income freely, and up to $25,000/yr can offset ordinary (W-2) income if you actively participate and your MAGI is under $100k (phasing out to $0 by $150k); unused losses carry forward. On sale, claimed depreciation is recaptured at up to 25%, and gains may owe capital-gains tax (a 1031 exchange can defer both). Figures are a year-1 estimate at your 24.0% rate — not tax advice; consult a CPA.
Schools (NCES district)
- District
- Pinellas
- NCES district ID
- 1201560
- Math proficiency
- 51% ▼ -5.00%
- Reading proficiency
- 51% ▼ -3.00%
- Median HH income
- $46,270
- Composite
- 43.27/100
- National rank
- #3046
- State rank
- #31 of 73 in FL
Livability — Pinellas Park
- Score
- 78/100
- State rank
- #170
- US rank
- #2546
Category grades
Schools grade is shown separately in the Schools card above.
Census & demographics
- Census place
- Pinellas Park, FL
- County
- Pinellas County · 939,478 people
- City population
- 50,533
- Metro
- Tampa-St. Petersburg-Clearwater, FL
- Population (ZIP)
- 28,072
- Household income
- $57,785
- Rent vs Own
- Severe rent burden
- 1115.0
Population outlook (Pinellas County) Hauer SSP2
- Today (2025)
- 1,027,532 people
- By 2030
- 1,063,586 · +3.5%
- By 2040
- 1,125,020 · +9.5%
- By 2050
- 1,168,637 · +13.7%
- By 2075
- 1,265,188 · +23.1%
- By 2100
- 1,260,357 · +22.7%
Race, ethnicity, and origin ACS 2023
- Neighborhood character
- Diverse neighborhood (Simpson 0.60)
- Race & ethnicity
- White 59% Hispanic / Latino 16% Asian 14% Two or more races 11% Black 7%
- Hispanic origin (detail)
- Mexican 2% Puerto Rican 6% Cuban 5%
- Common ancestry
- Romanian 3% Lithuanian 3% Slovak 2%
- Foreign-born
- 18% · Canada, Vietnam, Jamaica
- Languages at home
- 72% English-only · Spanish 12% Vietnamese 7% Other Asian/Pacific 3%
Political lean MEDSL · Pinellas
- 2024 margin
- Lean R (+5.2) · D 46.9% · R 52.1%
- 2008→2024 swing
- -13.5pp toward R · 2008: 8.3pp · 2024: -5.2pp
- All cycles
- 2024: R+5.2 2020: D+0.2 2016: R+1.1 2012: D+5.6 2008: D+8.3
Not yet ingested
- Civics
- —
Market trends
- HPI YoY
- ▼ -409.77%
- Current HPI
- 348.546
- Rent YoY
- ▼ -2.95%
- Metro
- Tampa-St. Petersburg-Clearwater, FL
- State GDP YoY
- ▲ 3.28%
- F500 in state
- 36
Industry mix (Fortune 500 HQ in FL)
| Industry | F500 HQs | Revenue |
|---|---|---|
| Industrial Technology | 2 | $29B |
|
||
| Insurance | 2 | $17B |
|
||
| Retail | 1 | $60B |
|
||
| Technology Distribution | 1 | $58B |
|
||
| Homebuilding | 1 | $35B |
|
||
| Technology Manufacturing | 1 | $35B |
|
||
Price history
+515.9% since first listed7 events — show timeline
- 2026-05-29 Listed $295,000 Stellar MLS as Distributed by MLS Grid
- 2014-06-10 Sold (Public Records) $88,000 Public Records
- 2014-06-02 Sold (MLS) $88,000 Stellar MLS as Distributed by MLS Grid
- 2014-05-13 Contingent — Stellar MLS as Distributed by MLS Grid
- 2014-04-08 Price Changed $89,900 Stellar MLS as Distributed by MLS Grid
- 2014-04-04 Listed $98,000 Stellar MLS as Distributed by MLS Grid
- 1986-06-12 Sold (Public Records) $47,900 Public Records
Property tax history
+9.9%/yrLatest (2025): $3,956 · +8.3% YoY. Source: county tax records.
Cash-flow waterfall
monthlySold comps — $/sqft
last 12 mo · ≤1 miLoading sold comps…