2031 NW 31st St · Oklahoma City, OK
Flood risk 1/10 · Minimal
- FEMA flood zone
- X (unshaded)
- Chance of flooding over 30 yrs
- 0.0%
- Est. flood insurance / yr
- $507 – $1,088
Fire risk 1/10 · Minimal
- Est. fire insurance / yr
- $2,463 – $4,575
Heat risk 6/10 · Moderate
- Hot days now (above 107°F)
- 7 days/yr
- Hot days in 30 yrs
- 18 days/yr
Wind risk 2/10 · Minimal
- Chance of severe wind over 30 yrs
- 3.0%
Air-quality risk 2/10 · Minimal
- Unhealthy air days now
- 1 days/yr
- Unhealthy air days in 30 yrs
- 2 days/yr
Risk factors via First Street. Map © Google.
Why this score? — see what drove the C- grade
The composite is a weighted blend of 9 inputs, each scored 0–100. Each bar is that input's sub-score; the figure is the points it added to the 100-point composite (weight × sub-score).
- Cash flow +18.2/30.0
- ARV discount +14.8/15.0
- DSCR +5.7/10.0
- 1% rule +4.3/10.0
- Livability +4.0/5.0
- Rent growth +3.6/5.0
- Condition / age +2.5/5.0
- Schools +0.7/10.0
- Appreciation +0.0/10.0
$140,000
🖨 Deal sheet 📄 Offer letter ✓ Due diligence
Listing remarks MLS
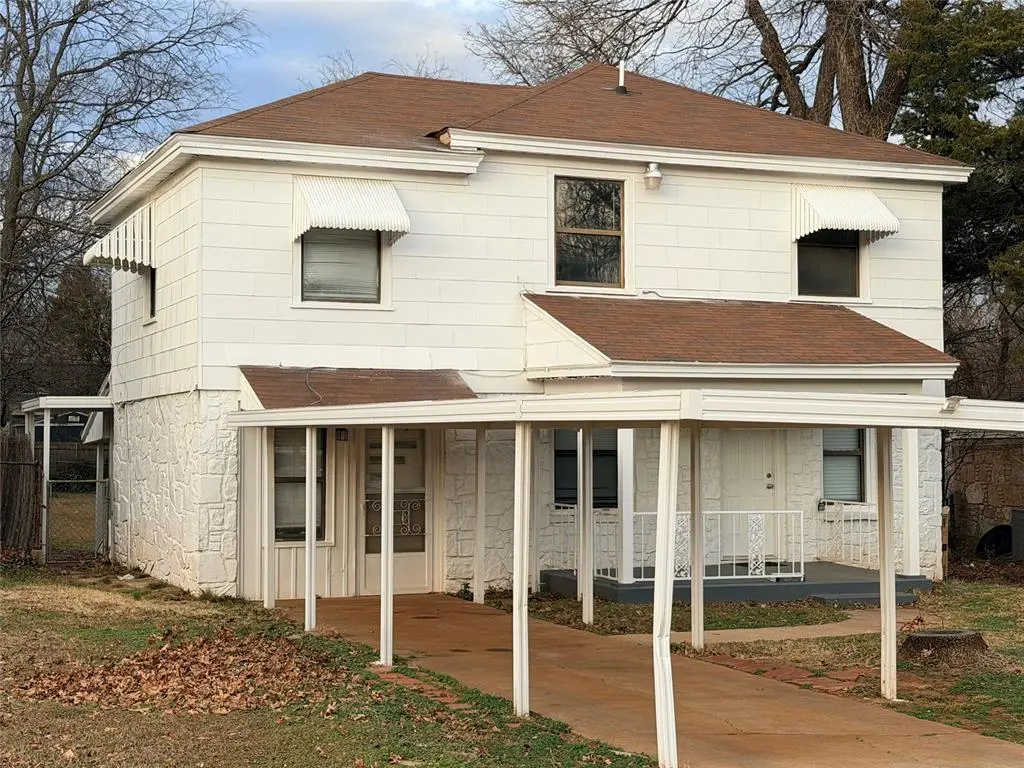
This centrally located home offers a functional layout with three bedrooms and one-and-a-half bathrooms, providing flexible living space in an established neighborhood. Original wood flooring adds character throughout much of the home, while the converted garage creates additional usable interior space. The property features a generous backyard with a covered patio, offering outdoor space suitable for relaxing or entertaining. Positioned on an interior lot with convenient access to Penn Avenue, the home is well located near shopping, dining, and major thoroughfares. A solid opportunity in a central Oklahoma City location with long-term potential.
Key facts
- Converted garage
- Covered patio
- Interior lot
Tags
Neighborhood map
What this means for you Summary
Snapshot
- This is a 3-bed/2.0-bath single-family listed at $140k.
Deal economics
- At list price, monthly cash flow is $125 ($1k/yr) — positive.
- The deal already cash-flows at list — no discount required.
- To meet the 1% rule (rent ≥ 1% of price), the offer needs to be $130k (6.8% below list).
- Recommended offer: $130k (6.8% below list) — sets the bar for 1% rule.
- Cap rate 7.4% vs local median 3.7% in Oklahoma City — top-decile yield for the area; either an underpriced asset or a hidden risk that comps aren't pricing in. Stress-test before assuming the spread holds.
Location & tenants
- Location reads 80/100 on livability (#3 in OK, #1,635 nationally) — a professional / high-income tenant draw. Strengths: amenities A+, commute A+, cost of living A+; Watch: schools F, crime F.
- Oklahoma City (urban): math 7% / reading 10% proficiency, ranked #254 of 270 in OK (top 94%) — low school quality limits family demand, transient renter base, plan for 1-2y turnover; 82% free/reduced lunch — lower-income household profile, screen leases tightly.
- Market conditions: Rents rising fast (+4.5%/yr); 184 active listings in the ZIP; 40 comparable units currently listed for rent nearby; rentals at typical pace (median 21d on market — plan ~3-4 weeks tenant-placement turnaround); 5,365 units permitted in Oklahoma County in 2024 (569 in 5+ unit buildings).
Forward outlook
- Local home prices are declining (-3.0%/yr); year-one equity from $968 of loan paydown is wiped out by about $4k of value loss. Plan a longer hold.
- Oklahoma County population projected at +41% by 2050 — long-run rental-demand tailwind backs the buy-and-hold thesis.
Negotiation context
- It's been on market 33 days — a 3% lower offer ($136k) is reasonable based on typical stale-listing flexibility.
- 3 sale attempts since 9y ago with the ask held roughly flat each time — persistent listings suggest the price (not the market) is what's stuck; bring a comps-based counter.
- Current owner paid $70k; list at $140k implies a 99% gain — meaningful room to come down on a strong offer.
Risks & watch-outs
- Watch-outs: built in 1938 — expect roof / HVAC / electrical / plumbing capex.
- Climate carrying-cost: extreme-heat days projected 7→18/yr by 2055 (HVAC capex compounding) — expect insurance premiums to compound above CPI over the hold.
Questions for the listing agent
- It's been on market 33 days. Have you received any prior offers? Is the seller open to a 7% concession, seller financing, or rate buy-down credit?
- Built in 1938 — when were the roof, HVAC, electrical panel, plumbing, and water heater last replaced?
- Is there a deadline driving the sale (1031 exchange, divorce, estate, relocation)? That informs how much negotiation room exists.
- Schools are F-rated, which usually means shorter tenancies and higher turnover. Who's the typical renter profile here, and what's been the actual vacancy rate?
- Crime grade is F in this area — have there been break-ins, vandalism, or insurance claims at this property in the last 3 years? What carrier currently insures it and at what premium?
- What's the average days-on-market for RENTAL listings here right now (not sales)? A rising rental-DOM trend means longer vacancies and softer asking-rent achievability than the comps imply.
- What's the recent tenant-quality profile in this submarket — average credit score on applications, eviction rate, late-payment / NSF rate, and stable-employment percentage? A property-management company in the area should have these aggregated.
- How much new for-sale + rental construction is in the pipeline within 1–3 miles? Heavy new supply typically softens prices + rents 12–24 months out; constrained supply supports both.
Investment metrics
- 1% rule
- 0.93% ✗
- Cap rate
- 7.36%
- Cash-on-cash
- 3.82%
- DSCR
- 1.17
- GRM
- 8.9
CMA / ARV
- ARV (median comp)
- $167,000
- List price
- $140,000
- Delta
- -16.17%
- Verdict
- UNDERPRICED
- Comps
- 20 within 1.0 mi
Show comp detail 12 sales within ~0.75 mi
| Address | Dist | Beds/Ba | Sqft | Sold | Price | $/sf | Match |
|---|---|---|---|---|---|---|---|
| 2033 NW 31st Ter | 0.07mi | 3/1.5 | 1,356 (+13%) | 2mo | $137,000 | $101 | 72 |
| 1732 NW 32nd St | 0.29mi | 3/1.0 | 1,296 (+8%) | 2mo | $125,000 | $96 | 68 |
| 1911 NW 29 St | 0.21mi | 3/1.0 | 1,330 (+11%) | 2mo | $147,000 | $111 | 67 |
| 1704 NW 31st St | 0.35mi | 2/2.0 (-1) | 1,287 (+7%) | 2mo | $245,000 | $190 | 65 |
| 2537 NW 31st St | 0.64mi | 2/1.0 (-1) | 1,197 (-0%) | 3mo | $172,000 | $144 | 58 |
| 2321 N Youngs Blvd | 0.70mi | 2/1.0 (-1) | 1,216 (+1%) | 1mo | $179,000 | $147 | 56 |
| 3824 Key Pl | 0.67mi | 3/2.0 | 1,310 (+9%) | 1mo | $204,000 | $156 | 53 |
| 2316 Cashion Pl | 0.34mi | 2/1.0 (-1) | 1,056 (-12%) | 2mo | $110,000 | $104 | 53 |
| 4007 N Kentucky Ave | 0.71mi | 4/2.5 (+1) | 1,296 (+8%) | 3mo | $85,500 | $66 | 45 |
| 2600 N Cashion Pl | 0.68mi | 3/2.0 | 1,360 (+13%) | 3mo | $205,000 | $151 | 44 |
| 2621 NW 32nd St | 0.73mi | 2/1.5 (-1) | 1,078 (-10%) | 3mo | $152,000 | $141 | 39 |
| 2608 NW 35th St | 0.74mi | 2/1.0 (-1) | 1,350 (+12%) | 2mo | $197,500 | $146 | 34 |
Match score weights: distance 35% · size 25% · config 20% · recency 20%. Top-matched comps best support the ARV.
Projected returns pro-forma
-3.0% appreciation · 4.45% rent growth · sell at horizon
- IRR
- -8.8%
- Equity multiple
- 0.67×
- Total profit
- $-12,818
- Equity at exit
- $20,874
- IRR
- 2.4%
- Equity multiple
- 1.18×
- Total profit
- $7,168
- Equity at exit
- $12,105
Cash invested: $39,200 (down + closing). Projections, not guarantees.
Landlord ↔ Tenant lean methodology
- Overall (STATE)
- 83 Strongly Landlord-Friendly
- State Oklahoma
- 83 Strongly Landlord-Friendly · R+20
- County
- — inherits STATE
- City
- — inherits STATE
ZIP-level market 73118
- Rents YoY
- 4.5%
- Active inventory
- 184
- Price-to-rent
- 8.9×
Monthly cashflow live
- Estimated rent
- $1,305 high interval (Pro) →
- Mortgage (P&I)
- −$734
- Tax from tax record
- −$113 /mo · $1,359/yr
- Insurance
- −$58
- HOA
- −$0
- Vacancy / Maint / Mgmt
- −$274
- Net cashflow
- $125
Break-even live
UW: 25.0% down · 7.5% · 30yr · 1.5% tax · 5.0% vac · 8.0% maint · 8.0% mgmt
Financing live
Cash to close
- Down payment
- $35,000
- Closing costs
- $4,200
- Reserves months
- —
- Total cash needed
- —
Loan-product check · same deal, 3 products live
Conventional
25% down · 7.5% · 30yr
- Down + closing
- —
- Monthly P&I
- —
- Monthly cashflow
- —
- DSCR
- —
- Eligible?
- —
Personal DTI + credit; lowest rate.
DSCR
20% down · 8.5% · 30yr
- Down + closing
- —
- Monthly P&I
- —
- Monthly cashflow
- —
- DSCR
- —
- Eligible?
- —
No personal income docs; deal must DSCR.
Hard money
10% down · 12.0% · 12mo
- Down + closing
- —
- Monthly P&I
- —
- Monthly cashflow
- —
- DSCR
- —
- Eligible?
- —
Short-term bridge; refi at stabilization.
Rent comps 40 comps
| Address | Beds | Baths | Sqft | Rent | $/sqft | DOM | Units | Dist |
|---|---|---|---|---|---|---|---|---|
| 2109 NW 31st St Oklahoma City, OK | 3.0 | 1.0 | 1289 | $1,350 | $1.05 | 2d | 1 | 0.07mi |
| 2037 NW 32nd Ter Oklahoma City, OK | 2.0 | 1.5 | 1053 | $1,100 | $1.04 | 43d | 1 | 0.11mi |
| 2100 NW 33rd St Oklahoma City, OK | 2.0 | 1.0 | 1004 | $1,245 | $1.24 | 2d | 1 | 0.13mi |
| 2022 NW 33rd St Oklahoma City, OK | 3.0 | 1.0 | 936 | $1,150 | $1.23 | 15d | 1 | 0.14mi |
| 2136 NW 32nd St Oklahoma City, OK | 2.0 | 1.0 | 806 | $925 | $1.15 | 21d | 1 | 0.14mi |
| 2212 NW 31st St Oklahoma City, OK | 2.0 | 1.0 | 810 | $1,024 | $1.26 | 14d | 1 | 0.20mi |
| 2042 NW 34th St Oklahoma City, OK | 2.0 | 1.0 | 968 | $1,050 | $1.08 | 11d | 1 | 0.21mi |
| 2220 NW 32nd St Oklahoma City, OK | 2.0 | 1.0 | 850 | $1,300 | $1.53 | 21d | 1 | 0.23mi |
| 2132 NW 29th St Unit 2134 Oklahoma City, OK | 2.0 | 1.0 | 850 | $1,000 | $1.18 | 14d | 1 | 0.23mi |
| 1832 NW 33rd St Oklahoma City, OK | 4.0 | 2.0 | 1464 | $1,700 | $1.16 | 43d | 1 | 0.23mi |
| 2004 NW 28th St Oklahoma City, OK | 2.0 | 1.0 | 1425 | $1,195 | $0.84 | 43d | 1 | 0.26mi |
| 1731 NW 32nd St Unit 15 Oklahoma City, OK | 3.0 | 2.0 | 1200 | $1,175 | $0.98 | 21d | 1 | 0.31mi |
| 1731 NW 32nd St Unit 11 Oklahoma City, OK | 2.0 | 1.0 | 1000 | $850 | $0.85 | 23d | 1 | 0.31mi |
| 1704 NW 32nd St Oklahoma City, OK | 2.0 | 1.0 | 1187 | $1,500 | $1.26 | 2d | 1 | 0.36mi |
| 2024 NW 26th St Oklahoma City, OK | 2.0 | 1.0 | 947 | $1,099 | $1.16 | 43d | 1 | 0.41mi |
| 2140 NW 36th St Oklahoma City, OK | 3.0 | 1.0 | 829 | $1,400 | $1.69 | 43d | 1 | 0.41mi |
| 1601 NW 30th St Oklahoma City, OK | 2.0 | 1.0–2.0 | 698 | $999 | $1.43 | 23d | 13 | 0.42mi |
| 3633 N Youngs Blvd Oklahoma City, OK | 3.0 | 2.5 | 1404 | $1,450 | $1.03 | 3d | 1 | 0.46mi |
| 1605 NW 29th St Oklahoma City, OK | 2.0 | 1.0 | 885 | $995 | $1.12 | 43d | 1 | 0.47mi |
| 2400 NW 30th St Oklahoma City, OK | 2.0 | 2.0 | 1078 | $1,289 | $1.20 | 43d | 1 | 0.47mi |
| 1607 NW 29th St Oklahoma City, OK | 2.0 | 1.0 | 885 | $850 | $0.96 | 23d | 1 | 0.47mi |
| 2042 NW 25th St Unit 17E Oklahoma City, OK | 2.0 | 1.0 | 725 | $750 | $1.03 | 43d | 1 | 0.48mi |
| 2030 NW 25th St Unit 4 Oklahoma City, OK | 2.0 | 1.0 | 725 | $750 | $1.03 | 43d | 1 | 0.49mi |
| 2030 NW 25th St Unit 17 Oklahoma City, OK | 2.0 | 1.0 | 725 | $750 | $1.03 | 3d | 1 | 0.49mi |
| 2030 NW 25th St Unit 1 Oklahoma City, OK | 2.0 | 1.0 | 725 | $750 | $1.03 | 43d | 1 | 0.49mi |
| 2400 NW 30th St Oklahoma City, OK | 1.0–2.0 | 1.0–2.0 | 801 | $1,279 | $1.60 | 1d | 11 | 0.52mi |
| 2400 NW 36th St Oklahoma City, OK | 2.0 | 1.0 | 950 | $1,100 | $1.16 | 43d | 1 | 0.54mi |
| 1446 NW 31st St Unit A Oklahoma City, OK | 2.0 | 1.0 | 1000 | $985 | $0.98 | 1d | 1 | 0.59mi |
| 1446 NW 31st St Unit B Oklahoma City, OK | 2.0 | 1.0 | 900 | $1,040 | $1.16 | 43d | 1 | 0.59mi |
| 3915 N Pennsylvania Ave Oklahoma City, OK | 2.0 | 2.0 | 1065 | $1,495 | $1.40 | 43d | 1 | 0.59mi |
| 2504 NW 27th St Oklahoma City, OK | 2.0 | 1.0 | 1303 | $1,450 | $1.11 | 43d | 1 | 0.67mi |
| 1809 NW 39th St Oklahoma City, OK | 3.0 | 2.0 | 1318 | $1,625 | $1.23 | 2d | 1 | 0.71mi |
| 2424 NW 39th St Oklahoma City, OK | 2.0 | 1.0–1.5 | 787 | $850 | $1.08 | 3d | 4 | 0.73mi |
| 2236 NW 22nd St Oklahoma City, OK | 2.0 | 1.0 | 1200 | $950 | $0.79 | 21d | 1 | 0.75mi |
| 2442 NW 39th St Oklahoma City, OK | 2.0 | 1.0 | 775 | $850 | $1.10 | 20d | 1 | 0.80mi |
| 1433 NW 24th St Oklahoma City, OK | 2.0 | 1.0 | 843 | $950 | $1.13 | 21d | 1 | 0.81mi |
| 1429 NW 24th St Unit 119 Oklahoma City, OK | 2.0 | 1.0 | 843 | $950 | $1.13 | 43d | 1 | 0.81mi |
| 2605 NW 24th St Oklahoma City, OK | 2.0 | 1.0 | 1300 | $1,525 | $1.17 | 2d | 1 | 0.87mi |
| 2517 NW 38th St Oklahoma City, OK | 3.0 | 1.0 | 1000 | $1,225 | $1.23 | 3d | 1 | 0.88mi |
| 2517 NW 38th St Oklahoma City, OK | 3.0 | 1.0 | 1000 | $1,225 | $1.23 | 23d | 1 | 0.88mi |
Listing history 13 events
-
2026-06-05status $140,000 Pending 33 DOM
-
2026-06-03days on market $140,000 Active 33 DOM
-
2026-06-02days on market $140,000 Active 32 DOM
-
2026-06-01days on market $140,000 Active 31 DOM
-
2026-05-31days on market $140,000 Active 30 DOM
-
2026-05-08status Active 654-char remark
Show marketing remark (654 chars)
This centrally located home offers a functional layout with three bedrooms and one-and-a-half bathrooms, providing flexible living space in an established neighborhood. Original wood flooring adds character throughout much of the home, while the converted garage creates additional usable interior space. The property features a generous backyard with a covered patio, offering outdoor space suitable for relaxing or entertaining. Positioned on an interior lot with convenient access to Penn Avenue, the home is well located near shopping, dining, and major thoroughfares. A solid opportunity in a central Oklahoma City location with long-term potential.
-
2026-01-21status Pending 654-char remark
Show marketing remark (654 chars)
This centrally located home offers a functional layout with three bedrooms and one-and-a-half bathrooms, providing flexible living space in an established neighborhood. Original wood flooring adds character throughout much of the home, while the converted garage creates additional usable interior space. The property features a generous backyard with a covered patio, offering outdoor space suitable for relaxing or entertaining. Positioned on an interior lot with convenient access to Penn Avenue, the home is well located near shopping, dining, and major thoroughfares. A solid opportunity in a central Oklahoma City location with long-term potential.
-
2026-01-10$140,000 Active 654-char remark
Show marketing remark (654 chars)
This centrally located home offers a functional layout with three bedrooms and one-and-a-half bathrooms, providing flexible living space in an established neighborhood. Original wood flooring adds character throughout much of the home, while the converted garage creates additional usable interior space. The property features a generous backyard with a covered patio, offering outdoor space suitable for relaxing or entertaining. Positioned on an interior lot with convenient access to Penn Avenue, the home is well located near shopping, dining, and major thoroughfares. A solid opportunity in a central Oklahoma City location with long-term potential.
-
2017-03-22soldstatus $70,500
-
2017-03-21soldstatus $70,500 Sold 235-char remark
Show marketing remark (235 chars)
Great investment opportunity! This house has so much potential. Beautiful wood floors through out with a converted garage for extra space and a large backyard with a covered patio for entertaining. Photos of the inside will be up 2/20.
-
2017-02-22status Pending 235-char remark
Show marketing remark (235 chars)
Great investment opportunity! This house has so much potential. Beautiful wood floors through out with a converted garage for extra space and a large backyard with a covered patio for entertaining. Photos of the inside will be up 2/20.
-
2017-02-17$70,000 Active 235-char remark
Show marketing remark (235 chars)
Great investment opportunity! This house has so much potential. Beautiful wood floors through out with a converted garage for extra space and a large backyard with a covered patio for entertaining. Photos of the inside will be up 2/20.
-
1992-06-15soldstatus $33,000
ⓘ Source: listings_history table (triggers on properties + properties_extension) + one-shot
backfill from property_details.listing_events for pre-trigger history.
Tax reassessment forecast OK · Resets to sale price
- Current annual tax
- $1,359 · $113/mo
- Projected year-2 tax
- $1,359 · $113/mo
- Expected delta
- $0/yr ($0/mo · 0.0%)
ⓘ Screening estimate from a state-policy table — verify with the county assessor before closing.
Climate risk First Street
- Flood 1/10 Low FEMA zone X (unshaded) · 0% chance over 30 yrs
- Wildfire 1/10 Low
- Heat 6/10 Major 7 d/yr ≥107°F today · 18 d/yr by 30 yrs out
- Wind 2/10 Low 3% chance of damaging wind over 30 yrs
- Air quality 2/10 Low 1 unhealthy d/yr today · 2 by 30 yrs out
Nearby sold comps map
Loading sold comps map…
Walkable amenities ~0.75 mi
Loading nearby amenities…
Taxation est. · year 1
- Rental income
- $15,655
- − Mortgage interest
- −$7,842
- − Property taxes
- −$1,359
- − Insurance
- −$700
- − Repairs & maintenance
- −$1,252
- − Management
- −$1,252
- − Depreciation
- −$4,073
- Taxable loss
- −$823
- Est. tax savings @ 24.0%
- +$198
- After-tax cash flow
- $1,696/yr
For passive investors: Depreciation is non-cash, so a rental often shows a tax loss while cash-flowing — sheltering income. Rental losses are passive: they offset passive income freely, and up to $25,000/yr can offset ordinary (W-2) income if you actively participate and your MAGI is under $100k (phasing out to $0 by $150k); unused losses carry forward. On sale, claimed depreciation is recaptured at up to 25%, and gains may owe capital-gains tax (a 1031 exchange can defer both). Figures are a year-1 estimate at your 24.0% rate — not tax advice; consult a CPA.
Schools (NCES district)
- District
- Oklahoma City
- NCES district ID
- 4022770
- Math proficiency
- 7% ▼ -5.00%
- Reading proficiency
- 10% ▼ -6.00%
- Median HH income
- $35,606
- Composite
- 7.0/100
- National rank
- #9970
- State rank
- #254 of 270 in OK
Livability — Oklahoma City
- Score
- 80/100
- State rank
- #3
- US rank
- #1635
Category grades
Schools grade is shown separately in the Schools card above.
Census & demographics
- Census place
- Oklahoma City, OK
- County
- Oklahoma County · 771,644 people
- City population
- 498,656
- Metro
- Oklahoma City, OK
- Population (ZIP)
- 14,262
- Household income
- $69,827
- Rent vs Own
- Severe rent burden
- 728.0
Population outlook (Oklahoma County) Hauer SSP2
- Today (2025)
- 911,875 people
- By 2030
- 982,413 · +7.7%
- By 2040
- 1,130,468 · +24.0%
- By 2050
- 1,288,422 · +41.3%
- By 2075
- 1,711,482 · +87.7%
- By 2100
- 2,088,448 · +129.0%
Race, ethnicity, and origin ACS 2023
- Neighborhood character
- Predominantly White (67%)
- Race & ethnicity
- White 67% Hispanic / Latino 14% Two or more races 13% Black 5% Asian 4% Native American 2%
- Hispanic origin (detail)
- Mexican 10%
- Common ancestry
- Slovak 5% Italian 4% Portuguese 3%
- Foreign-born
- 9% · Canada, Vietnam, Philippines
- Languages at home
- 87% English-only · Spanish 10% Vietnamese 1% Other Asian/Pacific 1%
Political lean MEDSL · Oklahoma
- 2024 margin
- Toss-up / Even · D 48.0% · R 49.7% · Other 2.3%
- 2008→2024 swing
- +15.1pp toward D · 2008: -16.8pp · 2024: -1.7pp
- All cycles
- 2024: R+1.7 2020: R+1.1 2016: R+10.5 2012: R+16.7 2008: R+16.8
Not yet ingested
- Civics
- —
Market trends
- HPI YoY
- ▼ -321.71%
- Current HPI
- 298.6106
- Rent YoY
- ▲ 4.45%
- Metro
- Oklahoma City, OK
- State GDP YoY
- ▲ 1.55%
- F500 in state
- 6
Industry mix (Fortune 500 HQ in OK)
| Industry | F500 HQs | Revenue |
|---|---|---|
| Energy | 3 | $48B |
|
||
Price history
+324.2% since first listed8 events — show timeline
- 2026-05-08 Relisted — MLSOK
- 2026-01-21 Pending — MLSOK
- 2026-01-10 Listed $140,000 MLSOK
- 2017-03-22 Sold (Public Records) $70,500 Public Records
- 2017-03-21 Sold (MLS) $70,500 MLSOK
- 2017-02-22 Pending — MLSOK
- 2017-02-17 Listed $70,000 MLSOK
- 1992-06-15 Sold (Public Records) $33,000 Public Records
Property tax history
+4.3%/yrLatest (2025): $1,359 · +4.2% YoY. Source: county tax records.
Cash-flow waterfall
monthlySold comps — $/sqft
last 12 mo · ≤1 miLoading sold comps…