38 Emerald Ln · Mamers, NC
Flood risk No data
- FEMA flood zone
- —
- Chance of flooding over 30 yrs
- —
- Est. flood insurance / yr
- —
Fire risk No data
- Est. fire insurance / yr
- —
Heat risk No data
- Hot days now (above threshold)
- —
- Hot days in 30 yrs
- —
Wind risk No data
- Chance of severe wind over 30 yrs
- —
Air-quality risk No data
- Unhealthy air days now
- —
- Unhealthy air days in 30 yrs
- —
Risk factors via First Street. Map © Google.
Why this score? — see what drove the C- grade
The composite is a weighted blend of 9 inputs, each scored 0–100. Each bar is that input's sub-score; the figure is the points it added to the 100-point composite (weight × sub-score).
- Cash flow +21.9/30.0
- DSCR +7.0/10.0
- ARV discount +5.9/15.0
- 1% rule +5.7/10.0
- Livability +3.2/5.0
- Schools +3.0/10.0
- Rent growth +2.5/5.0
- Condition / age +2.5/5.0
- Appreciation +0.0/10.0
$270,000
🖨 Deal sheet 📄 Offer letter ✓ Due diligence
Listing remarks
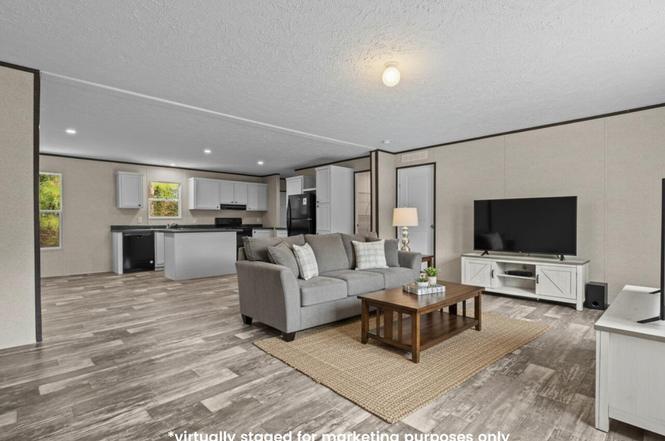
MOTIVATED SELLERS -- BRING YOUR OFFER! Welcome to your slice of country paradise! This brand-new 3-bedroom, 2-bath manufactured home is perfectly situated on nearly 2 acres of unrestricted land, offering the freedom to live exactly how you want. Step inside to an open-concept floor plan filled with natural light, where new blinds throughout add a polished touch to the bright, airy living spaces--ideal for both relaxing and entertaining. Outside, the possibilities are truly endless. You can create your dream lifestyle--whether that's building a workshop, starting a garden, bringing your animals, or simply soaking in the peace, privacy, and wide-open space. Enjoy the perfect blend of modern c
Key facts
- Open floor plan
- Privacy
- Add a garden
Tags
Property features AI
Finance
- Other: Private maintained dirt county road frontage
- HOA & community: No association
Exterior
- Parking: Open parking for 4 vehicles; Driveway with gravel
- Utilities: Public water; Septic tank sewer
- Home design: Manufactured double-wide home; One level; Faces west; Shingle roof
- Construction: Vinyl siding; Built as a manufactured house
- Exterior features: 1.76-acre lot; No pool; No fencing; No additional exterior structures listed
Interior
- Kitchen: Dishwasher; Electric range; Range hood; Refrigerator
- Bedrooms: 3 bedrooms (all on the main level)
- Flooring: Vinyl
- Bathrooms: 2 full bathrooms
- Heating & cooling: Electric forced air heating; Heat pump (heating and cooling); Electric cooling
- Interior features: Open floorplan; Kitchen island; Pantry; Primary bedroom on main level; Walk-in closet(s); Bathtub/shower combination; Laminate countertops; Blinds
- Laundry & utility: Main level laundry room; Washer hookup; Electric dryer hookup; Electric water heater
Neighborhood map
What this means for you Summary
Snapshot
- This is a 3-bed/2.0-bath manufactured listed at $270k.
Deal economics
- At list price, monthly cash flow is $425 ($5k/yr) — positive.
- The deal already cash-flows at list — no discount required.
- Meets the 1% rule at list price ($3k rent vs $270k).
- Recommended offer: $238k (12.0% below list) — sets the bar for market timing.
- Cap rate 8.2% vs local median 2.5% in Mamers — top-decile yield for the area; either an underpriced asset or a hidden risk that comps aren't pricing in. Stress-test before assuming the spread holds.
Location & tenants
- Location reads 63/100 on livability (#391 in NC) — a middle-class / working-renter tenant base. Strengths: cost of living A+, housing A+; Watch: crime C-, health & safety C-, amenities F.
- Harnett County Schools (rural): math 31% / reading 39% proficiency, ranked #130 of 178 in NC (top 73%) — families likely to look elsewhere, expect single-tenant / working-renter base with shorter leases.
- Zoned schools: Western Harnett Middle (math 34% / reading 43%, grade F, #244 of 475 statewide, top 53%, 820 students, 57% FRL); Western Harnett High (math 57% / reading 58%, grade C, #245 of 535 statewide, top 46%, 1,386 students, 60% FRL).
- Zoned-school proficiency averages 48% at this address vs 35% district-wide (+13 pts) — the actual schools serving this property are materially stronger than the Harnett County Schools average implies; a family-tenant draw the district grade alone would hide.
- Market conditions: 80 active listings in the ZIP; 1 comparable units currently listed for rent nearby; 2,080 units permitted in Harnett County in 2024 (12 in 5+ unit buildings).
Forward outlook
- Local home prices are declining (-3.0%/yr); year-one equity from $2k of loan paydown is wiped out by about $8k of value loss. Plan a longer hold.
- Harnett County population projected at +42% by 2050 — long-run rental-demand tailwind backs the buy-and-hold thesis.
Negotiation context
- It's been on market 207 days — a 12% lower offer ($238k) is reasonable based on typical stale-listing flexibility.
Questions for the listing agent
- It's been on market 207 days. Have you received any prior offers? Is the seller open to a 12% concession, seller financing, or rate buy-down credit?
- Why hasn't it sold? Are there any deal-killer items the seller is aware of (foundation, flood, title, zoning, code violations)?
- Is there a deadline driving the sale (1031 exchange, divorce, estate, relocation)? That informs how much negotiation room exists.
- Schools are F-rated, which usually means shorter tenancies and higher turnover. Who's the typical renter profile here, and what's been the actual vacancy rate?
- What's the average days-on-market for RENTAL listings here right now (not sales)? A rising rental-DOM trend means longer vacancies and softer asking-rent achievability than the comps imply.
- What's the recent tenant-quality profile in this submarket — average credit score on applications, eviction rate, late-payment / NSF rate, and stable-employment percentage? A property-management company in the area should have these aggregated.
- How much new for-sale + rental construction is in the pipeline within 1–3 miles? Heavy new supply typically softens prices + rents 12–24 months out; constrained supply supports both.
Investment metrics
- 1% rule
- 1.07% ✓
- Cap rate
- 8.18%
- Cash-on-cash
- 6.75%
- DSCR
- 1.30
- GRM
- 7.8
CMA / ARV
- ARV (on-the-fly)
- $260,520
- Comps found
- 1
Show comp detail 1 sale within ~0.75 mi
| Address | Dist | Beds/Ba | Sqft | Sold | Price | $/sf | Match |
|---|---|---|---|---|---|---|---|
| 38 Emerald Ln | 0.00mi | 3/2.0 | 1,560 (0%) | 0mo | $260,000 | $167 | 100 |
Match score weights: distance 35% · size 25% · config 20% · recency 20%. Top-matched comps best support the ARV.
Projected returns pro-forma
-3.0% appreciation · 3.0% rent growth · sell at horizon
- IRR
- -5.9%
- Equity multiple
- 0.78×
- Total profit
- $-16,634
- Equity at exit
- $40,258
- IRR
- 3.7%
- Equity multiple
- 1.27×
- Total profit
- $20,556
- Equity at exit
- $23,345
Cash invested: $75,600 (down + closing). Projections, not guarantees.
Landlord ↔ Tenant lean methodology
- Overall (STATE)
- 85 Strongly Landlord-Friendly
- State North Carolina
- 85 Strongly Landlord-Friendly · R+3
- County
- — inherits STATE
- City
- — inherits STATE
ZIP-level market 27505
- Home prices YoY
- -6.9%
- Active inventory
- 80
- Price-to-rent
- 7.8×
Monthly cashflow live
- Estimated rent
- $2,900 medium interval (Pro) →
- Mortgage (P&I)
- −$1,416
- Tax est. 1.5%
- −$338 /mo · $4,050/yr
- Insurance
- −$112
- HOA
- −$0
- Vacancy / Maint / Mgmt
- −$609
- Net cashflow
- $425
Break-even live
UW: 25.0% down · 7.5% · 30yr · 1.5% tax · 5.0% vac · 8.0% maint · 8.0% mgmt
Financing live
Cash to close
- Down payment
- $67,500
- Closing costs
- $8,100
- Reserves months
- —
- Total cash needed
- —
Loan-product check · same deal, 3 products live
Conventional
25% down · 7.5% · 30yr
- Down + closing
- —
- Monthly P&I
- —
- Monthly cashflow
- —
- DSCR
- —
- Eligible?
- —
Personal DTI + credit; lowest rate.
DSCR
20% down · 8.5% · 30yr
- Down + closing
- —
- Monthly P&I
- —
- Monthly cashflow
- —
- DSCR
- —
- Eligible?
- —
No personal income docs; deal must DSCR.
Hard money
10% down · 12.0% · 12mo
- Down + closing
- —
- Monthly P&I
- —
- Monthly cashflow
- —
- DSCR
- —
- Eligible?
- —
Short-term bridge; refi at stabilization.
Rent comps 1 comps
| Address | Beds | Baths | Sqft | Rent | $/sqft | DOM | Units | Dist |
|---|---|---|---|---|---|---|---|---|
| 2232 Adcock Rd Lillington, NC | 4.0 | 2.0 | 2143 | $2,900 | $1.35 | 13d | 1 | 1.46mi |
Listing history 6 events
-
2026-05-04status Pending
-
2026-04-21price $270,000
-
2026-03-25price $275,000
-
2026-01-13price $287,900
-
2025-11-07price $289,900
-
2025-10-09$295,000 Active
ⓘ Source: listings_history table (triggers on properties + properties_extension) + one-shot
backfill from property_details.listing_events for pre-trigger history.
Nearby sold comps map
Loading sold comps map…
Walkable amenities ~0.75 mi
Loading nearby amenities…
Taxation est. · year 1
- Rental income
- $34,800
- − Mortgage interest
- −$15,124
- − Property taxes
- −$4,050
- − Insurance
- −$1,350
- − Repairs & maintenance
- −$2,784
- − Management
- −$2,784
- − Depreciation
- −$7,855
- Taxable income
- $853
- Est. tax owed @ 24.0%
- −$205
- After-tax cash flow
- $4,896/yr
For passive investors: Depreciation is non-cash, so a rental often shows a tax loss while cash-flowing — sheltering income. Rental losses are passive: they offset passive income freely, and up to $25,000/yr can offset ordinary (W-2) income if you actively participate and your MAGI is under $100k (phasing out to $0 by $150k); unused losses carry forward. On sale, claimed depreciation is recaptured at up to 25%, and gains may owe capital-gains tax (a 1031 exchange can defer both). Figures are a year-1 estimate at your 24.0% rate — not tax advice; consult a CPA.
Schools (NCES district)
- District
- Harnett County Schools
- NCES district ID
- 3702010
- Math proficiency
- 31% ▼ -2.00%
- Reading proficiency
- 39% ▼ -1.00%
- Median HH income
- $45,400
- Composite
- 29.88/100
- National rank
- #6397
- State rank
- #130 of 178 in NC
Livability — Mamers
- Score
- 63/100
- State rank
- #391
- US rank
- #15191
Category grades
Schools grade is shown separately in the Schools card above.
Census & demographics
- Population (ZIP)
- 7,985
Population outlook (Harnett County) Hauer SSP2
- Today (2025)
- 153,758 people
- By 2030
- 166,581 · +8.3%
- By 2040
- 192,741 · +25.4%
- By 2050
- 218,332 · +42.0%
- By 2075
- 275,422 · +79.1%
- By 2100
- 313,511 · +103.9%
Race, ethnicity, and origin ACS 2023
- Neighborhood character
- Predominantly White (66%)
- Race & ethnicity
- White 66% Hispanic / Latino 20% Black 10% Two or more races 5%
- Hispanic origin (detail)
- Mexican 14% Puerto Rican 3% Dominican 2%
- Common ancestry
- Slovak 3% Serbian 2% Italian 1%
- Foreign-born
- 6% · Canada
- Languages at home
- 87% English-only · Spanish 12%
Political lean MEDSL · Harnett
- 2024 margin
- Strong R (+25.1) · D 36.9% · R 62.0% · Other 1.1%
- 2008→2024 swing
- -8.4pp toward R · 2008: -16.7pp · 2024: -25.1pp
- All cycles
- 2024: R+25.1 2020: R+22.4 2016: R+24.1 2012: R+19.4 2008: R+16.7
Not yet ingested
- Civics
- —
Market trends
- HPI YoY
- ▼ -20.18%
- Current HPI
- 271.7709
- Rent YoY
- —
- Metro
- —
- State GDP YoY
- ▲ 3.28%
- F500 in state
- 26
Industry mix (Fortune 500 HQ in NC)
| Industry | F500 HQs | Revenue |
|---|---|---|
| Financial Services | 2 | $213B |
|
||
| Retail | 2 | $95B |
|
||
| Industrial Conglomerate | 1 | $38B |
|
||
| Metals / Steel | 1 | $35B |
|
||
| Utilities | 1 | $30B |
|
||
| Industrial Machinery | 1 | $19B |
|
||
Price history
-8.5% since first listed6 events — show timeline
- 2026-05-04 Pending — TMLS
- 2026-04-21 Price Changed $270,000 TMLS
- 2026-03-25 Price Changed $275,000 TMLS
- 2026-01-13 Price Changed $287,900 TMLS
- 2025-11-07 Price Changed $289,900 TMLS
- 2025-10-09 Listed $295,000 TMLS
Cash-flow waterfall
monthlySold comps — $/sqft
last 12 mo · ≤1 miLoading sold comps…