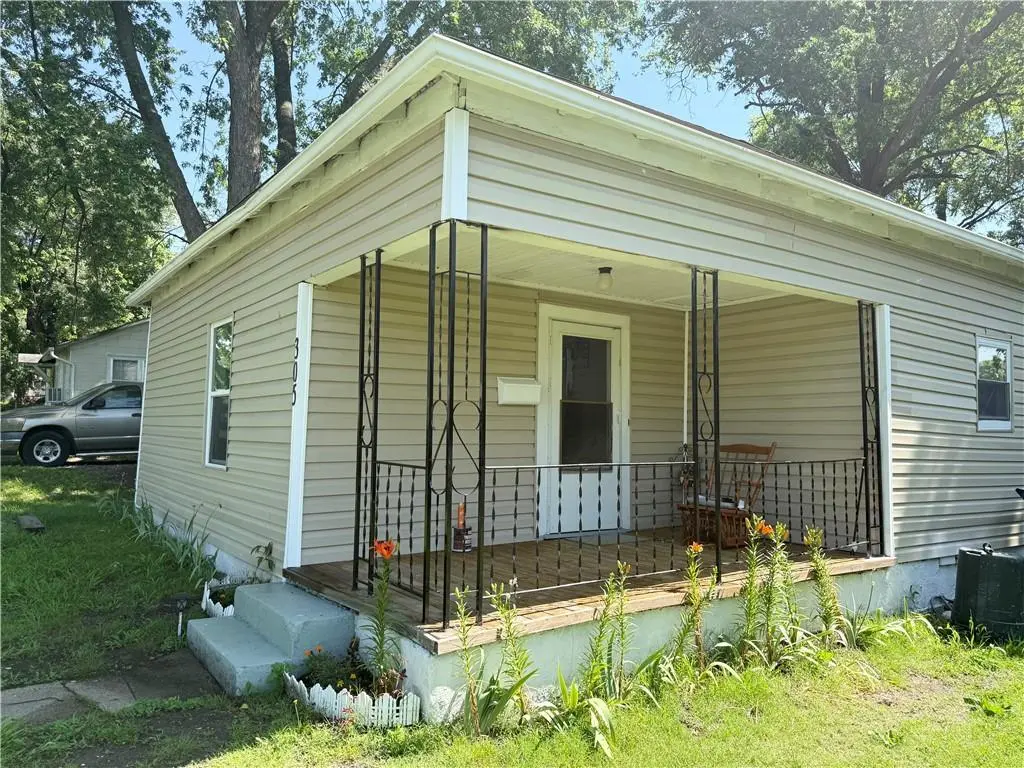
305 S Elm St · Sweet Springs, MO
Flood risk 1/10 · Minimal
- FEMA flood zone
- X (unshaded)
- Chance of flooding over 30 yrs
- 0.0%
- Est. flood insurance / yr
- $507 – $1,088
Fire risk 2/10 · Minimal
- Est. fire insurance / yr
- $1,054 – $1,958
Heat risk 4/10 · Minor
- Hot days now (above 108°F)
- 7 days/yr
- Hot days in 30 yrs
- 17 days/yr
Wind risk 2/10 · Minimal
- Chance of severe wind over 30 yrs
- —
Air-quality risk 2/10 · Minimal
- Unhealthy air days now
- 0 days/yr
- Unhealthy air days in 30 yrs
- 1 days/yr
Risk factors via First Street. Map © Google.
Why this score? — see what drove the C grade
The composite is a weighted blend of 9 inputs, each scored 0–100. Each bar is that input's sub-score; the figure is the points it added to the 100-point composite (weight × sub-score).
- Cash flow +21.6/30.0
- ARV discount +7.5/15.0
- Appreciation +7.0/10.0
- DSCR +6.9/10.0
- 1% rule +4.3/10.0
- Schools +3.5/10.0
- Livability +3.2/5.0
- Rent growth +2.5/5.0
- Condition / age +2.5/5.0
$92,000
🖨 Deal sheet 📄 Offer letter ✓ Due diligence
Listing remarks MLS
This 2-bedroom, 1-bathroom bungalow is waiting for your personal touch. With a brand-new roof installed in 2024, the foundation is set for your vision. Whether you're looking to renovate for resale or create a cozy retreat, this property offers endless potential. Don't miss this opportunity to transform this charming fixer-upper into your dream property.
Key facts
- Rear parking
- Local shopping
- 6,568 sq ft lot
Tags
Property features AI
Finance
- Other: Directions available: I-70 to Exit 66 at Sweet Springs, South on MO-127, Left on Marshall, Right on Elm; property is on the left.
- HOA & community: No association fees
Exterior
- Parking: Off-street parking
- Utilities: Public water; Public sewer
- Home design: Single-family residence; Residential property; Bungalow-style; Living area reported as 807 above-grade finished
- Construction: Block and vinyl siding construction; Composition roof; Estimated age: 76–100 years
- Exterior features: Not in a flood plain; Lot about 6,568 square feet
Interior
- Kitchen: Kitchen on the main level
- Bedrooms: 2 bedrooms (both on the main level)
- Flooring: Carpet in the living room
- Bathrooms: 1 full bathroom (main level)
- Heating & cooling: Natural gas heating; Electric cooling
- Interior features: Bungalow floor plan; Crawl space basement
- Laundry & utility: Main-level laundry room; Main-level utility room
Neighborhood map
What this means for you Summary
Snapshot
- This is a 2-bed/1.0-bath other listed at $92k.
Deal economics
- At list price, monthly cash flow is $140 ($2k/yr) — positive.
- The deal already cash-flows at list — no discount required.
- To meet the 1% rule (rent ≥ 1% of price), the offer needs to be $86k (6.5% below list).
- Recommended offer: $86k (6.5% below list) — sets the bar for 1% rule.
Location & tenants
- Location reads 64/100 on livability (#302 in MO) — a middle-class / working-renter tenant base. Strengths: cost of living A+, housing A+; Watch: employment D+, amenities F, commute F.
- Sweet Springs R-VII (rural): math 37% / reading 45% proficiency, ranked #135 of 324 in MO (top 42%) — families likely to look elsewhere, expect single-tenant / working-renter base with shorter leases.
- Market conditions: 16 active listings in the ZIP; 11 units permitted in Saline County in 2024 (0 in 5+ unit buildings).
Forward outlook
- In year one you build about $4k of equity ($636 loan paydown + $4k appreciation (4.0% local appreciation)).
- Saline County population projected to shrink 7% by 2050 — rents likely to lag national; underwrite the cash flow, not the appreciation.
- At projected returns (4.0% appreciation + 3.0% rent growth), your $26k cash investment doubles in ~4 years — after that, you're playing with house money.
- By year 8, paydown + projected appreciation supports a ~$32k cash-out refi (75% LTV) — recoverable capital for the next deal without selling this one.
Negotiation context
- It's been on market 18 days — a 2% lower offer ($91k) is reasonable based on typical stale-listing flexibility.
- 2 sale attempts; this cycle's ask has dropped $8k (8%) from the opening price — seller is motivated, your offer sets the floor, not the list.
Questions for the listing agent
- Is there a deadline driving the sale (1031 exchange, divorce, estate, relocation)? That informs how much negotiation room exists.
- What's the average days-on-market for RENTAL listings here right now (not sales)? A rising rental-DOM trend means longer vacancies and softer asking-rent achievability than the comps imply.
- What's the recent tenant-quality profile in this submarket — average credit score on applications, eviction rate, late-payment / NSF rate, and stable-employment percentage? A property-management company in the area should have these aggregated.
- How much new for-sale + rental construction is in the pipeline within 1–3 miles? Heavy new supply typically softens prices + rents 12–24 months out; constrained supply supports both.
Investment metrics
- 1% rule
- 0.93% ✗
- Cap rate
- 8.12%
- Cash-on-cash
- 6.52%
- DSCR
- 1.29
- GRM
- 8.9
CMA / ARV
No comps found within radius.
Projected returns pro-forma
4.04% appreciation · 3.0% rent growth · sell at horizon
- IRR
- 16.2%
- Equity multiple
- 1.97×
- Total profit
- $25,115
- Equity at exit
- $46,866
- IRR
- 17.0%
- Equity multiple
- 3.75×
- Total profit
- $70,763
- Equity at exit
- $76,830
Cash invested: $25,760 (down + closing). Projections, not guarantees.
Landlord ↔ Tenant lean methodology
- Overall (STATE)
- 81 Strongly Landlord-Friendly
- State Missouri
- 81 Strongly Landlord-Friendly · R+10
- County
- — inherits STATE
- City
- — inherits STATE
ZIP-level market 65351
- Home prices YoY
- 3.9%
- Active inventory
- 16
- Price-to-rent
- 8.9×
Monthly cashflow live
- Estimated rent
- $860 medium interval (Pro) →
- Mortgage (P&I)
- −$482
- Tax from tax record
- −$19 /mo · $223/yr
- Insurance
- −$38
- HOA
- −$0
- Vacancy / Maint / Mgmt
- −$181
- Net cashflow
- $140
Break-even live
UW: 25.0% down · 7.5% · 30yr · 1.5% tax · 5.0% vac · 8.0% maint · 8.0% mgmt
Financing live
Cash to close
- Down payment
- $23,000
- Closing costs
- $2,760
- Reserves months
- —
- Total cash needed
- —
Loan-product check · same deal, 3 products live
Conventional
25% down · 7.5% · 30yr
- Down + closing
- —
- Monthly P&I
- —
- Monthly cashflow
- —
- DSCR
- —
- Eligible?
- —
Personal DTI + credit; lowest rate.
DSCR
20% down · 8.5% · 30yr
- Down + closing
- —
- Monthly P&I
- —
- Monthly cashflow
- —
- DSCR
- —
- Eligible?
- —
No personal income docs; deal must DSCR.
Hard money
10% down · 12.0% · 12mo
- Down + closing
- —
- Monthly P&I
- —
- Monthly cashflow
- —
- DSCR
- —
- Eligible?
- —
Short-term bridge; refi at stabilization.
Listing history 14 events
-
2026-06-19days on market $92,000 Active 18 DOM
-
2026-06-18days on market $92,000 Active 17 DOM
-
2026-06-17days on market $92,000 Active 16 DOM
-
2026-06-16days on market $92,000 Active 15 DOM
-
2026-06-16price $92,000 Active 14 DOM
-
2026-06-15days on market $99,900 Active 14 DOM
-
2026-06-14days on market $99,900 Active 12 DOM
-
2026-06-12days on market $99,900 Active 11 DOM
-
2026-06-09days on market $99,900 Active 8 DOM
-
2026-06-08days on market $99,900 Active 7 DOM
-
2026-06-07days on market $99,900 Active 6 DOM
-
2026-06-05days on market $99,900 Active 3 DOM
-
2026-06-01remarks 295-char remark
-
2026-06-01$99,900 Active 1 DOM
ⓘ Source: listings_history table (triggers on properties + properties_extension) + one-shot
backfill from property_details.listing_events for pre-trigger history.
Tax reassessment forecast MO · Resets to sale price
- Current annual tax
- $223 · $19/mo
- Projected year-2 tax
- $892 · $74/mo
- Expected delta
- +$669/yr (+$56/mo · 299.4%)
ⓘ Screening estimate from a state-policy table — verify with the county assessor before closing.
Climate risk First Street
- Flood 1/10 Low FEMA zone X (unshaded) · 0% chance over 30 yrs
- Wildfire 2/10 Low
- Heat 4/10 Moderate 7 d/yr ≥108°F today · 17 d/yr by 30 yrs out
- Wind 2/10 Low
- Air quality 2/10 Low 0 unhealthy d/yr today · 1 by 30 yrs out
Nearby sold comps map
Loading sold comps map…
Walkable amenities ~0.75 mi
Loading nearby amenities…
Taxation est. · year 1
- Rental income
- $10,318
- − Mortgage interest
- −$5,153
- − Property taxes
- −$223
- − Insurance
- −$460
- − Repairs & maintenance
- −$825
- − Management
- −$825
- − Depreciation
- −$2,676
- Taxable income
- $154
- Est. tax owed @ 24.0%
- −$37
- After-tax cash flow
- $1,642/yr
For passive investors: Depreciation is non-cash, so a rental often shows a tax loss while cash-flowing — sheltering income. Rental losses are passive: they offset passive income freely, and up to $25,000/yr can offset ordinary (W-2) income if you actively participate and your MAGI is under $100k (phasing out to $0 by $150k); unused losses carry forward. On sale, claimed depreciation is recaptured at up to 25%, and gains may owe capital-gains tax (a 1031 exchange can defer both). Figures are a year-1 estimate at your 24.0% rate — not tax advice; consult a CPA.
Schools (NCES district)
- District
- Sweet Springs R-VII
- NCES district ID
- 2929880
- Math proficiency
- 37% ▼ -14.00%
- Reading proficiency
- 45% ▼ -9.00%
- Median HH income
- $42,522
- Composite
- 34.58/100
- National rank
- #5164
- State rank
- #135 of 324 in MO
Livability — Sweet Springs
- Score
- 64/100
- State rank
- #302
- US rank
- #13860
Category grades
Schools grade is shown separately in the Schools card above.
Census & demographics
- Census place
- Sweet Springs, MO
- Population (ZIP)
- 2,224
Population outlook (Saline County) Hauer SSP2
- Today (2025)
- 22,716 people
- By 2030
- 22,343 · -1.6%
- By 2040
- 21,596 · -4.9%
- By 2050
- 21,171 · -6.8%
- By 2075
- 20,680 · -9.0%
- By 2100
- 20,147 · -11.3%
Race, ethnicity, and origin ACS 2023
- Neighborhood character
- Predominantly White (91%)
- Race & ethnicity
- White 91% Two or more races 5% Hispanic / Latino 3% Asian 2%
- Common ancestry
- Romanian 4% Italian 2% Slovak 2%
- Foreign-born
- 1%
- Languages at home
- 97% English-only · Spanish 2% Other Asian/Pacific 1%
Political lean MEDSL · Saline
- 2024 margin
- Solid R (+40.4) · D 29.2% · R 69.7% · Other 1.1%
- 2008→2024 swing
- -37.9pp toward R · 2008: -2.5pp · 2024: -40.4pp
- All cycles
- 2024: R+40.4 2020: R+37.3 2016: R+34.5 2012: R+14.4 2008: R+2.5
Not yet ingested
- Civics
- —
Market trends
- HPI YoY
- ▲ 4.04%
- Current HPI
- 107.2676
- Rent YoY
- —
- Metro
- —
- State GDP YoY
- ▲ 1.84%
- F500 in state
- 20
Industry mix (Fortune 500 HQ in MO)
| Industry | F500 HQs | Revenue |
|---|---|---|
| Healthcare | 1 | $163B |
|
||
| Insurance | 1 | $21B |
|
||
| Industrial Technology | 1 | $17B |
|
||
| Retail | 1 | $16B |
|
||
| Industrial Distribution | 1 | $10B |
|
||
| Utilities | 1 | $9B |
|
||
Price history
+122.0% since first listed6 events — show timeline
- 2026-06-01 Listed $99,900 Heartland MLS as Distributed by MLS Grid
- 2025-06-24 Sold (Public Records) — Public Records
- 2025-06-23 Sold (MLS) — Heartland MLS as Distributed by MLS Grid
- 2025-05-21 Pending — Heartland MLS as Distributed by MLS Grid
- 2025-05-15 Price Changed $35,000 Heartland MLS as Distributed by MLS Grid
- 2025-04-11 Listed $45,000 Heartland MLS as Distributed by MLS Grid
Property tax history
+5.7%/yrLatest (2025): $223 · +10.3% YoY. Source: county tax records.
Cash-flow waterfall
monthlySold comps — $/sqft
last 12 mo · ≤1 miLoading sold comps…