9622 Kewanee Rd · Richfield, MI
Flood risk 4/10 · Minor
- FEMA flood zone
- X (unshaded)
- Chance of flooding over 30 yrs
- 0.22%
- Est. flood insurance / yr
- $473 – $860
Fire risk 5/10 · Moderate
- Est. fire insurance / yr
- $784 – $1,456
Heat risk 1/10 · Minimal
- Hot days now (above 92°F)
- 7 days/yr
- Hot days in 30 yrs
- 13 days/yr
Wind risk 1/10 · Minimal
- Chance of severe wind over 30 yrs
- —
Air-quality risk 2/10 · Minimal
- Unhealthy air days now
- 0 days/yr
- Unhealthy air days in 30 yrs
- 1 days/yr
Risk factors via First Street. Map © Google.
Why this score? — see what drove the B- grade
The composite is a weighted blend of 9 inputs, each scored 0–100. Each bar is that input's sub-score; the figure is the points it added to the 100-point composite (weight × sub-score).
- Cash flow +30.0/30.0
- DSCR +10.0/10.0
- 1% rule +8.9/10.0
- ARV discount +7.5/15.0
- Schools +3.1/10.0
- Rent growth +2.5/5.0
- Livability +2.5/5.0
- Condition / age +2.5/5.0
- Appreciation +0.0/10.0
$59,900
🖨 Deal sheet 📄 Offer letter ✓ Due diligence
Listing remarks
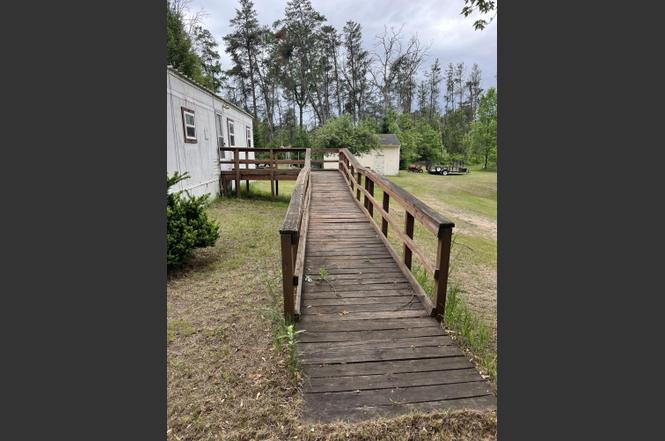
Looking for your Up North getaway? This well-maintained mobile home sits on approximately 1 acre in the heart of St. Helen, offering plenty of room to enjoy the outdoors. The property features a spacious garage, perfect for storing vehicles, toys, tools, or all your Up North gear. Whether you're looking for a year-round residence, weekend retreat, or investment opportunity, this property has endless potential. Located just minutes from some of Michigan's most popular ORV trails and riding areas, you'll love the convenience of jumping on the trails and exploring miles of adventure right from the area. The St. Helen trail system connects to multiple ORV routes and riding areas, making it a pr
Key facts
- Approximately 1 acre
- Popular orv trails
- Spacious garage
Tags
Property features AI
Exterior
- Parking: Detached 2-car garage
- Utilities: Well water; Septic tank sewer
- Home design: Single-family residence; Residential property
- Construction: Pillar/Post/Pier foundation
- Exterior features: Deck
Interior
- Kitchen: Includes refrigerator, oven and range
- Bathrooms: 1 full bathroom
- Heating & cooling: Wall furnace heating
- Interior features: Dryer, Washer, Refrigerator, Oven, Range
- Laundry & utility: Main level laundry; Dryer and washer included
Neighborhood map
What this means for you Summary
Snapshot
- This is a 2-bed/1.0-bath manufactured listed at $60k.
Deal economics
- At list price, monthly cash flow is $261 ($3k/yr) — positive.
- The deal already cash-flows at list — no discount required.
- Meets the 1% rule at list price ($832 rent vs $60k).
Location & tenants
- Location reads: area grade B — affects rentability + tenant quality, not the cash-flow math above.
- Roscommon Area Public Schools (rural): math 30% / reading 44% proficiency, ranked #270 of 540 in MI (top 50%) — families likely to look elsewhere, expect single-tenant / working-renter base with shorter leases.
- Market conditions: 73 active listings in the ZIP; 73 units permitted in Roscommon County in 2024 (0 in 5+ unit buildings).
Forward outlook
- Local home prices are declining (-3.0%/yr); year-one equity from $414 of loan paydown is wiped out by about $2k of value loss. Plan a longer hold.
- Roscommon County population projected at -21% by 2050 — secular population decline; favor cash flow + early exit over multi-decade hold.
- At projected returns (-3.0% appreciation + 3.0% rent growth), your $17k cash investment doubles in ~7 years — after that, you're playing with house money.
Negotiation context
- Only 3 days on market — expect competitive offers; lowballing is unlikely to land.
- Current owner paid $20k; list at $60k implies a 201% gain — meaningful room to come down on a strong offer.
Risks & watch-outs
- Climate carrying-cost: moderate wildfire risk — expect insurance premiums to compound above CPI over the hold.
Questions for the listing agent
- Built in 1972 — when were the roof, HVAC, electrical panel, plumbing, and water heater last replaced?
- Is there a deadline driving the sale (1031 exchange, divorce, estate, relocation)? That informs how much negotiation room exists.
- What's the average days-on-market for RENTAL listings here right now (not sales)? A rising rental-DOM trend means longer vacancies and softer asking-rent achievability than the comps imply.
- What's the recent tenant-quality profile in this submarket — average credit score on applications, eviction rate, late-payment / NSF rate, and stable-employment percentage? A property-management company in the area should have these aggregated.
- How much new for-sale + rental construction is in the pipeline within 1–3 miles? Heavy new supply typically softens prices + rents 12–24 months out; constrained supply supports both.
Investment metrics
- 1% rule
- 1.39% ✓
- Cap rate
- 11.52%
- Cash-on-cash
- 18.65%
- DSCR
- 1.83
- GRM
- 6.0
CMA / ARV
No comps found within radius.
Projected returns pro-forma
-3.0% appreciation · 3.0% rent growth · sell at horizon
- IRR
- 10.4%
- Equity multiple
- 1.41×
- Total profit
- $6,899
- Equity at exit
- $8,931
- IRR
- 19.5%
- Equity multiple
- 2.63×
- Total profit
- $27,395
- Equity at exit
- $5,179
Cash invested: $16,772 (down + closing). Projections, not guarantees.
Landlord ↔ Tenant lean methodology
- Overall (STATE)
- 62 Landlord-Friendly
- State Michigan
- 62 Landlord-Friendly · EVEN
- County
- — inherits STATE
- City
- — inherits STATE
ZIP-level market 48656
- Home prices YoY
- -8.6%
- Active inventory
- 73
- Price-to-rent
- 6.0×
Monthly cashflow live
- Estimated rent
- $832 medium interval (Pro) →
- Mortgage (P&I)
- −$314
- Tax from tax record
- −$57 /mo · $688/yr
- Insurance
- −$25
- HOA
- −$0
- Vacancy / Maint / Mgmt
- −$175
- Net cashflow
- $261
Break-even live
UW: 25.0% down · 7.5% · 30yr · 1.5% tax · 5.0% vac · 8.0% maint · 8.0% mgmt
Financing live
Cash to close
- Down payment
- $14,975
- Closing costs
- $1,797
- Reserves months
- —
- Total cash needed
- —
Loan-product check · same deal, 3 products live
Conventional
25% down · 7.5% · 30yr
- Down + closing
- —
- Monthly P&I
- —
- Monthly cashflow
- —
- DSCR
- —
- Eligible?
- —
Personal DTI + credit; lowest rate.
DSCR
20% down · 8.5% · 30yr
- Down + closing
- —
- Monthly P&I
- —
- Monthly cashflow
- —
- DSCR
- —
- Eligible?
- —
No personal income docs; deal must DSCR.
Hard money
10% down · 12.0% · 12mo
- Down + closing
- —
- Monthly P&I
- —
- Monthly cashflow
- —
- DSCR
- —
- Eligible?
- —
Short-term bridge; refi at stabilization.
Listing history 4 events
-
2026-06-18days on market $59,900 Active 3 DOM
-
2026-06-17days on market $59,900 Active 2 DOM
-
2026-06-16remarks 699-char remark
-
2026-06-16$59,900 Active 1 DOM
ⓘ Source: listings_history table (triggers on properties + properties_extension) + one-shot
backfill from property_details.listing_events for pre-trigger history.
Tax reassessment forecast MI · Partial reset (capped growth)
- Current annual tax
- $688 · $57/mo
- Projected year-2 tax
- $805 · $67/mo
- Expected delta
- +$117/yr (+$10/mo · 17.0%)
ⓘ Screening estimate from a state-policy table — verify with the county assessor before closing.
Climate risk First Street
- Flood 4/10 Moderate FEMA zone X (unshaded) · 22% chance over 30 yrs
- Wildfire 5/10 Major
- Heat 1/10 Low 7 d/yr ≥92°F today · 13 d/yr by 30 yrs out
- Wind 1/10 Low
- Air quality 2/10 Low 0 unhealthy d/yr today · 1 by 30 yrs out
Nearby sold comps map
Loading sold comps map…
Walkable amenities ~0.75 mi
Loading nearby amenities…
Taxation est. · year 1
- Rental income
- $9,982
- − Mortgage interest
- −$3,355
- − Property taxes
- −$688
- − Insurance
- −$300
- − Repairs & maintenance
- −$799
- − Management
- −$799
- − Depreciation
- −$1,743
- Taxable income
- $2,299
- Est. tax owed @ 24.0%
- −$552
- After-tax cash flow
- $2,577/yr
For passive investors: Depreciation is non-cash, so a rental often shows a tax loss while cash-flowing — sheltering income. Rental losses are passive: they offset passive income freely, and up to $25,000/yr can offset ordinary (W-2) income if you actively participate and your MAGI is under $100k (phasing out to $0 by $150k); unused losses carry forward. On sale, claimed depreciation is recaptured at up to 25%, and gains may owe capital-gains tax (a 1031 exchange can defer both). Figures are a year-1 estimate at your 24.0% rate — not tax advice; consult a CPA.
Schools (NCES district)
- District
- Roscommon Area Public Schools
- NCES district ID
- 2615830
- Math proficiency
- 30% ▼ -11.00%
- Reading proficiency
- 44% ▼ -2.00%
- Median HH income
- $36,914
- Composite
- 30.7/100
- National rank
- #6172
- State rank
- #270 of 540 in MI
Livability — Richfield
No livability data for this city. (Only ~50 U.S. cities are tracked.)
Census & demographics
- Census place
- St. Helen, MI
- Population (ZIP)
- 3,872
Population outlook (Roscommon County) Hauer SSP2
- Today (2025)
- 22,249 people
- By 2030
- 21,206 · -4.7%
- By 2040
- 19,070 · -14.3%
- By 2050
- 17,564 · -21.1%
- By 2075
- 15,420 · -30.7%
- By 2100
- 13,168 · -40.8%
Race, ethnicity, and origin ACS 2023
- Neighborhood character
- Predominantly White (91%)
- Race & ethnicity
- White 91% Two or more races 4% Hispanic / Latino 2% Black 1% Asian 1%
- Common ancestry
- Lithuanian 7% Romanian 7% Slovak 3%
- Foreign-born
- 2% · China
- Languages at home
- 97% English-only · Spanish 1% Chinese 1% German/W. Germanic 1%
Political lean MEDSL · Roscommon
- 2024 margin
- Solid R (+32.9) · D 32.9% · R 65.9% · Other 1.2%
- 2008→2024 swing
- -35.5pp toward R · 2008: 2.5pp · 2024: -32.9pp
- All cycles
- 2024: R+32.9 2020: R+30.0 2016: R+29.6 2012: R+3.9 2008: D+2.5
Not yet ingested
- Civics
- —
Market trends
- HPI YoY
- ▼ -29.98%
- Current HPI
- 319.603
- Rent YoY
- —
- Metro
- —
- State GDP YoY
- ▲ 1.37%
- F500 in state
- 28
Industry mix (Fortune 500 HQ in MI)
| Industry | F500 HQs | Revenue |
|---|---|---|
| Automotive Parts | 3 | $48B |
|
||
| Automotive | 2 | $372B |
|
||
| Chemicals | 1 | $45B |
|
||
| Automotive Retail | 1 | $29B |
|
||
| Healthcare / Medical Devices | 1 | $23B |
|
||
| Automotive Technology | 1 | $20B |
|
||
Price history
+201.0% since first listed2 events — show timeline
- 2026-06-14 Listed $59,900 WWMLS
- 2011-01-11 Sold (Public Records) $19,900 Public Records
Property tax history
-0.8%/yrLatest (2025): $688 · -10.6% YoY. Source: county tax records.
Cash-flow waterfall
monthlySold comps — $/sqft
last 12 mo · ≤1 miLoading sold comps…