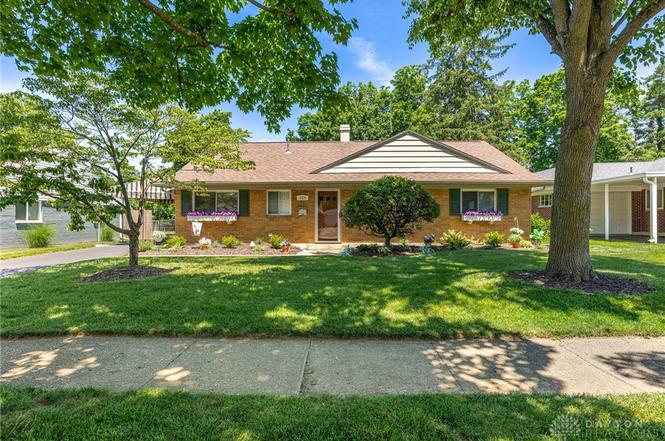
639 Brookfield Rd · Kettering, OH
Flood risk 1/10 · Minimal
- FEMA flood zone
- X (unshaded)
- Chance of flooding over 30 yrs
- 0.0%
- Est. flood insurance / yr
- $507 – $1,088
Fire risk 1/10 · Minimal
- Est. fire insurance / yr
- $713 – $1,323
Heat risk 3/10 · Minor
- Hot days now (above 100°F)
- 7 days/yr
- Hot days in 30 yrs
- 18 days/yr
Wind risk 2/10 · Minimal
- Chance of severe wind over 30 yrs
- 0.0%
Air-quality risk 3/10 · Minor
- Unhealthy air days now
- 3 days/yr
- Unhealthy air days in 30 yrs
- 5 days/yr
Risk factors via First Street. Map © Google.
Why this score? — see what drove the D grade
The composite is a weighted blend of 9 inputs, each scored 0–100. Each bar is that input's sub-score; the figure is the points it added to the 100-point composite (weight × sub-score).
- Cash flow +12.3/30.0
- ARV discount +10.0/15.0
- Schools +5.2/10.0
- Livability +4.2/5.0
- DSCR +3.7/10.0
- 1% rule +3.6/10.0
- Rent growth +2.5/5.0
- Condition / age +2.5/5.0
- Appreciation +0.0/10.0
$220,000
🖨 Deal sheet 📄 Offer letter ✓ Due diligence
Listing remarks
Wowza, this picture perfect brick ranch is sure to please. The owner has meticulously maintained this lovely home. The open floor plan and large picture windows make this home bright and cheery, everyday. The kitchen features loads of cabinet space and solid surface countertops. Many updates and improvements include: roof shingles 2017, water heater 2020, microwave 2020, HVAC system 2021, storage barn and awning. Relax on you rear deck while over looking the park like fenced yard. All of the appliances convey. This property will not disapoint. Conveniently located near shopping, restaraunts, schools, parks and much more.
Key facts
- Open floorplan
- Appliances convey
- Brick ranch
Tags
Property features AI
Finance
- Financial info: Offered for sale
Exterior
- Parking: Carport
- Utilities: Public water; Sewer available; Natural gas available
- Home design: One-story brick home; Slab foundation
- Construction: Brick construction
- Exterior features: Lot dimensions approximately 59 x 153 x 59 x 153; Residential zoning
Interior
- Kitchen: Kitchen on the main level (9 x 8)
- Bedrooms: Three bedrooms on the main level (10 x 10; 12 x 11; 12 x 11)
- Bathrooms: One full bathroom; One half bathroom; Two bathrooms on the main level
- Heating & cooling: Central air conditioning; Forced air heating; Natural gas heating
- Interior features: Entry/foyer; Living room; Dining room; Breakfast nook; Total of 9 rooms
- Laundry & utility: Main-level laundry room (7 x 6)
Neighborhood map
What this means for you Summary
Snapshot
- This is a 3-bed/1.5-bath single-family listed at $220k.
Deal economics
- At list price, monthly cash flow is $-40 ($-479/yr) — negative.
- To cash-flow at today's rent, offer at most $213k (3.2% below list).
- To meet the 1% rule (rent ≥ 1% of price), the offer needs to be $189k (14.3% below list).
- Recommended offer: $189k (14.3% below list) — sets the bar for 1% rule.
- Cap rate 6.1% vs local median 4.4% in Kettering — top-decile yield for the area; either an underpriced asset or a hidden risk that comps aren't pricing in. Stress-test before assuming the spread holds.
Location & tenants
- Location reads 83/100 on livability (#61 in OH, #922 nationally) — a professional / high-income tenant draw. Strengths: schools A+, crime A+, cost of living A+; Watch: commute F.
- Kettering City School District (suburban): math 54% / reading 68% proficiency, ranked #277 of 656 in OH (top 42%) — acceptable for families but not a draw, mixed tenant base, ~2y average lease.
- Market conditions: 81 active listings in the ZIP; 14 comparable units currently listed for rent nearby; rentals leasing fast (median 12d on market — plan ~1-2 weeks tenant-placement turnaround); solid renter incomes; 907 units permitted in Montgomery County in 2024 (416 in 5+ unit buildings).
Forward outlook
- Local home prices are declining (-3.0%/yr); year-one equity from $2k of loan paydown is wiped out by about $7k of value loss. Plan a longer hold.
- Montgomery County population projected at -10% by 2050 — secular population decline; favor cash flow + early exit over multi-decade hold.
Negotiation context
- Only 2 days on market — expect competitive offers; lowballing is unlikely to land.
- Current owner paid $48k; list at $220k implies a 354% gain — meaningful room to come down on a strong offer.
Risks & watch-outs
- Watch-outs: built in 1952 — expect roof / HVAC / electrical / plumbing capex.
Questions for the listing agent
- What do current leases actually rent for vs. the listed asking? Can we see a recent rent roll and the last 12 months of T-12 income?
- Built in 1952 — when were the roof, HVAC, electrical panel, plumbing, and water heater last replaced?
- Is there a deadline driving the sale (1031 exchange, divorce, estate, relocation)? That informs how much negotiation room exists.
- Schools are A-rated — typically a magnet for longer-tenancy family renters. What's the average tenant stay here, and is there a school-zone premium baked into asking?
- The area grade is low — what's the realistic commute time and amenity access for the typical tenant pool here? Any planned neighborhood developments (good or bad) we should know about?
- What's the average days-on-market for RENTAL listings here right now (not sales)? A rising rental-DOM trend means longer vacancies and softer asking-rent achievability than the comps imply.
- What's the recent tenant-quality profile in this submarket — average credit score on applications, eviction rate, late-payment / NSF rate, and stable-employment percentage? A property-management company in the area should have these aggregated.
- How much new for-sale + rental construction is in the pipeline within 1–3 miles? Heavy new supply typically softens prices + rents 12–24 months out; constrained supply supports both.
Investment metrics
- 1% rule
- 0.86% ✗
- Cap rate
- 6.08%
- Cash-on-cash
- -0.78%
- DSCR
- 0.97
- GRM
- 9.7
CMA / ARV
- ARV (on-the-fly)
- $233,189
- Comps found
- 12
Show comp detail 12 sales within ~0.75 mi
| Address | Dist | Beds/Ba | Sqft | Sold | Price | $/sf | Match |
|---|---|---|---|---|---|---|---|
| 629 Storms Rd | 0.08mi | 3/1.5 | 1,247 (0%) | 1mo | $255,000 | $204 | 96 |
| 639 Storms Rd | 0.07mi | 3/2.0 | 1,286 (+3%) | 1mo | $235,000 | $183 | 88 |
| 639 Rockhill Ave | 0.44mi | 3/2.0 | 1,260 (+1%) | 2mo | $275,000 | $218 | 74 |
| 3854 Shroyer Rd | 0.29mi | 2/1.0 (-1) | 1,196 (-4%) | 2mo | $220,000 | $184 | 71 |
| 861 Gardner Rd | 0.28mi | 3/1.0 | 1,152 (-8%) | 3mo | $230,000 | $200 | 70 |
| 614 Lamont Dr | 0.50mi | 2/1.0 (-1) | 1,239 (-1%) | 2mo | $232,000 | $187 | 67 |
| 516 Oakview Dr | 0.34mi | 3/1.0 | 1,138 (-9%) | 3mo | $230,000 | $202 | 65 |
| 4008 Ackerman Blvd | 0.49mi | 3/1.0 | 1,325 (+6%) | 2mo | $242,500 | $183 | 63 |
| 3209 Carrier Ave | 0.58mi | 3/1.0 | 1,204 (-3%) | 2mo | $215,000 | $179 | 63 |
| 3826 California Ave | 0.22mi | 2/1.0 (-1) | 1,104 (-12%) | 3mo | $195,602 | $177 | 61 |
| 812 Hollendale Dr | 0.62mi | 3/1.0 | 1,340 (+8%) | 0mo | $250,000 | $187 | 56 |
| 1138 Sharon Ave | 0.72mi | 3/1.0 | 1,100 (-12%) | 3mo | $225,000 | $205 | 43 |
Match score weights: distance 35% · size 25% · config 20% · recency 20%. Top-matched comps best support the ARV.
Projected returns pro-forma
-3.0% appreciation · 3.0% rent growth · sell at horizon
- IRR
- -17.6%
- Equity multiple
- 0.38×
- Total profit
- $-38,158
- Equity at exit
- $32,803
- IRR
- -9.6%
- Equity multiple
- 0.41×
- Total profit
- $-36,362
- Equity at exit
- $19,022
Cash invested: $61,600 (down + closing). Projections, not guarantees.
Landlord ↔ Tenant lean methodology
- Overall (STATE)
- 73 Landlord-Friendly
- State Ohio
- 73 Landlord-Friendly · R+6
- County
- — inherits STATE
- City
- — inherits STATE
ZIP-level market 45429
- Active inventory
- 81
- Price-to-rent
- 9.7×
Monthly cashflow live
- Estimated rent
- $1,886 high interval (Pro) →
- Mortgage (P&I)
- −$1,154
- Tax from tax record
- −$284 /mo · $3,413/yr
- Insurance
- −$92
- HOA
- −$0
- Vacancy / Maint / Mgmt
- −$396
- Net cashflow
- $-40
Break-even live
UW: 25.0% down · 7.5% · 30yr · 1.5% tax · 5.0% vac · 8.0% maint · 8.0% mgmt
Financing live
Cash to close
- Down payment
- $55,000
- Closing costs
- $6,600
- Reserves months
- —
- Total cash needed
- —
Loan-product check · same deal, 3 products live
Conventional
25% down · 7.5% · 30yr
- Down + closing
- —
- Monthly P&I
- —
- Monthly cashflow
- —
- DSCR
- —
- Eligible?
- —
Personal DTI + credit; lowest rate.
DSCR
20% down · 8.5% · 30yr
- Down + closing
- —
- Monthly P&I
- —
- Monthly cashflow
- —
- DSCR
- —
- Eligible?
- —
No personal income docs; deal must DSCR.
Hard money
10% down · 12.0% · 12mo
- Down + closing
- —
- Monthly P&I
- —
- Monthly cashflow
- —
- DSCR
- —
- Eligible?
- —
Short-term bridge; refi at stabilization.
Rent comps 14 comps
| Address | Beds | Baths | Sqft | Rent | $/sqft | DOM | Units | Dist |
|---|---|---|---|---|---|---|---|---|
| 508 Schuyler Dr Dayton, OH | 3.0 | 1.0 | 1120 | $2,075 | $1.85 | 3d | 1 | 0.21mi |
| 521 Oakview Dr Dayton, OH | 4.0 | 2.0 | 1404 | $1,995 | $1.42 | 44d | 1 | 0.29mi |
| 562 East Dr Dayton, OH | 2.0 | 1.0 | 1218 | $950 | $0.78 | 3d | 1 | 0.77mi |
| 4421 Grayson St Dayton, OH | 3.0 | 1.0 | 1040 | $1,745 | $1.68 | 23d | 1 | 0.85mi |
| 563 Broad Blvd Dayton, OH | 3.0 | 2.0 | 1410 | $2,100 | $1.49 | 11d | 1 | 0.90mi |
| 2820 Harvey Ave Dayton, OH | 2.0 | 1.0 | 900 | $1,350 | $1.50 | 44d | 1 | 0.90mi |
| 301 Henrich Dr Dayton, OH | 3.0 | 1.0 | 1040 | $1,745 | $1.68 | 3d | 1 | 0.96mi |
| 401 Orangewood Dr Dayton, OH | 3.0 | 1.0 | 1040 | $1,745 | $1.68 | 44d | 1 | 0.99mi |
| 253 Peach Orchard Ave Oakwood, OH | 3.0 | 2.0 | 1236 | $2,075 | $1.68 | 44d | 1 | 1.22mi |
| 2105 Shroyer Rd Oakwood, OH | 3.0 | 2.0 | 1453 | $2,150 | $1.48 | 3d | 1 | 1.23mi |
| 4354 Meadowcroft Rd Dayton, OH | 3.0 | 1.5 | 1155 | $1,600 | $1.39 | 3d | 1 | 1.24mi |
| 1532 Lynnfield Dr Unit 1530 Kettering, OH | 2.0 | 1.0 | 1000 | $1,450 | $1.45 | 23d | 1 | 1.25mi |
| 1901 Shroyer Rd Oakwood, OH | 2.0 | 2.0 | 1262 | $2,000 | $1.58 | 3d | 1 | 1.36mi |
| 3970 Parliament Pl Dayton, OH | 1.0–2.0 | 1.0 | 774 | $1,040 | $1.34 | 3d | 3 | 1.45mi |
Listing history 4 events
-
2026-06-18status $220,000 Pending 2 DOM
-
2026-06-17days on market $220,000 Active 2 DOM
-
2026-06-15remarks 629-char remark
-
2026-06-15$220,000 Active 1 DOM
ⓘ Source: listings_history table (triggers on properties + properties_extension) + one-shot
backfill from property_details.listing_events for pre-trigger history.
Tax reassessment forecast OH · Partial reset (capped growth)
- Current annual tax
- $3,413 · $284/mo
- Projected year-2 tax
- $3,423 · $285/mo
- Expected delta
- +$9/yr (+$1/mo · 0.3%)
ⓘ Screening estimate from a state-policy table — verify with the county assessor before closing.
Climate risk First Street
- Flood 1/10 Low FEMA zone X (unshaded) · 0% chance over 30 yrs
- Wildfire 1/10 Low
- Heat 3/10 Moderate 7 d/yr ≥100°F today · 18 d/yr by 30 yrs out
- Wind 2/10 Low 0% chance of damaging wind over 30 yrs
- Air quality 3/10 Moderate 3 unhealthy d/yr today · 5 by 30 yrs out
Nearby sold comps map
Loading sold comps map…
Walkable amenities ~0.75 mi
Loading nearby amenities…
Taxation est. · year 1
- Rental income
- $22,631
- − Mortgage interest
- −$12,323
- − Property taxes
- −$3,413
- − Insurance
- −$1,100
- − Repairs & maintenance
- −$1,811
- − Management
- −$1,811
- − Depreciation
- −$6,400
- Taxable loss
- −$4,226
- Est. tax savings @ 24.0%
- +$1,014
- After-tax cash flow
- $535/yr
For passive investors: Depreciation is non-cash, so a rental often shows a tax loss while cash-flowing — sheltering income. Rental losses are passive: they offset passive income freely, and up to $25,000/yr can offset ordinary (W-2) income if you actively participate and your MAGI is under $100k (phasing out to $0 by $150k); unused losses carry forward. On sale, claimed depreciation is recaptured at up to 25%, and gains may owe capital-gains tax (a 1031 exchange can defer both). Figures are a year-1 estimate at your 24.0% rate — not tax advice; consult a CPA.
Schools (NCES district)
- District
- Kettering City School District
- NCES district ID
- 3904418
- Math proficiency
- 54% ▼ -21.00%
- Reading proficiency
- 68% ▼ -9.00%
- Median HH income
- $50,353
- Composite
- 51.89/100
- National rank
- #1653
- State rank
- #277 of 656 in OH
Livability — Kettering
- Score
- 83/100
- State rank
- #61
- US rank
- #922
Category grades
Schools grade is shown separately in the Schools card above.
Census & demographics
- Census place
- Kettering, OH
- County
- Montgomery County · 459,541 people
- City population
- 73,116
- Metro
- Dayton-Kettering, OH
- Population (ZIP)
- 26,347
- Household income
- $80,210
- Rent vs Own
- Severe rent burden
- 889.0
Population outlook (Montgomery County) Hauer SSP2
- Today (2025)
- 523,241 people
- By 2030
- 514,948 · -1.6%
- By 2040
- 493,378 · -5.7%
- By 2050
- 469,639 · -10.2%
- By 2075
- 418,360 · -20.0%
- By 2100
- 353,315 · -32.5%
Race, ethnicity, and origin ACS 2023
- Neighborhood character
- Predominantly White (86%)
- Race & ethnicity
- White 86% Two or more races 5% Black 5% Hispanic / Latino 3% Asian 2%
- Common ancestry
- Italian 3% Lithuanian 3% Slovak 2%
- Foreign-born
- 5% · Canada, China
- Languages at home
- 95% English-only · Spanish 2% Arabic 1%
Political lean MEDSL · Montgomery
- 2024 margin
- Toss-up / Even · D 49.8% · R 49.3%
- 2008→2024 swing
- -5.8pp toward R · 2008: 6.2pp · 2024: 0.5pp
- All cycles
- 2024: D+0.5 2020: D+2.2 2016: R+1.2 2012: D+3.1 2008: D+6.2
Not yet ingested
- Civics
- —
Market trends
- HPI YoY
- ▼ -172.24%
- Current HPI
- 274.1505
- Rent YoY
- —
- Metro
- Dayton-Kettering, OH
- State GDP YoY
- ▲ 1.98%
- F500 in state
- 48
Industry mix (Fortune 500 HQ in OH)
| Industry | F500 HQs | Revenue |
|---|---|---|
| Insurance | 3 | $145B |
|
||
| Industrial Machinery | 3 | $49B |
|
||
| Financial Services | 3 | $24B |
|
||
| Consumer Goods | 2 | $93B |
|
||
| Aerospace / Defense | 2 | $47B |
|
||
| Utilities | 2 | $33B |
|
||
Price history
+394.4% since first listed4 events — show timeline
- 2026-06-13 Listed $220,000 Dayton MLS
- 2005-04-29 Sold (Public Records) $48,500 Public Records
- 1988-12-02 Sold (Public Records) $58,500 Public Records
- 1986-11-17 Sold (Public Records) $44,500 Public Records
Property tax history
+2.7%/yrLatest (2025): $3,413 · -0.2% YoY. Source: county tax records.
Cash-flow waterfall
monthlySold comps — $/sqft
last 12 mo · ≤1 miLoading sold comps…