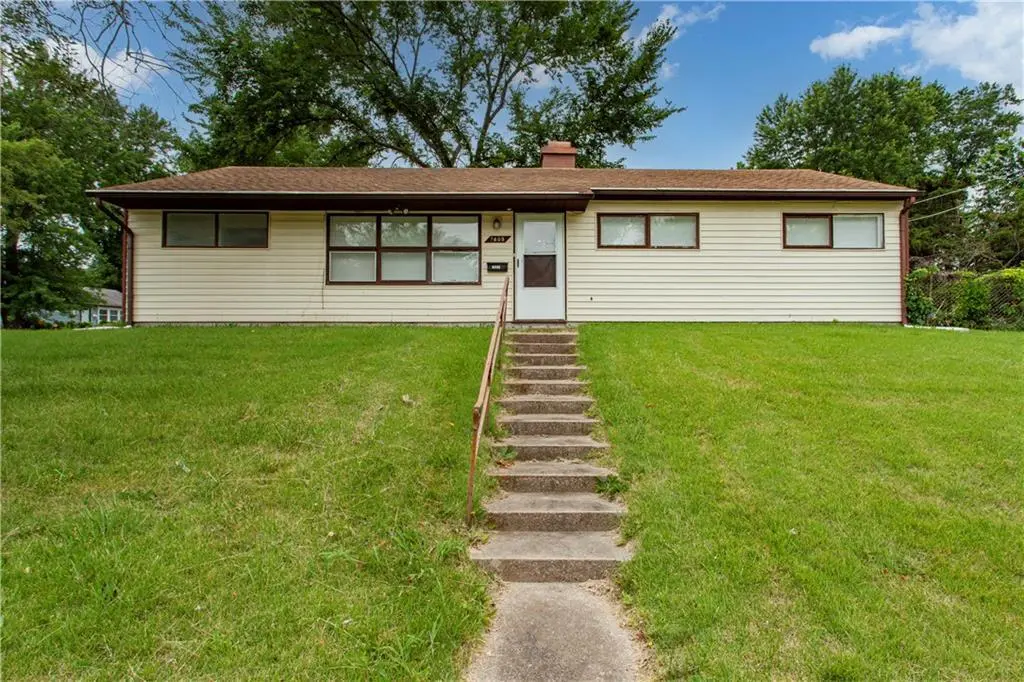
7805 E 114th St · Kansas City, MO
Flood risk 1/10 · Minimal
- FEMA flood zone
- X (unshaded)
- Chance of flooding over 30 yrs
- 0.0%
- Est. flood insurance / yr
- $507 – $1,088
Fire risk 1/10 · Minimal
- Est. fire insurance / yr
- $1,054 – $1,958
Heat risk 4/10 · Minor
- Hot days now (above 107°F)
- 7 days/yr
- Hot days in 30 yrs
- 17 days/yr
Wind risk 2/10 · Minimal
- Chance of severe wind over 30 yrs
- —
Air-quality risk 3/10 · Minor
- Unhealthy air days now
- 3 days/yr
- Unhealthy air days in 30 yrs
- 3 days/yr
Risk factors via First Street. Map © Google.
Why this score? — see what drove the B- grade
The composite is a weighted blend of 9 inputs, each scored 0–100. Each bar is that input's sub-score; the figure is the points it added to the 100-point composite (weight × sub-score).
- Cash flow +26.3/30.0
- ARV discount +15.0/15.0
- DSCR +8.9/10.0
- 1% rule +6.4/10.0
- Rent growth +4.2/5.0
- Livability +3.9/5.0
- Condition / age +2.5/5.0
- Schools +1.1/10.0
- Appreciation +0.0/10.0
$139,000
🖨 Deal sheet (PDF) 📄 Offer letter ✓ Due diligence
Listing remarks
Looking for extra space? This 3-bedroom, 1-bath ranch has it! In addition to the main living areas, you'll find a generous bonus room perfect for a second living area, game room, office, or workout space. The eat-in kitchen offers a welcoming place to gather, complete with a ceiling fan for added comfort. Convenient one-level living makes this home both practical and appealing.
Key facts
- One-level living
- Bonus room
- Eat-in kitchen
Tags
Property features AI
Finance
- Other: Lot approximately 9,583 square feet; Above-grade finished area reported as 1,176
- HOA & community: No association fees
Exterior
- Parking: Off-street parking
- Utilities: Public water; Public sewer
- Home design: Single-family residence; Ranch floor plan; One-story
- Construction: Vinyl siding; Composition roof; Slab foundation; Home age: 51–75 years
- Exterior features: Metal fencing
Interior
- Kitchen: Electric range; Microwave; Exhaust fan; Eat-in kitchen; Laminate countertops
- Bedrooms: 3 bedrooms (all on the main level)
- Flooring: Carpet; Luxury vinyl
- Bathrooms: 1 full bathroom with shower over tub
- Heating & cooling: Natural gas heating; Electric cooling
- Interior features: Ceiling fans; Window coverings; Storm door(s)
- Laundry & utility: Dryer hookup (electric) on the main level
Neighborhood map
What this means for you Summary
Snapshot
- This is a 3-bed/1.0-bath single-family listed at $139k.
Deal economics
- At list price, monthly cash flow is $359 ($4k/yr) — positive.
- The deal already cash-flows at list — no discount required.
- Meets the 1% rule at list price ($2k rent vs $139k).
- Cap rate 9.4% vs local median 3.9% in Kansas City — top-decile yield for the area; either an underpriced asset or a hidden risk that comps aren't pricing in. Stress-test before assuming the spread holds.
Location & tenants
- Location reads 78/100 on livability (#28 in MO, #2,671 nationally) — a middle-class / working-renter tenant base. Strengths: amenities A+, commute A+, cost of living A+; Watch: crime F.
- Hickman Mills C-1 (urban): math 8% / reading 18% proficiency, ranked #314 of 324 in MO (top 97%) — low school quality limits family demand, transient renter base, plan for 1-2y turnover; 78% free/reduced lunch — lower-income household profile, screen leases tightly.
- Zoned schools: Ervin Elementary School (math 8% / reading 12%, grade F, #1,037 of 1,115 statewide, top 94%, 629 students, 100% FRL); Smith-Hale Middle (math 7% / reading 19%, grade F, #368 of 391 statewide, top 94%, 770 students, 100% FRL); Ruskin High School (math 8% / reading 47%, grade F, #416 of 521 statewide, top 80%, 1,273 students, 100% FRL) — zoned schools average 100% FRL vs 78% district-wide (22 pts higher); higher-poverty schools than district average — tighter screening recommended.
- Market conditions: Rents rising fast (+6.7%/yr); 147 active listings in the ZIP; 40 comparable units currently listed for rent nearby; rentals at typical pace (median 22d on market — plan ~3-4 weeks tenant-placement turnaround); 4,002 units permitted in Jackson County in 2024 (2,271 in 5+ unit buildings).
- This rent runs 33% of the median local income ($58k/yr) — at the standard rent-burdened threshold; future hikes will face affordability resistance.
Forward outlook
- Local home prices are declining (-3.0%/yr); year-one equity from $961 of loan paydown is wiped out by about $4k of value loss. Plan a longer hold.
- Jackson County population projected at +4% by 2050 — modest demand growth; plan on rents tracking national, not racing it.
- At projected returns (-3.0% appreciation + 6.7% rent growth), your $39k cash investment doubles in ~8 years — after that, you're playing with house money.
Negotiation context
- Only 13 days on market — expect competitive offers; lowballing is unlikely to land.
Risks & watch-outs
- Watch-outs: built in 1955 — expect roof / HVAC / electrical / plumbing capex.
Questions for the listing agent
- Built in 1955 — when were the roof, HVAC, electrical panel, plumbing, and water heater last replaced?
- Is there a deadline driving the sale (1031 exchange, divorce, estate, relocation)? That informs how much negotiation room exists.
- Crime grade is F in this area — have there been break-ins, vandalism, or insurance claims at this property in the last 3 years? What carrier currently insures it and at what premium?
- What's the average days-on-market for RENTAL listings here right now (not sales)? A rising rental-DOM trend means longer vacancies and softer asking-rent achievability than the comps imply.
- What's the recent tenant-quality profile in this submarket — average credit score on applications, eviction rate, late-payment / NSF rate, and stable-employment percentage? A property-management company in the area should have these aggregated.
- How much new for-sale + rental construction is in the pipeline within 1–3 miles? Heavy new supply typically softens prices + rents 12–24 months out; constrained supply supports both.
Investment metrics
- 1% rule
- 1.14% ✓
- Cap rate
- 9.39%
- Cash-on-cash
- 11.07%
- DSCR
- 1.49
- GRM
- 7.3
CMA / ARV
- ARV (on-the-fly)
- $179,928
- Comps found
- 12
Show comp detail 12 sales within ~0.75 mi
| Address | Dist | Beds/Ba | Sqft | Sold | Price | $/sf | Match |
|---|---|---|---|---|---|---|---|
| 11216 Herrick Ave | 0.22mi | 3/2.0 | 1,143 (-3%) | 2mo | $159,000 | $139 | 79 |
| 11504 Manchester Ave | 0.21mi | 3/2.0 | 1,126 (-4%) | 1mo | $174,900 | $155 | 78 |
| 7709 E 113th St | 0.29mi | 4/2.0 (+1) | 1,176 (0%) | 2mo | $191,500 | $163 | 76 |
| 11115 Winchester Ave | 0.53mi | 3/1.0 | 1,176 (0%) | 1mo | $154,900 | $132 | 75 |
| 10809 Bristol Ter | 0.74mi | 3/1.0 | 1,176 (0%) | 2mo | $179,500 | $153 | 64 |
| 8601 E 114th Ter | 0.40mi | 3/1.0 | 1,036 (-12%) | 0mo | $144,500 | $139 | 61 |
| 11309 Marsh Ave | 0.25mi | 3/2.0 | 1,016 (-14%) | 1mo | $139,950 | $138 | 60 |
| 8303 E 110th Ter | 0.49mi | 4/2.0 (+1) | 1,119 (-5%) | 2mo | $190,000 | $170 | 58 |
| 7811 E 112th St | 0.60mi | 4/1.0 (+1) | 1,244 (+6%) | 2mo | $144,900 | $116 | 56 |
| 8300 E 110th St | 0.57mi | 3/1.0 | 1,062 (-10%) | 2mo | $174,950 | $165 | 55 |
| 11014 Cambridge Ave | 0.73mi | 4/2.0 (+1) | 1,248 (+6%) | 1mo | $184,900 | $148 | 46 |
| 7706 E 110th St | 0.71mi | 4/2.0 (+1) | 1,092 (-7%) | 3mo | $190,000 | $174 | 44 |
Match score weights: distance 35% · size 25% · config 20% · recency 20%. Top-matched comps best support the ARV.
Projected returns pro-forma
-3.0% appreciation · 6.73% rent growth · sell at horizon
- IRR
- 4.1%
- Equity multiple
- 1.17×
- Total profit
- $6,473
- Equity at exit
- $20,725
- IRR
- 16.7%
- Equity multiple
- 2.60×
- Total profit
- $62,261
- Equity at exit
- $12,018
Cash invested: $38,920 (down + closing). Projections, not guarantees.
Landlord ↔ Tenant lean methodology
- Overall (STATE)
- 81 Strongly Landlord-Friendly
- State Missouri
- 81 Strongly Landlord-Friendly · R+10
- County
- — inherits STATE
- City
- — inherits STATE
ZIP-level market 64134
- Rents YoY
- 6.7%
- Active inventory
- 147
- Price-to-rent
- 7.3×
Monthly cashflow live
- Estimated rent
- $1,580 high interval (Pro) →
- Mortgage (P&I)
- −$729
- Tax from tax record
- −$103 /mo · $1,230/yr
- Insurance
- −$58
- HOA
- −$0
- Vacancy / Maint / Mgmt
- −$332
- Net cashflow
- $359
Break-even live
Sensitivity live
| Price | -10% $438 | -5% $398 | +0% $359 | +5% $320 | +10% $280 |
|---|---|---|---|---|---|
| Rent | -10% $234 | -5% $297 | +0% $359 | +5% $421 | +10% $484 |
| Rate | -1.0pp $429 | -0.5pp $394 | base $359 | +0.5pp $323 | +1.0pp $286 |
UW: 25.0% down · 7.5% · 30yr · 1.5% tax · 5.0% vac · 8.0% maint · 8.0% mgmt
Financing live
Cash to close
- Down payment
- $34,750
- Closing costs
- $4,170
- Reserves months
- —
- Total cash needed
- —
Loan-product check · same deal, 3 products live
Conventional
25% down · 7.5% · 30yr
- Down + closing
- —
- Monthly P&I
- —
- Monthly cashflow
- —
- DSCR
- —
- Eligible?
- —
Personal DTI + credit; lowest rate.
DSCR
20% down · 8.5% · 30yr
- Down + closing
- —
- Monthly P&I
- —
- Monthly cashflow
- —
- DSCR
- —
- Eligible?
- —
No personal income docs; deal must DSCR.
Hard money
10% down · 12.0% · 12mo
- Down + closing
- —
- Monthly P&I
- —
- Monthly cashflow
- —
- DSCR
- —
- Eligible?
- —
Short-term bridge; refi at stabilization.
Rent comps 40 comps
| Address | Beds | Baths | Sqft | Rent | $/sqft | DOM | Units | Dist |
|---|---|---|---|---|---|---|---|---|
| 11410 Palmer Ave Kansas City, MO | 4.0 | 2.0 | 936 | $1,300 | $1.39 | 45d | 1 | 0.08mi |
| 11421 Manchester Ave Kansas City, MO | 4.0 | 1.0 | 1176 | $1,550 | $1.32 | 5d | 1 | 0.12mi |
| 11406 Sycamore Ter Kansas City, MO | 3.0 | 1.0 | 912 | $1,450 | $1.59 | 18d | 1 | 0.14mi |
| 11354 Sycamore Ter Kansas City, MO | 4.0 | 1.0 | 1176 | $1,850 | $1.57 | 3d | 1 | 0.14mi |
| 11210 Manchester Ave Kansas City, MO | 4.0 | 1.0 | 1200 | $1,395 | $1.16 | 25d | 1 | 0.14mi |
| 11513 Richmond Ave Kansas City, MO | 3.0 | 1.5 | 1114 | $1,450 | $1.30 | 16d | 1 | 0.25mi |
| 7610 E 113th St Kansas City, MO | 4.0 | 2.0 | 1176 | $1,700 | $1.45 | 45d | 1 | 0.27mi |
| 11316 Donnelly Ave Kansas City, MO | 3.0 | 1.0 | 1000 | $1,475 | $1.48 | 45d | 1 | 0.29mi |
| 11208 Marsh Ave Kansas City, MO | 3.0 | 1.0 | 912 | $1,395 | $1.53 | 4d | 1 | 0.30mi |
| 7801 E 113th St Kansas City, MO | 3.0 | 1.0 | 1341 | $1,450 | $1.08 | 18d | 1 | 0.30mi |
| 11206 Corrington Ave Kansas City, MO | 4.0 | 1.5 | 1176 | $1,595 | $1.36 | 25d | 1 | 0.32mi |
| 11116 Bristol Ter Kansas City, MO | 3.0 | 1.0 | 956 | $1,390 | $1.45 | 25d | 1 | 0.37mi |
| 8410 Ruskin Way Kansas City, MO | 4.0 | 1.0 | 1176 | $1,850 | $1.57 | 18d | 1 | 0.39mi |
| 7405 E 112th St Kansas City, MO | 4.0 | 1.0 | 936 | $1,850 | $1.98 | 45d | 1 | 0.41mi |
| 8310 E 111th Ter Kansas City, MO | 3.0 | 1.0 | 912 | $950 | $1.04 | 18d | 1 | 0.43mi |
| 7104 Longview Rd Kansas City, MO | 3.0 | 1.0 | 912 | $1,275 | $1.40 | 16d | 1 | 0.44mi |
| 7114 E 112th St Kansas City, MO | 4.0 | 1.0 | 936 | $1,850 | $1.98 | 25d | 1 | 0.46mi |
| 7305 E 111th Ter Kansas City, MO | 4.0 | 1.0 | 1100 | $1,345 | $1.22 | 16d | 1 | 0.46mi |
| 7119 E 111th Ter Kansas City, MO | 3.0 | 1.0 | 912 | $1,349 | $1.48 | 45d | 1 | 0.47mi |
| 11407 Winchester Ave Kansas City, MO | 3.0 | 1.0 | 936 | $1,360 | $1.45 | 4d | 1 | 0.49mi |
| 11316 Lewis Ave Unit 1 Kansas City, MO | 4.0 | 2.0 | 1176 | $1,850 | $1.57 | 3d | 1 | 0.51mi |
| 8304 E 110 Ter Kansas City, MO | 3.0 | 1.0 | 912 | $1,450 | $1.59 | 45d | 1 | 0.52mi |
| 7605 E 111th Ter Kansas City, MO | 3.0 | 1.0 | 1176 | $1,050 | $0.89 | 3d | 1 | 0.53mi |
| 6905 E 112th St Kansas City, MO | 3.0 | 1.0 | 972 | $1,550 | $1.59 | 45d | 1 | 0.53mi |
| 8517 E 110th Ter Kansas City, MO | 3.0 | 2.0 | 1095 | $1,450 | $1.32 | 45d | 1 | 0.55mi |
| 7415 E 110th St Kansas City, MO | 3.0 | 1.0 | 1176 | $1,385 | $1.18 | 3d | 1 | 0.55mi |
| 7800 E 112th St Kansas City, MO | 3.0 | 1.0 | 900 | $1,600 | $1.78 | 25d | 1 | 0.56mi |
| 11127 Blue Ridge Blvd Kansas City, MO | 3.0 | 1.0 | 1000 | $1,599 | $1.60 | 45d | 1 | 0.56mi |
| 11308 McKinley Ave Kansas City, MO | 3.0 | 1.0 | 1272 | $1,345 | $1.06 | 25d | 1 | 0.57mi |
| 6904 Longview Rd Kansas City, MO | 4.0 | 1.0 | 900 | $1,850 | $2.06 | 3d | 1 | 0.57mi |
| 8006 E 118th Ter Kansas City, MO | 3.0 | 1.5 | 1132 | $1,450 | $1.28 | 22d | 1 | 0.62mi |
| 8600 E 110th St Kansas City, MO | 4.0 | 2.0 | 1290 | $1,602 | $1.24 | 18d | 1 | 0.67mi |
| 11803 Holiday Dr #5 Kansas City, MO | 1.0–3.0 | 1.0 | 1016 | $1,130 | $1.11 | 3d | 1 | 0.72mi |
| 11923 Manchester Ave Grandview, MO | 3.0 | 2.0 | 1407 | $1,815 | $1.29 | 45d | 1 | 0.75mi |
| 11009 Ewing Ave Kansas City, MO | 4.0 | 1.0 | 1416 | $1,595 | $1.13 | 45d | 1 | 0.78mi |
| 11934 Sycamore Ave Grandview, MO | 3.0 | 2.0 | 1414 | $1,806 | $1.28 | 45d | 1 | 0.80mi |
| 10719 Bristol Ter Kansas City, MO | 3.0 | 2.0 | 1096 | $1,456 | $1.33 | 25d | 1 | 0.80mi |
| 10919 Ewing Ave Kansas City, MO | 3.0 | 1.0 | 840 | $1,850 | $2.20 | 5d | 1 | 0.82mi |
| 8622 E 108th Ter Kansas City, MO | 3.0 | 1.0 | 993 | $1,995 | $2.01 | 5d | 1 | 0.84mi |
| 11720 Newton Ave Kansas City, MO | 2.0–3.0 | 1.5–3.0 | 1293 | $1,699 | $1.31 | 3d | 9 | 0.89mi |
Listing history 9 events
-
2026-06-21days on market $139,000 Active 13 DOM
-
2026-06-18days on market $139,000 Active 10 DOM
-
2026-06-17days on market $139,000 Active 9 DOM
-
2026-06-16days on market $139,000 Active 8 DOM
-
2026-06-15days on market $139,000 Active 7 DOM
-
2026-06-13days on market $139,000 Active 5 DOM
-
2026-06-13days on market $139,000 Active 4 DOM
-
2026-06-08remarks 380-char remark
-
2026-06-08$139,000 Active 1 DOM
ⓘ Source: listings_history table (triggers on properties + properties_extension) + one-shot
backfill from property_details.listing_events for pre-trigger history.
Tax reassessment forecast MO · Resets to sale price
- Current annual tax
- $1,230 · $103/mo
- Projected year-2 tax
- $1,348 · $112/mo
- Expected delta
- +$118/yr (+$10/mo · 9.6%)
ⓘ Screening estimate from a state-policy table — verify with the county assessor before closing.
Climate risk First Street
- Flood 1/10 Low FEMA zone X (unshaded) · 0% chance over 30 yrs
- Wildfire 1/10 Low
- Heat 4/10 Moderate 7 d/yr ≥107°F today · 17 d/yr by 30 yrs out
- Wind 2/10 Low
- Air quality 3/10 Moderate 3 unhealthy d/yr today · 3 by 30 yrs out
Nearby sold comps map
Loading sold comps map…
Walkable amenities ~0.75 mi
Loading nearby amenities…
Taxation est. · year 1
- Rental income
- $18,962
- − Mortgage interest
- −$7,786
- − Property taxes
- −$1,230
- − Insurance
- −$695
- − Repairs & maintenance
- −$1,517
- − Management
- −$1,517
- − Depreciation
- −$4,044
- Taxable income
- $2,173
- Est. tax owed @ 24.0%
- −$522
- After-tax cash flow
- $3,786/yr
For passive investors: Depreciation is non-cash, so a rental often shows a tax loss while cash-flowing — sheltering income. Rental losses are passive: they offset passive income freely, and up to $25,000/yr can offset ordinary (W-2) income if you actively participate and your MAGI is under $100k (phasing out to $0 by $150k); unused losses carry forward. On sale, claimed depreciation is recaptured at up to 25%, and gains may owe capital-gains tax (a 1031 exchange can defer both). Figures are a year-1 estimate at your 24.0% rate — not tax advice; consult a CPA.
Schools (NCES district)
- District
- Hickman Mills C-1
- NCES district ID
- 2914340
- Math proficiency
- 8% ▼ -8.00%
- Reading proficiency
- 18% ▼ -4.00%
- Median HH income
- $40,908
- Composite
- 11.2/100
- National rank
- #9725
- State rank
- #314 of 324 in MO
Livability — Kansas City
- Score
- 78/100
- State rank
- #28
- US rank
- #2671
Category grades
Schools grade is shown separately in the Schools card above.
Census & demographics
- Census place
- Kansas City, MO
- County
- Jackson County · 687,798 people
- City population
- 439,467
- Metro
- Kansas City, MO-KS
- Population (ZIP)
- 22,964
- Household income
- $58,170
- Rent vs Own
- Severe rent burden
- 718.0
Population outlook (Jackson County) Hauer SSP2
- Today (2025)
- 719,589 people
- By 2030
- 731,456 · +1.6%
- By 2040
- 746,689 · +3.8%
- By 2050
- 749,289 · +4.1%
- By 2075
- 736,227 · +2.3%
- By 2100
- 668,210 · -7.1%
Race, ethnicity, and origin ACS 2023
- Neighborhood character
- Diverse neighborhood (Simpson 0.58)
- Race & ethnicity
- Black 58% White 28% Hispanic / Latino 10% Two or more races 6%
- Hispanic origin (detail)
- Mexican 6%
- Common ancestry
- Italian 2% Lithuanian 1% Romanian 1%
- Foreign-born
- 4% · Canada
- Languages at home
- 93% English-only · Spanish 5% Arabic 1%
Political lean MEDSL · Jackson
- 2024 margin
- D (+19.3) · D 58.9% · R 39.5% · Other 1.6%
- 2008→2024 swing
- -6.1pp toward R · 2008: 25.4pp · 2024: 19.3pp
- All cycles
- 2024: D+19.3 2020: D+22.0 2016: D+16.6 2012: D+19.0 2008: D+25.4
Not yet ingested
- Civics
- —
Market trends
- HPI YoY
- ▼ -157.94%
- Current HPI
- 277.895
- Rent YoY
- ▲ 6.73%
- Metro
- Kansas City, MO-KS
- State GDP YoY
- ▲ 1.84%
- F500 in state
- 20
Industry mix (Fortune 500 HQ in MO)
| Industry | F500 HQs | Revenue |
|---|---|---|
| Healthcare | 1 | $163B |
|
||
| Insurance | 1 | $21B |
|
||
| Industrial Technology | 1 | $17B |
|
||
| Retail | 1 | $16B |
|
||
| Industrial Distribution | 1 | $10B |
|
||
| Utilities | 1 | $9B |
|
||
Price history
5 events — show timeline
- 2026-06-08 Listed $139,000 Heartland MLS as Distributed by MLS Grid
- 2023-01-27 Sold (Public Records) — Public Records
- 2014-05-29 Sold (Public Records) — Public Records
- 2013-10-23 Sold (Public Records) — Public Records
- 1996-07-09 Sold (Public Records) — Public Records
Property tax history
+10.5%/yrLatest (2025): $1,230 · -3.6% YoY. Source: county tax records.
Cash-flow waterfall
monthlySold comps — $/sqft
last 12 mo · ≤1 miLoading sold comps…