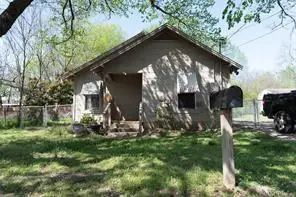
707 Ritchey St · Gainesville, TX
Flood risk 1/10 · Minimal
- FEMA flood zone
- X (unshaded)
- Chance of flooding over 30 yrs
- 0.0%
- Est. flood insurance / yr
- $507 – $1,088
Fire risk 7/10 · Major
- Est. fire insurance / yr
- $1,222 – $2,270
Heat risk 6/10 · Moderate
- Hot days now (above 110°F)
- 7 days/yr
- Hot days in 30 yrs
- 20 days/yr
Wind risk 4/10 · Minor
- Chance of severe wind over 30 yrs
- 17.0%
Air-quality risk 3/10 · Minor
- Unhealthy air days now
- 3 days/yr
- Unhealthy air days in 30 yrs
- 4 days/yr
Risk factors via First Street. Map © Google.
Why this score? — see what drove the B grade
The composite is a weighted blend of 9 inputs, each scored 0–100. Each bar is that input's sub-score; the figure is the points it added to the 100-point composite (weight × sub-score).
- Cash flow +27.2/30.0
- ARV discount +15.0/15.0
- DSCR +9.5/10.0
- 1% rule +8.3/10.0
- Livability +3.3/5.0
- Schools +2.6/10.0
- Rent growth +2.5/5.0
- Condition / age +2.5/5.0
- Appreciation +0.0/10.0
$100,000
🖨 Deal sheet 📄 Offer letter ✓ Due diligence
Listing remarks MLS
HOT NEW LISTING! Perfect Home To Call Your Own, Adorable, Charming and Move In Ready! Recent Updates Throughout, Beautiful Kitchen, Spacious rooms, Hardwood & Laminate Flooring, Eat in Kitchen, Covered Porch, Large Fenced Yard, Full Size Laundry Room and So Much More. Such a Wonderful Home For a Great Price!!!
Key facts
- Covered porch
- Beautiful kitchen
- New hvac
Tags
Property features AI
Finance
- Other: Property classified as residential, single-family residence; Lot is less than 0.5 acre
- Financial info: Listing terms include cash and conventional financing; No second mortgage listed
- HOA & community: No homeowners association
Exterior
- Parking: 2 covered parking spaces; 2-car garage; Asphalt parking surface
- Utilities: City water; City sewer; Electricity available; Natural gas available; Overhead utilities; Curbs
- Home design: Single-family residence; Attached property; Built in 1945; One story
- Construction: Wood construction; Asphalt/composition roof; Pillar/post/pier foundation
- Exterior features: Chain link fencing; Brush and grassed vegetation; Easement for electric
Interior
- Kitchen: Electric cooktop; Electric oven
- Bedrooms: 2 bedrooms (both on the main level)
- Flooring: Laminate flooring; Wood flooring
- Bathrooms: 1 full bathroom
- Heating & cooling: Central heating (natural gas); Central air conditioning; Ceiling fans; Electric cooling components
- Interior features: Cable TV available; Six total rooms; One living area; One level (single-story)
- Laundry & utility: Utility room with built-in cabinets (on the main level)
Neighborhood map
What this means for you Summary
Snapshot
- This is a 2-bed/2.0-bath single-family listed at $100k.
Deal economics
- At list price, monthly cash flow is $286 ($3k/yr) — positive.
- The deal already cash-flows at list — no discount required.
- Meets the 1% rule at list price ($1k rent vs $100k).
- Recommended offer: $97k (3.0% below list) — sets the bar for market timing.
- Cap rate 9.7% vs local median 3.7% in Gainesville — top-decile yield for the area; either an underpriced asset or a hidden risk that comps aren't pricing in. Stress-test before assuming the spread holds.
Location & tenants
- Location reads 66/100 on livability (#602 in TX) — a middle-class / working-renter tenant base. Strengths: cost of living A+, housing A+, crime B+; Watch: amenities F, commute F, employment F.
- Gainesville ISD (rural): math 33% / reading 29% proficiency, ranked #606 of 826 in TX (top 73%) — families likely to look elsewhere, expect single-tenant / working-renter base with shorter leases; 72% free/reduced lunch — lower-income household profile, screen leases tightly.
- Zoned schools: W E Chalmers El (math 28% / reading 24%, grade F, #2,954 of 4,322 statewide, top 69%, 716 students, 67% FRL) — zoned schools at 67% FRL track the district average.
- Market conditions: 462 active listings in the ZIP; 1 comparable units currently listed for rent nearby; 190 units permitted in Cooke County in 2024 (0 in 5+ unit buildings).
Forward outlook
- Local home prices are declining (-3.0%/yr); year-one equity from $691 of loan paydown is wiped out by about $3k of value loss. Plan a longer hold.
- At projected returns (-3.0% appreciation + 3.0% rent growth), your $28k cash investment doubles in ~10 years — after that, you're playing with house money.
Negotiation context
- It's been on market 32 days — a 3% lower offer ($97k) is reasonable based on typical stale-listing flexibility.
- 3 sale attempts since 4y ago with the ask held roughly flat each time — persistent listings suggest the price (not the market) is what's stuck; bring a comps-based counter.
Risks & watch-outs
- Watch-outs: built in 1945 — expect roof / HVAC / electrical / plumbing capex.
- Climate carrying-cost: major wildfire risk; extreme-heat days projected 7→20/yr by 2055 (HVAC capex compounding) — expect insurance premiums to compound above CPI over the hold.
Questions for the listing agent
- It's been on market 32 days. Have you received any prior offers? Is the seller open to a 3% concession, seller financing, or rate buy-down credit?
- Built in 1945 — when were the roof, HVAC, electrical panel, plumbing, and water heater last replaced?
- Is there a deadline driving the sale (1031 exchange, divorce, estate, relocation)? That informs how much negotiation room exists.
- Schools are F-rated, which usually means shorter tenancies and higher turnover. Who's the typical renter profile here, and what's been the actual vacancy rate?
- What's the average days-on-market for RENTAL listings here right now (not sales)? A rising rental-DOM trend means longer vacancies and softer asking-rent achievability than the comps imply.
- What's the recent tenant-quality profile in this submarket — average credit score on applications, eviction rate, late-payment / NSF rate, and stable-employment percentage? A property-management company in the area should have these aggregated.
- How much new for-sale + rental construction is in the pipeline within 1–3 miles? Heavy new supply typically softens prices + rents 12–24 months out; constrained supply supports both.
Investment metrics
- 1% rule
- 1.33% ✓
- Cap rate
- 9.73%
- Cash-on-cash
- 12.27%
- DSCR
- 1.55
- GRM
- 6.3
CMA / ARV
- ARV (on-the-fly)
- $160,200
- Comps found
- 8
Show comp detail 8 sales within ~0.75 mi
| Address | Dist | Beds/Ba | Sqft | Sold | Price | $/sf | Match |
|---|---|---|---|---|---|---|---|
| 318 Cunningham St | 0.33mi | 2/1.0 | 884 (-1%) | 9mo | $140,000 | $158 | 72 |
| 827 N Morris St | 0.24mi | 2/1.0 | 924 (+4%) | 9mo | $129,500 | $140 | 71 |
| 912 N Clements St | 0.23mi | 2/1.5 | 960 (+8%) | 8mo | $198,000 | $206 | 68 |
| 1420 Olive St | 0.19mi | 2/1.0 | 832 (-6%) | 14mo | $150,000 | $180 | 65 |
| 610 Ritchey St | 0.08mi | 3/1.0 (+1) | 1,008 (+13%) | 14mo | $190,000 | $188 | 53 |
| 724 N Taylor | 0.25mi | 2/1.0 | 997 (+12%) | 15mo | $159,500 | $160 | 52 |
| 420 Cunningham | 0.21mi | 2/1.0 | 768 (-14%) | 16mo | $174,900 | $228 | 50 |
| 605 N Denton St | 0.66mi | 2/1.0 | 949 (+7%) | 21mo | $149,900 | $158 | 36 |
Match score weights: distance 35% · size 25% · config 20% · recency 20%. Top-matched comps best support the ARV.
Projected returns pro-forma
-3.0% appreciation · 3.0% rent growth · sell at horizon
- IRR
- 2.0%
- Equity multiple
- 1.08×
- Total profit
- $2,103
- Equity at exit
- $14,910
- IRR
- 11.6%
- Equity multiple
- 1.91×
- Total profit
- $25,588
- Equity at exit
- $8,646
Cash invested: $28,000 (down + closing). Projections, not guarantees.
Landlord ↔ Tenant lean methodology
- Overall (STATE)
- 87 Strongly Landlord-Friendly
- State Texas
- 87 Strongly Landlord-Friendly · R+5
- County
- — inherits STATE
- City
- — inherits STATE
ZIP-level market 76240
- Active inventory
- 462
- Price-to-rent
- 6.3×
Monthly cashflow live
- Estimated rent
- $1,332 medium interval (Pro) →
- Mortgage (P&I)
- −$524
- Tax from tax record
- −$200 /mo · $2,395/yr
- Insurance
- −$42
- HOA
- −$0
- Vacancy / Maint / Mgmt
- −$280
- Net cashflow
- $286
Break-even live
UW: 25.0% down · 7.5% · 30yr · 1.5% tax · 5.0% vac · 8.0% maint · 8.0% mgmt
Financing live
Cash to close
- Down payment
- $25,000
- Closing costs
- $3,000
- Reserves months
- —
- Total cash needed
- —
Loan-product check · same deal, 3 products live
Conventional
25% down · 7.5% · 30yr
- Down + closing
- —
- Monthly P&I
- —
- Monthly cashflow
- —
- DSCR
- —
- Eligible?
- —
Personal DTI + credit; lowest rate.
DSCR
20% down · 8.5% · 30yr
- Down + closing
- —
- Monthly P&I
- —
- Monthly cashflow
- —
- DSCR
- —
- Eligible?
- —
No personal income docs; deal must DSCR.
Hard money
10% down · 12.0% · 12mo
- Down + closing
- —
- Monthly P&I
- —
- Monthly cashflow
- —
- DSCR
- —
- Eligible?
- —
Short-term bridge; refi at stabilization.
Rent comps 1 comps
| Address | Beds | Baths | Sqft | Rent | $/sqft | DOM | Units | Dist |
|---|---|---|---|---|---|---|---|---|
| 1610 Elizabeth St Gainesville, TX | 3.0 | 1.0 | 1100 | $1,500 | $1.36 | 43d | 1 | 0.18mi |
Listing history 14 events
-
2026-05-01soldstatus
-
2026-04-17status Pending
-
2026-04-09historical Active Contingent
-
2026-03-15$100,000 Active
-
2025-10-24historical
-
2025-09-04price $110,000
-
2025-05-23$120,000 Active
-
2022-06-27soldstatus
-
2022-06-24soldstatus Closed 316-char remark
Show marketing remark (316 chars)
HOT NEW LISTING! Perfect Home To Call Your Own, Adorable, Charming and Move In Ready! Recent Updates Throughout, Beautiful Kitchen, Spacious rooms, Hardwood & Laminate Flooring, Eat in Kitchen, Covered Porch, Large Fenced Yard, Full Size Laundry Room and So Much More. Such a Wonderful Home For a Great Price!!!
-
2022-06-06status Pending 316-char remark
Show marketing remark (316 chars)
HOT NEW LISTING! Perfect Home To Call Your Own, Adorable, Charming and Move In Ready! Recent Updates Throughout, Beautiful Kitchen, Spacious rooms, Hardwood & Laminate Flooring, Eat in Kitchen, Covered Porch, Large Fenced Yard, Full Size Laundry Room and So Much More. Such a Wonderful Home For a Great Price!!!
-
2022-05-19$119,950 Active 316-char remark
Show marketing remark (316 chars)
HOT NEW LISTING! Perfect Home To Call Your Own, Adorable, Charming and Move In Ready! Recent Updates Throughout, Beautiful Kitchen, Spacious rooms, Hardwood & Laminate Flooring, Eat in Kitchen, Covered Porch, Large Fenced Yard, Full Size Laundry Room and So Much More. Such a Wonderful Home For a Great Price!!!
-
2016-03-09soldstatus
-
2008-01-02soldstatus
-
2002-03-15soldstatus
ⓘ Source: listings_history table (triggers on properties + properties_extension) + one-shot
backfill from property_details.listing_events for pre-trigger history.
Tax reassessment forecast TX · Resets to sale price
- Current annual tax
- $2,395 · $200/mo
- Projected year-2 tax
- $2,395 · $200/mo
- Expected delta
- $0/yr ($0/mo · 0.0%)
ⓘ Screening estimate from a state-policy table — verify with the county assessor before closing.
Climate risk First Street
- Flood 1/10 Low FEMA zone X (unshaded) · 0% chance over 30 yrs
- Wildfire 7/10 Severe
- Heat 6/10 Major 7 d/yr ≥110°F today · 20 d/yr by 30 yrs out
- Wind 4/10 Moderate 17% chance of damaging wind over 30 yrs
- Air quality 3/10 Moderate 3 unhealthy d/yr today · 4 by 30 yrs out
Nearby sold comps map
Loading sold comps map…
Walkable amenities ~0.75 mi
Loading nearby amenities…
Taxation est. · year 1
- Rental income
- $15,981
- − Mortgage interest
- −$5,602
- − Property taxes
- −$2,395
- − Insurance
- −$500
- − Repairs & maintenance
- −$1,278
- − Management
- −$1,278
- − Depreciation
- −$2,909
- Taxable income
- $2,018
- Est. tax owed @ 24.0%
- −$484
- After-tax cash flow
- $2,953/yr
For passive investors: Depreciation is non-cash, so a rental often shows a tax loss while cash-flowing — sheltering income. Rental losses are passive: they offset passive income freely, and up to $25,000/yr can offset ordinary (W-2) income if you actively participate and your MAGI is under $100k (phasing out to $0 by $150k); unused losses carry forward. On sale, claimed depreciation is recaptured at up to 25%, and gains may owe capital-gains tax (a 1031 exchange can defer both). Figures are a year-1 estimate at your 24.0% rate — not tax advice; consult a CPA.
Schools (NCES district)
- District
- Gainesville ISD
- NCES district ID
- 4820220
- Math proficiency
- 33% ▼ -9.00%
- Reading proficiency
- 29% ▼ -2.00%
- Median HH income
- $41,772
- Composite
- 26.27/100
- National rank
- #7252
- State rank
- #606 of 826 in TX
Livability — Gainesville
- Score
- 66/100
- State rank
- #602
- US rank
- #11445
Category grades
Schools grade is shown separately in the Schools card above.
Census & demographics
- Census place
- Gainesville, TX
- County
- Cooke County · 29,419 people
- City population
- 29,419
- Metro
- Gainesville, TX
- Population (ZIP)
- 29,419
- Household income
- $71,502
- Rent vs Own
- Severe rent burden
- 660.0
Population outlook (Cooke County) Hauer SSP2
- Today (2025)
- 39,965 people
- By 2030
- 39,974 · +0.0%
- By 2040
- 39,772 · -0.5%
- By 2050
- 39,258 · -1.8%
- By 2075
- 37,262 · -6.8%
- By 2100
- 33,363 · -16.5%
Race, ethnicity, and origin ACS 2023
- Neighborhood character
- Predominantly White (66%)
- Race & ethnicity
- White 66% Hispanic / Latino 24% Two or more races 14% Black 5%
- Hispanic origin (detail)
- Mexican 21%
- Common ancestry
- Serbian 2% Lithuanian 2% Slovak 1%
- Foreign-born
- 8% · Canada
- Languages at home
- 83% English-only · Spanish 16% Other Indo-European 1%
Political lean MEDSL · Cooke
- 2024 margin
- Solid R (+66.9) · D 16.2% · R 83.1%
- 2008→2024 swing
- -8.2pp toward R · 2008: -58.7pp · 2024: -66.9pp
- All cycles
- 2024: R+66.9 2020: R+65.2 2016: R+68.1 2012: R+67.6 2008: R+58.7
Not yet ingested
- Civics
- —
Market trends
- HPI YoY
- ▼ -198.63%
- Current HPI
- 247.3822
- Rent YoY
- —
- Metro
- Gainesville, TX
- State GDP YoY
- ▲ 3.95%
- F500 in state
- 110
Industry mix (Fortune 500 HQ in TX)
| Industry | F500 HQs | Revenue |
|---|---|---|
| Energy | 16 | $1,198B |
|
||
| Technology | 5 | $198B |
|
||
| Engineering / Construction | 4 | $72B |
|
||
| Energy Services | 3 | $60B |
|
||
| Utilities | 3 | $41B |
|
||
| Healthcare | 2 | $330B |
|
||
Price history
-16.6% since first listed14 events — show timeline
- 2026-05-01 Sold (Public Records) — Public Records
- 2026-04-17 Pending — NTREIS
- 2026-04-09 Contingent — NTREIS
- 2026-03-15 Listed $100,000 NTREIS
- 2025-10-24 Listing Removed — NTREIS
- 2025-09-04 Price Changed $110,000 NTREIS
- 2025-05-23 Listed $120,000 NTREIS
- 2022-06-27 Sold (Public Records) — Public Records
- 2022-06-24 Sold (MLS) — NTREIS
- 2022-06-06 Pending — NTREIS
- 2022-05-19 Listed $119,950 NTREIS
- 2016-03-09 Sold (Public Records) — Public Records
- 2008-01-02 Sold (Public Records) — Public Records
- 2002-03-15 Sold (Public Records) — Public Records
Property tax history
+9.7%/yrLatest (2025): $2,395 · +10.4% YoY. Source: county tax records.
Cash-flow waterfall
monthlySold comps — $/sqft
last 12 mo · ≤1 miLoading sold comps…