1875 Cherokee Dr #4 · Salinas, CA
Flood risk 1/10 · Minimal
- FEMA flood zone
- X (shaded)
- Chance of flooding over 30 yrs
- 0.0%
- Est. flood insurance / yr
- $507 – $1,088
Fire risk 1/10 · Minimal
- Est. fire insurance / yr
- $659 – $1,223
Heat risk 3/10 · Minor
- Hot days now (above 81°F)
- 6 days/yr
- Hot days in 30 yrs
- 12 days/yr
Wind risk 1/10 · Minimal
- Chance of severe wind over 30 yrs
- —
Air-quality risk 7/10 · Major
- Unhealthy air days now
- 11 days/yr
- Unhealthy air days in 30 yrs
- 11 days/yr
Risk factors via First Street. Map © Google.
Why this score? — see what drove the D grade
The composite is a weighted blend of 9 inputs, each scored 0–100. Each bar is that input's sub-score; the figure is the points it added to the 100-point composite (weight × sub-score).
- Cash flow +11.8/30.0
- ARV discount +7.5/15.0
- 1% rule +5.0/10.0
- Rent growth +3.7/5.0
- DSCR +3.5/10.0
- Livability +3.2/5.0
- Schools +3.0/10.0
- Condition / age +2.5/5.0
- Appreciation +0.0/10.0
$299,000
🖨 Deal sheet 📄 Offer letter ✓ Due diligence
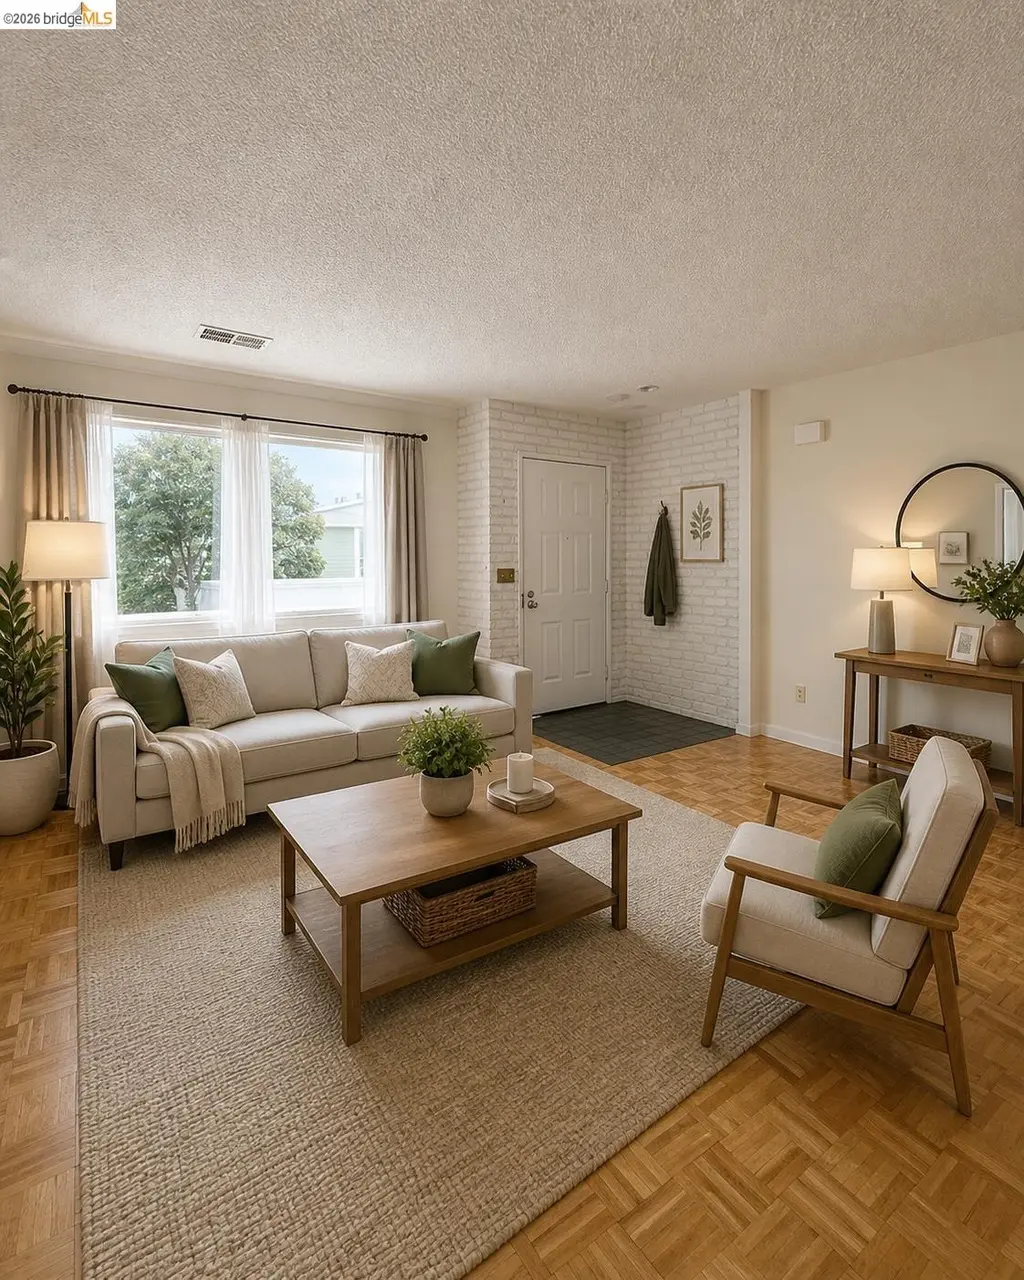
Listing remarks
Here’s the truth—most buyers are chasing “move-in ready, ” which means they’re also paying a premium for someone else’s taste. This one? It’s different. This is where value is created. Welcome to Northgate Village—where opportunity meets location. This rare 3-bedroom, 1.5-bath condo stands out in a market where larger floor plans are hard to come by. Whether you’re a first-time buyer ready to plant roots or an investor looking for upside, this is the kind of property that doesn’t sit around for long. Inside, you’ll find a layout that just makes sense—spacious living area, designated dining space, and all bedrooms privat
Key facts
- Gated community
- Green space
- Community pool
Tags
Property features AI
Finance
- HOA & community: Monthly HOA fee of $595; HOA includes common area maintenance; Community pool
Exterior
- Parking: 1-car garage; 1 covered carport space (carport)
- Utilities: Public water; Public sewer; 220 volts in kitchen
- Home design: Residential condominium; Built in 1984
- Construction: Wood shingle exterior; Shingle roof
- Exterior features: No yard; Rectangular lot
Interior
- Kitchen: Refrigerator; 220 volt outlet
- Bedrooms: Walk-in closet(s) in non-primary bathroom area
- Flooring: Parquet; Tile; Vinyl
- Bathrooms: 2 total bathrooms (1 full, 1 partial); Primary bathroom: shower over tub, tile
- Heating & cooling: Forced air heating
- Interior features: No additional rooms listed; 220 volt outlet in kitchen
- Laundry & utility: Laundry room (common area)
Neighborhood map
What this means for you Summary
Snapshot
- This is a 3-bed/1.5-bath condo listed at $299k.
Deal economics
- At list price, monthly cash flow is $-85 ($-1k/yr) — negative.
- To cash-flow at today's rent, offer at most $284k (5.0% below list).
- To meet the 1% rule (rent ≥ 1% of price), the offer needs to be $299k (0.0% below list).
- Recommended offer: $284k (5.0% below list) — sets the bar for cash-flow.
- Cap rate 6.0% vs local median 2.7% in Salinas — top-decile yield for the area; either an underpriced asset or a hidden risk that comps aren't pricing in. Stress-test before assuming the spread holds.
Location & tenants
- Location reads 63/100 on livability (#465 in CA) — a middle-class / working-renter tenant base. Strengths: commute A+, health & safety A+, employment B+; Watch: schools F, crime D-, amenities F.
- Salinas Union High (urban): math 23% / reading 39% proficiency, ranked #998 of 1,400 in CA (top 71%) — families likely to look elsewhere, expect single-tenant / working-renter base with shorter leases; 66% free/reduced lunch — lower-income household profile, screen leases tightly.
- Market conditions: Rents rising fast (+4.9%/yr); 45 active listings in the ZIP; 15 comparable units currently listed for rent nearby; rentals leasing fast (median 14d on market — plan ~1-2 weeks tenant-placement turnaround); solid renter incomes; 530 units permitted in Monterey County in 2024 (50 in 5+ unit buildings).
- This rent runs 37% of the median local income ($98k/yr) — at the standard rent-burdened threshold; future hikes will face affordability resistance.
Forward outlook
- Local home prices are declining (-3.0%/yr); year-one equity from $2k of loan paydown is wiped out by about $9k of value loss. Plan a longer hold.
- Monterey County population projected at +10% by 2050 — modest demand growth; plan on rents tracking national, not racing it.
Negotiation context
- Only 6 days on market — expect competitive offers; lowballing is unlikely to land.
- Current owner paid $82k; list at $299k implies a 267% gain — meaningful room to come down on a strong offer.
Questions for the listing agent
- What do current leases actually rent for vs. the listed asking? Can we see a recent rent roll and the last 12 months of T-12 income?
- What does the HOA fee cover, when was the last increase, and are there any pending special assessments or reserve-fund shortfalls?
- Any open or pending special assessments — roof, HVAC, plumbing, elevator, façade? What's the per-unit balance and payoff schedule, and is the seller paying it off at close or rolling it to the buyer?
- Is there a deadline driving the sale (1031 exchange, divorce, estate, relocation)? That informs how much negotiation room exists.
- Schools are F-rated, which usually means shorter tenancies and higher turnover. Who's the typical renter profile here, and what's been the actual vacancy rate?
- Crime grade is D in this area — have there been break-ins, vandalism, or insurance claims at this property in the last 3 years? What carrier currently insures it and at what premium?
- The area grade is low — what's the realistic commute time and amenity access for the typical tenant pool here? Any planned neighborhood developments (good or bad) we should know about?
- What's the average days-on-market for RENTAL listings here right now (not sales)? A rising rental-DOM trend means longer vacancies and softer asking-rent achievability than the comps imply.
- What's the recent tenant-quality profile in this submarket — average credit score on applications, eviction rate, late-payment / NSF rate, and stable-employment percentage? A property-management company in the area should have these aggregated.
- How much new apartment / multifamily construction is in the pipeline within 1–3 miles? Heavy new supply (>2% of stock underway) typically softens rents 12–24 months out; light construction supports rent growth.
Investment metrics
- 1% rule
- 1.00% ✗
- Cap rate
- 5.95%
- Cash-on-cash
- -1.21%
- DSCR
- 0.95
- GRM
- 8.3
CMA / ARV
No comps found within radius.
Projected returns pro-forma
-3.0% appreciation · 4.87% rent growth · sell at horizon
- IRR
- -15.7%
- Equity multiple
- 0.43×
- Total profit
- $-47,835
- Equity at exit
- $44,582
- IRR
- -3.8%
- Equity multiple
- 0.72×
- Total profit
- $-23,044
- Equity at exit
- $25,852
Cash invested: $83,720 (down + closing). Projections, not guarantees.
Landlord ↔ Tenant lean methodology
- Overall (STATE)
- 18 Strongly Tenant-Friendly
- State California
- 18 Strongly Tenant-Friendly · D+13
- County
- — inherits STATE
- City
- — inherits STATE
ZIP-level market 93906
- Rents YoY
- 4.9%
- Active inventory
- 45
- Price-to-rent
- 8.3×
Monthly cashflow live
- Estimated rent
- $2,989 high interval (Pro) →
- Mortgage (P&I)
- −$1,568
- Tax from tax record
- −$158 /mo · $1,898/yr
- Insurance
- −$125
- HOA
- −$595
- Vacancy / Maint / Mgmt
- −$628
- Net cashflow
- $-85
Break-even live
UW: 25.0% down · 7.5% · 30yr · 1.5% tax · 5.0% vac · 8.0% maint · 8.0% mgmt
Financing live
Cash to close
- Down payment
- $74,750
- Closing costs
- $8,970
- Reserves months
- —
- Total cash needed
- —
Loan-product check · same deal, 3 products live
Conventional
25% down · 7.5% · 30yr
- Down + closing
- —
- Monthly P&I
- —
- Monthly cashflow
- —
- DSCR
- —
- Eligible?
- —
Personal DTI + credit; lowest rate.
DSCR
20% down · 8.5% · 30yr
- Down + closing
- —
- Monthly P&I
- —
- Monthly cashflow
- —
- DSCR
- —
- Eligible?
- —
No personal income docs; deal must DSCR.
Hard money
10% down · 12.0% · 12mo
- Down + closing
- —
- Monthly P&I
- —
- Monthly cashflow
- —
- DSCR
- —
- Eligible?
- —
Short-term bridge; refi at stabilization.
Rent comps 15 comps
| Address | Beds | Baths | Sqft | Rent | $/sqft | DOM | Units | Dist |
|---|---|---|---|---|---|---|---|---|
| 1823 Cherokee Dr Salinas, CA | 3.0 | 1.5 | 952 | $3,295 | $3.46 | 13d | 1 | 0.16mi |
| 1450 N 1st St Salinas, CA | 1.0–2.0 | 1.0 | 745 | $2,884 | $3.87 | 13d | 4 | 0.39mi |
| 196 E Alvin Dr Salinas, CA | 1.0–2.0 | 1.0 | 735 | $2,650 | $3.61 | 12d | 2 | 0.47mi |
| 436 Noice Dr Salinas, CA | 1.0–2.0 | 1.0 | 773 | $2,690 | $3.48 | 13d | 12 | 0.55mi |
| 425 W Laurel Dr Salinas, CA | 1.0–2.0 | 1.0–2.0 | 797 | $3,300 | $4.14 | 13d | 11 | 0.87mi |
| 2073 Santa Rita St Salinas, CA | 2.0 | 1.0 | 492 | $2,593 | $5.26 | 2d | 13 | 0.87mi |
| 93 Castro St Salinas, CA | 2.0 | 1.0–2.0 | 828 | $2,400 | $2.90 | 12d | 3 | 0.87mi |
| 417 Tyler Pl Unit B Salinas, CA | 2.0 | 2.0 | 932 | $2,750 | $2.95 | 21d | 1 | 0.88mi |
| 1134 Parkside St Apt 5 Salinas, CA | 2.0 | 1.0 | 750 | $2,145 | $2.86 | 13d | 1 | 0.97mi |
| 2198 Brutus St Salinas, CA | 1.0–2.0 | 1.0–1.5 | 893 | $2,645 | $2.96 | 7d | 2 | 1.10mi |
| 2290 N Main St Salinas, CA | 1.0–3.0 | 1.0–2.0 | 985 | $3,611 | $3.67 | 1d | 13 | 1.27mi |
| 939 Heather Cir Salinas, CA | 1.0–2.0 | 1.0 | 730 | $2,697 | $3.69 | 13d | 16 | 1.31mi |
| 922 Lupin Dr Unit 2 Salinas, CA | 2.0 | 1.0 | 768 | $2,495 | $3.25 | 13d | 1 | 1.42mi |
| 2402 N Main St Salinas, CA | 2.0 | 1.0 | 900 | $2,500 | $2.78 | 13d | 1 | 1.43mi |
| 35 Rosarita Dr Salinas, CA | 1.0–3.0 | 1.0 | 825 | $3,100 | $3.76 | 13d | 3 | 1.46mi |
HOA detail condo
- Monthly dues
- $595 · $7,140/yr
- Assessments
- None detected in remarks — confirm with the listing agent.
Listing history 4 events
-
2026-05-19status Pending
-
2026-05-13$299,000 Active
-
1988-03-10soldstatus $81,500
-
1983-06-29soldstatus $79,000
ⓘ Source: listings_history table (triggers on properties + properties_extension) + one-shot
backfill from property_details.listing_events for pre-trigger history.
Tax reassessment forecast CA · Resets to sale price
- Current annual tax
- $1,898 · $158/mo
- Projected year-2 tax
- $2,272 · $189/mo
- Expected delta
- +$374/yr (+$31/mo · 19.7%)
ⓘ Screening estimate from a state-policy table — verify with the county assessor before closing.
Climate risk First Street
- Flood 1/10 Low FEMA zone X (shaded) · 0% chance over 30 yrs
- Wildfire 1/10 Low
- Heat 3/10 Moderate 6 d/yr ≥81°F today · 12 d/yr by 30 yrs out
- Wind 1/10 Low
- Air quality 7/10 Severe 11 unhealthy d/yr today · 11 by 30 yrs out
Nearby sold comps map
Loading sold comps map…
Walkable amenities ~0.75 mi
Loading nearby amenities…
Taxation est. · year 1
- Rental income
- $35,865
- − Mortgage interest
- −$16,749
- − Property taxes
- −$1,898
- − Insurance
- −$1,495
- − Repairs & maintenance
- −$2,869
- − Management
- −$2,869
- − HOA
- −$7,140
- − Depreciation
- −$8,698
- Taxable loss
- −$5,853
- Est. tax savings @ 24.0%
- +$1,405
- After-tax cash flow
- $389/yr
For passive investors: Depreciation is non-cash, so a rental often shows a tax loss while cash-flowing — sheltering income. Rental losses are passive: they offset passive income freely, and up to $25,000/yr can offset ordinary (W-2) income if you actively participate and your MAGI is under $100k (phasing out to $0 by $150k); unused losses carry forward. On sale, claimed depreciation is recaptured at up to 25%, and gains may owe capital-gains tax (a 1031 exchange can defer both). Figures are a year-1 estimate at your 24.0% rate — not tax advice; consult a CPA.
Schools (NCES district)
- District
- Salinas Union High
- NCES district ID
- 0633980
- Math proficiency
- 23% ▲ 2.00%
- Reading proficiency
- 39% ▲ 1.00%
- Median HH income
- $50,670
- Composite
- 29.86/100
- National rank
- #11691
- State rank
- #998 of 1400 in CA
Livability — Salinas
- Score
- 63/100
- State rank
- #465
- US rank
- #15876
Category grades
Schools grade is shown separately in the Schools card above.
Census & demographics
- Census place
- Salinas, CA
- County
- Monterey County · 241,191 people
- City population
- 119,069
- Metro
- Salinas, CA
- Population (ZIP)
- 64,199
- Household income
- $97,555
- Rent vs Own
- Severe rent burden
- 1736.0
Population outlook (Monterey County) Hauer SSP2
- Today (2025)
- 458,436 people
- By 2030
- 469,418 · +2.4%
- By 2040
- 489,615 · +6.8%
- By 2050
- 506,696 · +10.5%
- By 2075
- 531,048 · +15.8%
- By 2100
- 519,153 · +13.2%
Race, ethnicity, and origin ACS 2023
- Neighborhood character
- Predominantly Hispanic (76%)
- Race & ethnicity
- Hispanic / Latino 76% Two or more races 13% White 13% Asian 7% Black 2%
- Hispanic origin (detail)
- Mexican 70% Salvadoran 1%
- Common ancestry
- Russian 1% Italian 1% Romanian 1%
- Foreign-born
- 33% · Canada, China
- Languages at home
- 33% English-only · Spanish 60% Tagalog/Filipino 2% Chinese 1%
Political lean MEDSL · Monterey
- 2024 margin
- Strong D (+29.9) · D 63.4% · R 33.5% · Other 3.0%
- 2008→2024 swing
- -8.4pp toward R · 2008: 38.3pp · 2024: 29.9pp
- All cycles
- 2024: D+29.9 2020: D+41.3 2016: D+39.7 2012: D+33.9 2008: D+38.3
Not yet ingested
- Civics
- —
Market trends
- HPI YoY
- ▼ -690.60%
- Current HPI
- 262.5003
- Rent YoY
- ▲ 4.87%
- Metro
- Salinas, CA
- State GDP YoY
- ▲ 3.21%
- F500 in state
- 116
Industry mix (Fortune 500 HQ in CA)
| Industry | F500 HQs | Revenue |
|---|---|---|
| Technology | 27 | $1,492B |
|
||
| Financial Services | 3 | $174B |
|
||
| Retail | 3 | $44B |
|
||
| Insurance | 3 | $26B |
|
||
| Media / Entertainment | 2 | $115B |
|
||
| Pharmaceuticals / Biotech | 2 | $62B |
|
||
Price history
+278.5% since first listed4 events — show timeline
- 2026-05-19 Pending — bridgeMLS, Bay East AOR, or Contra Costa AOR
- 2026-05-13 Listed $299,000 bridgeMLS, Bay East AOR, or Contra Costa AOR
- 1988-03-10 Sold (Public Records) $81,500 Public Records
- 1983-06-29 Sold (Public Records) $79,000 Public Records
Property tax history
+2.0%/yrLatest (2025): $1,898 · +9.2% YoY. Source: county tax records.
Cash-flow waterfall
monthlySold comps — $/sqft
last 12 mo · ≤1 miLoading sold comps…