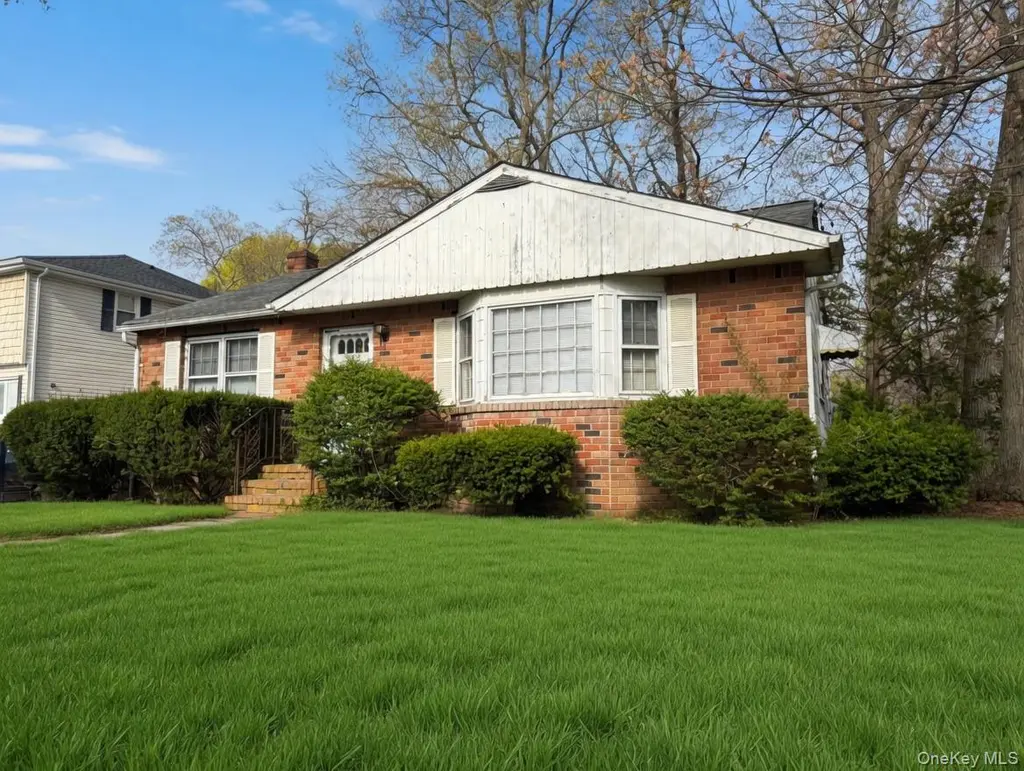
17 Lake Prom · Holbrook, NY
Flood risk 6/10 · Moderate
- FEMA flood zone
- X (unshaded)
- Chance of flooding over 30 yrs
- 0.75%
- Est. flood insurance / yr
- $507 – $1,088
Fire risk 1/10 · Minimal
- Est. fire insurance / yr
- $691 – $1,283
Heat risk 4/10 · Minor
- Hot days now (above 94°F)
- 7 days/yr
- Hot days in 30 yrs
- 15 days/yr
Wind risk 6/10 · Moderate
- Chance of severe wind over 30 yrs
- 77.0%
Air-quality risk 4/10 · Minor
- Unhealthy air days now
- 4 days/yr
- Unhealthy air days in 30 yrs
- 6 days/yr
Risk factors via First Street. Map © Google.
Why this score? — see what drove the C grade
The composite is a weighted blend of 9 inputs, each scored 0–100. Each bar is that input's sub-score; the figure is the points it added to the 100-point composite (weight × sub-score).
- Cash flow +15.8/30.0
- ARV discount +15.0/15.0
- Schools +6.6/10.0
- 1% rule +5.2/10.0
- DSCR +4.9/10.0
- Livability +3.3/5.0
- Rent growth +2.7/5.0
- Condition / age +2.5/5.0
- Appreciation +0.0/10.0
$399,000
🖨 Deal sheet (PDF) 📄 Offer letter ✓ Due diligence
Listing remarks
Great Opportunity To Renovate A Sweet Ranch Home In Perfect Lake Ronkonkoma Location! This Solidly Built Home Offers 3 Good Sized Bedrooms With Large Closets, 1 Full Bath, A Young Architectural Shingle Roof, Large Rear Addition With Outside Entrance, Back Patio, Full Size Attic, Gas Forced Air Heating, All On A Flat Corner Lot That Would Also Support A Much Larger Home. Under A Mile To Lake Ronkonkoma And Major Expressways And 1.5 Miles to The LIRR. Grab Your Spring Project NOW Or Roll Up Your Sleeves And Build Your Sweat Equity Today!
Key facts
- Large rear addition
- Outside entrance
- Full size attic
Tags
Neighborhood map
What this means for you Summary
Snapshot
- This is a 3-bed/1.0-bath single-family listed at $399k.
Deal economics
- At list price, monthly cash flow is $183 ($2k/yr) — positive.
- The deal already cash-flows at list — no discount required.
- Meets the 1% rule at list price ($4k rent vs $399k).
- Cap rate 6.8% vs local median 3.5% in Holbrook — top-decile yield for the area; either an underpriced asset or a hidden risk that comps aren't pricing in. Stress-test before assuming the spread holds.
Location & tenants
- Location reads 66/100 on livability (#658 in NY) — a middle-class / working-renter tenant base. Strengths: employment A+, housing A+; Watch: amenities F, commute F, cost of living F.
- Sachem Central School District (suburban): math 69% / reading 76% proficiency, ranked #86 of 590 in NY (top 15%) — strong family-tenant draw, lease renewals of 3-5y typical; only 15% free/reduced lunch — higher-income household profile.
- Zoned schools: Chippewa Elementary School (math 47% / reading 62%, grade C, #908 of 2,108 statewide, top 46%, 515 students, 25% FRL); Samoset Middle School (math 51% / reading 63%, grade B, #192 of 729 statewide, top 28%, 892 students, 31% FRL); Sachem High School North (math 96% / reading 95%, grade A+, #76 of 1,100 statewide, top 7%, 1,923 students, 25% FRL).
- Market conditions: Rents flat; 175 active listings in the ZIP; 2 comparable units currently listed for rent nearby; high-income renter base; 1,366 units permitted in Suffolk County in 2024 (216 in 5+ unit buildings).
- This rent runs 44% of the median local income ($112k/yr) — at the standard rent-burdened threshold; future hikes will face affordability resistance.
Forward outlook
- Local home prices are declining (-3.0%/yr); year-one equity from $3k of loan paydown is wiped out by about $12k of value loss. Plan a longer hold.
- Suffolk County population projected to shrink 5% by 2050 — rents likely to lag national; underwrite the cash flow, not the appreciation.
Negotiation context
- Only 9 days on market — expect competitive offers; lowballing is unlikely to land.
Risks & watch-outs
- Watch-outs: built in 1953 — expect roof / HVAC / electrical / plumbing capex.
- Climate carrying-cost: major flood risk; major wind risk, 77% chance of damaging wind over 30y — expect insurance premiums to compound above CPI over the hold.
Questions for the listing agent
- Built in 1953 — when were the roof, HVAC, electrical panel, plumbing, and water heater last replaced?
- Is there a deadline driving the sale (1031 exchange, divorce, estate, relocation)? That informs how much negotiation room exists.
- What's the average days-on-market for RENTAL listings here right now (not sales)? A rising rental-DOM trend means longer vacancies and softer asking-rent achievability than the comps imply.
- What's the recent tenant-quality profile in this submarket — average credit score on applications, eviction rate, late-payment / NSF rate, and stable-employment percentage? A property-management company in the area should have these aggregated.
- How much new for-sale + rental construction is in the pipeline within 1–3 miles? Heavy new supply typically softens prices + rents 12–24 months out; constrained supply supports both.
Investment metrics
- 1% rule
- 1.02% ✓
- Cap rate
- 6.84%
- Cash-on-cash
- 1.97%
- DSCR
- 1.09
- GRM
- 8.1
CMA / ARV
- ARV (on-the-fly)
- $747,648
- Comps found
- 12
Show comp detail 12 sales within ~0.75 mi
| Address | Dist | Beds/Ba | Sqft | Sold | Price | $/sf | Match |
|---|---|---|---|---|---|---|---|
| 6 Center St | 0.35mi | 3/2.0 | 2,000 (-5%) | 7mo | $665,000 | $333 | 65 |
| 27 Donald St | 0.41mi | 4/2.0 (+1) | 2,200 (+4%) | 7mo | $725,000 | $330 | 59 |
| 16 Tarkington Rd | 0.55mi | 4/1.5 (+1) | 2,200 (+4%) | 8mo | $700,000 | $318 | 54 |
| 2 Richard Pl | 0.23mi | 4/3.0 (+1) | 1,830 (-13%) | 5mo | $714,000 | $390 | 50 |
| 150 Coates Ave N | 0.60mi | 4/3.0 (+1) | 2,134 (+1%) | 9mo | $690,000 | $323 | 49 |
| 22 Hollo Dr | 0.68mi | 4/2.0 (+1) | 2,062 (-2%) | 8mo | $730,000 | $354 | 49 |
| 2 Alan St | 0.38mi | 4/2.0 (+1) | 1,852 (-12%) | 6mo | $695,000 | $375 | 47 |
| 25 Windham Ln | 0.66mi | 4/1.5 (+1) | 1,925 (-9%) | 1mo | $630,000 | $327 | 46 |
| 45 Marc St | 0.63mi | 4/2.5 (+1) | 2,039 (-4%) | 12mo | $720,000 | $353 | 44 |
| 25 Lincoln Ave | 0.70mi | 4/2.0 (+1) | 1,937 (-8%) | 3mo | $735,000 | $379 | 42 |
| 9 Jamar Ln | 0.59mi | 4/1.5 (+1) | 1,836 (-13%) | 9mo | $690,000 | $376 | 36 |
| 110 Geery Ave | 0.54mi | 4/2.5 (+1) | 1,800 (-15%) | 10mo | $750,000 | $417 | 31 |
Match score weights: distance 35% · size 25% · config 20% · recency 20%. Top-matched comps best support the ARV.
Projected returns pro-forma
-3.0% appreciation · 0.79% rent growth · sell at horizon
- IRR
- -15.9%
- Equity multiple
- 0.45×
- Total profit
- $-61,643
- Equity at exit
- $59,492
- IRR
- -12.3%
- Equity multiple
- 0.35×
- Total profit
- $-72,582
- Equity at exit
- $34,498
Cash invested: $111,720 (down + closing). Projections, not guarantees.
Landlord ↔ Tenant lean methodology
- Overall (STATE)
- 15 Strongly Tenant-Friendly
- State New York
- 15 Strongly Tenant-Friendly · D+10
- County
- — inherits STATE
- City
- — inherits STATE
ZIP-level market 11779
- Rents YoY
- 0.8%
- Active inventory
- 175
- Price-to-rent
- 8.1×
Monthly cashflow live
- Estimated rent
- $4,084 medium interval (Pro) →
- Mortgage (P&I)
- −$2,092
- Tax from tax record
- −$785 /mo · $9,420/yr
- Insurance
- −$166
- HOA
- −$0
- Vacancy / Maint / Mgmt
- −$858
- Net cashflow
- $183
Break-even live
Sensitivity live
| Price | -10% $409 | -5% $296 | +0% $183 | +5% $70 | +10% $-43 |
|---|---|---|---|---|---|
| Rent | -10% $-140 | -5% $22 | +0% $183 | +5% $344 | +10% $506 |
| Rate | -1.0pp $384 | -0.5pp $285 | base $183 | +0.5pp $80 | +1.0pp $-25 |
UW: 25.0% down · 7.5% · 30yr · 1.5% tax · 5.0% vac · 8.0% maint · 8.0% mgmt
Financing live
Cash to close
- Down payment
- $99,750
- Closing costs
- $11,970
- Reserves months
- —
- Total cash needed
- —
Loan-product check · same deal, 3 products live
Conventional
25% down · 7.5% · 30yr
- Down + closing
- —
- Monthly P&I
- —
- Monthly cashflow
- —
- DSCR
- —
- Eligible?
- —
Personal DTI + credit; lowest rate.
DSCR
20% down · 8.5% · 30yr
- Down + closing
- —
- Monthly P&I
- —
- Monthly cashflow
- —
- DSCR
- —
- Eligible?
- —
No personal income docs; deal must DSCR.
Hard money
10% down · 12.0% · 12mo
- Down + closing
- —
- Monthly P&I
- —
- Monthly cashflow
- —
- DSCR
- —
- Eligible?
- —
Short-term bridge; refi at stabilization.
Rent comps 2 comps
| Address | Beds | Baths | Sqft | Rent | $/sqft | DOM | Units | Dist |
|---|---|---|---|---|---|---|---|---|
| 2 Hawkins Ave Lake Ronkonkoma, NY | 3.0 | 1.0–2.0 | 959 | $5,009 | $5.22 | 0d | 130 | 1.23mi |
| 16 Birch Dr Ronkonkoma, NY | 3.0 | 2.0 | 1536 | $4,250 | $2.77 | 25d | 1 | 1.41mi |
Listing history 5 events
-
2026-05-08status Pending
-
2026-04-20$399,000 Active
-
2004-09-23soldstatus $350,000
-
2000-04-06soldstatus $165,000
-
1998-05-28soldstatus $169,000
ⓘ Source: listings_history table (triggers on properties + properties_extension) + one-shot
backfill from property_details.listing_events for pre-trigger history.
Tax reassessment forecast NY · Partial reset (capped growth)
- Current annual tax
- $9,420 · $785/mo
- Projected year-2 tax
- $9,420 · $785/mo
- Expected delta
- $0/yr ($0/mo · 0.0%)
ⓘ Screening estimate from a state-policy table — verify with the county assessor before closing.
Climate risk First Street
- Flood 6/10 Major FEMA zone X (unshaded) · 75% chance over 30 yrs
- Wildfire 1/10 Low
- Heat 4/10 Moderate 7 d/yr ≥94°F today · 15 d/yr by 30 yrs out
- Wind 6/10 Major 77% chance of damaging wind over 30 yrs
- Air quality 4/10 Moderate 4 unhealthy d/yr today · 6 by 30 yrs out
Nearby sold comps map
Loading sold comps map…
Walkable amenities ~0.75 mi
Loading nearby amenities…
Taxation est. · year 1
- Rental income
- $49,014
- − Mortgage interest
- −$22,350
- − Property taxes
- −$9,420
- − Insurance
- −$1,995
- − Repairs & maintenance
- −$3,921
- − Management
- −$3,921
- − Depreciation
- −$11,607
- Taxable loss
- −$4,201
- Est. tax savings @ 24.0%
- +$1,008
- After-tax cash flow
- $3,205/yr
For passive investors: Depreciation is non-cash, so a rental often shows a tax loss while cash-flowing — sheltering income. Rental losses are passive: they offset passive income freely, and up to $25,000/yr can offset ordinary (W-2) income if you actively participate and your MAGI is under $100k (phasing out to $0 by $150k); unused losses carry forward. On sale, claimed depreciation is recaptured at up to 25%, and gains may owe capital-gains tax (a 1031 exchange can defer both). Figures are a year-1 estimate at your 24.0% rate — not tax advice; consult a CPA.
Schools (NCES district)
- District
- Sachem Central School District
- NCES district ID
- 3625350
- Math proficiency
- 69% ▬ 0.00%
- Reading proficiency
- 76% ▲ 12.00%
- Median HH income
- $92,968
- Composite
- 65.53/100
- National rank
- #472
- State rank
- #86 of 590 in NY
Livability — Holbrook
- Score
- 66/100
- State rank
- #658
- US rank
- #12283
Category grades
Schools grade is shown separately in the Schools card above.
Census & demographics
- Census place
- Holbrook, NY
- County
- Suffolk County · 679,920 people
- City population
- 26,667
- Metro
- New York-Newark-Jersey City, NY-NJ-PA
- Population (ZIP)
- 38,206
- Household income
- $112,180
- Rent vs Own
- Severe rent burden
- 874.0
Population outlook (Suffolk County) Hauer SSP2
- Today (2025)
- 1,505,262 people
- By 2030
- 1,498,318 · -0.5%
- By 2040
- 1,471,101 · -2.3%
- By 2050
- 1,424,848 · -5.3%
- By 2075
- 1,337,157 · -11.2%
- By 2100
- 1,217,720 · -19.1%
Race, ethnicity, and origin ACS 2023
- Neighborhood character
- Predominantly White (67%)
- Race & ethnicity
- White 67% Hispanic / Latino 19% Two or more races 9% Asian 7% Black 5%
- Hispanic origin (detail)
- Puerto Rican 7% Dominican 1%
- Common ancestry
- Romanian 4% Scotch-Irish 1% Lithuanian 1%
- Foreign-born
- 14% · Canada, Jamaica, China
- Languages at home
- 79% English-only · Spanish 10% Other Indo-European 7% Other Asian/Pacific 1%
Political lean MEDSL · Suffolk
- 2024 margin
- Lean R (+10.0) · D 45.0% · R 55.0%
- 2008→2024 swing
- -16.0pp toward R · 2008: 6.0pp · 2024: -10.0pp
- All cycles
- 2024: R+10.0 2020: R+0.0 2016: R+8.2 2012: D+2.9 2008: D+6.0
Not yet ingested
- Civics
- —
Market trends
- HPI YoY
- ▼ -569.98%
- Current HPI
- 350.0973
- Rent YoY
- ▲ 0.79%
- Metro
- New York-Newark-Jersey City, NY-NJ-PA
- State GDP YoY
- ▲ 2.60%
- F500 in state
- 92
Industry mix (Fortune 500 HQ in NY)
| Industry | F500 HQs | Revenue |
|---|---|---|
| Financial Services | 10 | $950B |
|
||
| Consumer Goods | 9 | $162B |
|
||
| Insurance | 4 | $225B |
|
||
| Telecommunications | 2 | $144B |
|
||
| Pharmaceuticals | 2 | $112B |
|
||
| Media / Entertainment | 2 | $69B |
|
||
Price history
+136.1% since first listed5 events — show timeline
- 2026-05-08 Pending — OneKey® MLS as Distributed by MLS Grid
- 2026-04-20 Listed $399,000 OneKey® MLS as Distributed by MLS Grid
- 2004-09-23 Sold (Public Records) $350,000 Public Records
- 2000-04-06 Sold (Public Records) $165,000 Public Records
- 1998-05-28 Sold (Public Records) $169,000 Public Records
Property tax history
+1.8%/yrLatest (2025): $9,420 · +0.0% YoY. Source: county tax records.
Cash-flow waterfall
monthlySold comps — $/sqft
last 12 mo · ≤1 miLoading sold comps…