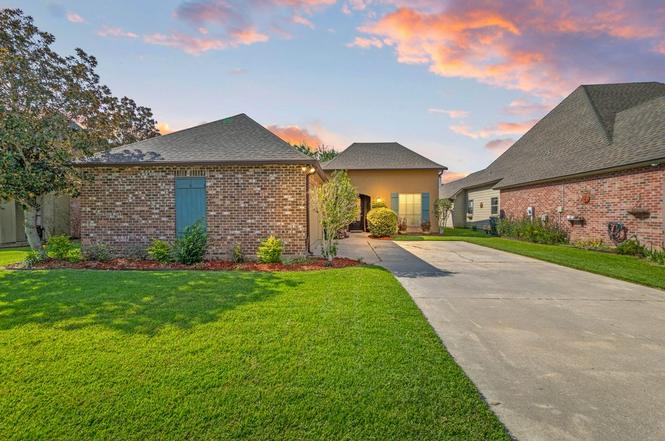
120 Baltic St · Scott, LA
Flood risk 1/10 · Minimal
- FEMA flood zone
- X (unshaded)
- Chance of flooding over 30 yrs
- 0.0%
- Est. flood insurance / yr
- $507 – $1,088
Fire risk 3/10 · Minor
- Est. fire insurance / yr
- $1,269 – $2,357
Heat risk 9/10 · Severe
- Hot days now (above 109°F)
- 7 days/yr
- Hot days in 30 yrs
- 22 days/yr
Wind risk 9/10 · Severe
- Chance of severe wind over 30 yrs
- 99.0%
Air-quality risk 1/10 · Minimal
- Unhealthy air days now
- 0 days/yr
- Unhealthy air days in 30 yrs
- 0 days/yr
Risk factors via First Street. Map © Google.
Why this score? — see what drove the F grade
The composite is a weighted blend of 9 inputs, each scored 0–100. Each bar is that input's sub-score; the figure is the points it added to the 100-point composite (weight × sub-score).
- ARV discount +9.4/15.0
- Cash flow +7.4/30.0
- Schools +3.6/10.0
- Rent growth +3.5/5.0
- Livability +3.3/5.0
- Condition / age +2.5/5.0
- DSCR +1.6/10.0
- 1% rule +1.5/10.0
- Appreciation +0.0/10.0
$267,000
🖨 Deal sheet 📄 Offer letter ✓ Due diligence
Listing remarks
One owner home. Well-maintained home on the middle street of the quiet neighborhood of Emerald Gardens. Upon entering the home, you will be welcomed through a well designed open foyer with arched entry and an open floor plan. To the right is the formal dining area. Perfect spacious area to host family and friends. To the left, is the hallway leading to the guest bedrooms with walk-in closets, guest bathroom, designated office, and laundry room. The end of the hallway leads to the two car garage measuring over 600 sqft. From the front entrance, the floor plan is completely open to the large living room and kitchen. The kitchen is every chef's dream! Updated appliances, including a 5-burner g
Key facts
- Updated appliances
- Large living room
- Formal dining area
Tags
Property features AI
Exterior
- Home design: House
- Exterior features: Lot approximately 6,953 sq ft
Neighborhood map
What this means for you Summary
Snapshot
- This is a 3-bed/2.0-bath single-family listed at $267k.
Deal economics
- At list price, monthly cash flow is $-342 ($-4k/yr) — negative.
- To cash-flow at today's rent, offer at most $207k (22.6% below list).
- To meet the 1% rule (rent ≥ 1% of price), the offer needs to be $173k (35.3% below list).
- Recommended offer: $173k (35.3% below list) — sets the bar for 1% rule.
Location & tenants
- Location reads 66/100 on livability (#116 in LA) — a middle-class / working-renter tenant base. Strengths: cost of living A+, health & safety A+, schools B+; Watch: crime F, amenities F, commute F.
- Lafayette Parish (urban): math 38% / reading 46% proficiency, ranked #19 of 98 in LA (top 19%) — families likely to look elsewhere, expect single-tenant / working-renter base with shorter leases.
- Market conditions: Rents rising fast (+4.1%/yr); 404 active listings in the ZIP; 1 comparable units currently listed for rent nearby; 1,585 units permitted in Lafayette Parish in 2024 (10 in 5+ unit buildings).
- This rent runs 36% of the median local income ($57k/yr) — at the standard rent-burdened threshold; future hikes will face affordability resistance.
Forward outlook
- Local home prices are declining (-3.0%/yr); year-one equity from $2k of loan paydown is wiped out by about $8k of value loss. Plan a longer hold.
- Lafayette County population projected at +34% by 2050 — long-run rental-demand tailwind backs the buy-and-hold thesis.
Negotiation context
- It's been on market 39 days — a 3% lower offer ($259k) is reasonable based on typical stale-listing flexibility.
- 2 sale attempts since 20y ago with the ask held roughly flat each time — persistent listings suggest the price (not the market) is what's stuck; bring a comps-based counter.
Risks & watch-outs
- Climate carrying-cost: severe wind risk, 99% chance of damaging wind over 30y; extreme-heat days projected 7→22/yr by 2055 (HVAC capex compounding) — expect insurance premiums to compound above CPI over the hold.
Questions for the listing agent
- What do current leases actually rent for vs. the listed asking? Can we see a recent rent roll and the last 12 months of T-12 income?
- It's been on market 39 days. Have you received any prior offers? Is the seller open to a 35% concession, seller financing, or rate buy-down credit?
- Is there a deadline driving the sale (1031 exchange, divorce, estate, relocation)? That informs how much negotiation room exists.
- Schools are B-rated — typically a magnet for longer-tenancy family renters. What's the average tenant stay here, and is there a school-zone premium baked into asking?
- Crime grade is F in this area — have there been break-ins, vandalism, or insurance claims at this property in the last 3 years? What carrier currently insures it and at what premium?
- The area grade is low — what's the realistic commute time and amenity access for the typical tenant pool here? Any planned neighborhood developments (good or bad) we should know about?
- What's the average days-on-market for RENTAL listings here right now (not sales)? A rising rental-DOM trend means longer vacancies and softer asking-rent achievability than the comps imply.
- What's the recent tenant-quality profile in this submarket — average credit score on applications, eviction rate, late-payment / NSF rate, and stable-employment percentage? A property-management company in the area should have these aggregated.
- How much new for-sale + rental construction is in the pipeline within 1–3 miles? Heavy new supply typically softens prices + rents 12–24 months out; constrained supply supports both.
Investment metrics
- 1% rule
- 0.65% ✗
- Cap rate
- 4.76%
- Cash-on-cash
- -5.48%
- DSCR
- 0.76
- GRM
- 12.9
CMA / ARV
- ARV (on-the-fly)
- $278,586
- Comps found
- 12
Show comp detail 12 sales within ~0.75 mi
| Address | Dist | Beds/Ba | Sqft | Sold | Price | $/sf | Match |
|---|---|---|---|---|---|---|---|
| 123 Baltic St | 0.04mi | 4/2.0 (+1) | 2,053 (-1%) | 8mo | $275,000 | $134 | 84 |
| 117 Larry St | 0.17mi | 3/2.0 | 1,800 (-13%) | 0mo | $175,000 | $97 | 69 |
| 116 Onyx St | 0.09mi | 3/2.0 | 1,877 (-10%) | 14mo | $257,000 | $137 | 68 |
| 100 Sheridan Dr | 0.67mi | 3/2.0 | 2,113 (+2%) | 2mo | $223,000 | $106 | 64 |
| 117 Silver Medal Dr | 0.63mi | 3/2.0 | 2,098 (+1%) | 6mo | $262,500 | $125 | 64 |
| 109 Kohen Luke Dr | 0.17mi | 3/2.0 | 1,768 (-15%) | 6mo | $190,500 | $108 | 62 |
| 240 Ivory St | 0.08mi | 3/2.0 | 1,774 (-15%) | 14mo | $245,000 | $138 | 60 |
| 134 Emerald Star Ln | 0.16mi | 4/2.0 (+1) | 1,874 (-10%) | 23mo | $250,000 | $133 | 52 |
| 208 Long Creek Ln | 0.62mi | 4/2.0 (+1) | 1,873 (-10%) | 1mo | $289,999 | $155 | 49 |
| 200 Long Creek Ln | 0.60mi | 4/2.5 (+1) | 1,895 (-9%) | 12mo | $294,500 | $155 | 40 |
| 102 Breckenridge Loop | 0.61mi | 3/2.5 | 2,316 (+11%) | 15mo | $180,000 | $78 | 38 |
| 102 Long Creek Ln | 0.61mi | 4/2.0 (+1) | 1,816 (-13%) | 15mo | $288,900 | $159 | 33 |
Match score weights: distance 35% · size 25% · config 20% · recency 20%. Top-matched comps best support the ARV.
Projected returns pro-forma
-3.0% appreciation · 4.12% rent growth · sell at horizon
- IRR
- -24.6%
- Equity multiple
- 0.16×
- Total profit
- $-63,110
- Equity at exit
- $39,811
- IRR
- -17.6%
- Equity multiple
- -0.00×
- Total profit
- $-74,944
- Equity at exit
- $23,085
Cash invested: $74,760 (down + closing). Projections, not guarantees.
Landlord ↔ Tenant lean methodology
- Overall (STATE)
- 90 Strongly Landlord-Friendly
- State Louisiana
- 90 Strongly Landlord-Friendly · R+12
- County
- — inherits STATE
- City
- — inherits STATE
ZIP-level market 70506
- Home prices YoY
- -34.8%
- Rents YoY
- 4.1%
- Active inventory
- 404
- Price-to-rent
- 12.9×
Monthly cashflow live
- Estimated rent
- $1,727 medium interval (Pro) →
- Mortgage (P&I)
- −$1,400
- Tax from tax record
- −$195 /mo · $2,335/yr
- Insurance
- −$111
- HOA
- −$0
- Vacancy / Maint / Mgmt
- −$363
- Net cashflow
- $-342
Break-even live
UW: 25.0% down · 7.5% · 30yr · 1.5% tax · 5.0% vac · 8.0% maint · 8.0% mgmt
Financing live
Cash to close
- Down payment
- $66,750
- Closing costs
- $8,010
- Reserves months
- —
- Total cash needed
- —
Loan-product check · same deal, 3 products live
Conventional
25% down · 7.5% · 30yr
- Down + closing
- —
- Monthly P&I
- —
- Monthly cashflow
- —
- DSCR
- —
- Eligible?
- —
Personal DTI + credit; lowest rate.
DSCR
20% down · 8.5% · 30yr
- Down + closing
- —
- Monthly P&I
- —
- Monthly cashflow
- —
- DSCR
- —
- Eligible?
- —
No personal income docs; deal must DSCR.
Hard money
10% down · 12.0% · 12mo
- Down + closing
- —
- Monthly P&I
- —
- Monthly cashflow
- —
- DSCR
- —
- Eligible?
- —
Short-term bridge; refi at stabilization.
Rent comps 1 comps
| Address | Beds | Baths | Sqft | Rent | $/sqft | DOM | Units | Dist |
|---|---|---|---|---|---|---|---|---|
| 401 Pinto St Lafayette, LA | 3.0 | 2.0 | 1601 | $2,300 | $1.44 | 43d | 1 | 0.10mi |
Listing history 5 events
-
2025-12-03soldstatus $259,000
-
2025-11-09historical Under Contract
-
2025-10-01$267,000 Active
-
2008-01-14soldstatus
-
2006-06-20$241,000
ⓘ Source: listings_history table (triggers on properties + properties_extension) + one-shot
backfill from property_details.listing_events for pre-trigger history.
Tax reassessment forecast LA · Resets to sale price
- Current annual tax
- $2,335 · $195/mo
- Projected year-2 tax
- $2,335 · $195/mo
- Expected delta
- $0/yr ($0/mo · 0.0%)
ⓘ Screening estimate from a state-policy table — verify with the county assessor before closing.
Climate risk First Street
- Flood 1/10 Low FEMA zone X (unshaded) · 0% chance over 30 yrs
- Wildfire 3/10 Moderate
- Heat 9/10 Extreme 7 d/yr ≥109°F today · 22 d/yr by 30 yrs out
- Wind 9/10 Extreme 99% chance of damaging wind over 30 yrs
- Air quality 1/10 Low 0 unhealthy d/yr today · 0 by 30 yrs out
Nearby sold comps map
Loading sold comps map…
Walkable amenities ~0.75 mi
Loading nearby amenities…
Taxation est. · year 1
- Rental income
- $20,726
- − Mortgage interest
- −$14,956
- − Property taxes
- −$2,335
- − Insurance
- −$1,335
- − Repairs & maintenance
- −$1,658
- − Management
- −$1,658
- − Depreciation
- −$7,767
- Taxable loss
- −$8,983
- Est. tax savings @ 24.0%
- +$2,156
- After-tax cash flow
- $-1,942/yr
For passive investors: Depreciation is non-cash, so a rental often shows a tax loss while cash-flowing — sheltering income. Rental losses are passive: they offset passive income freely, and up to $25,000/yr can offset ordinary (W-2) income if you actively participate and your MAGI is under $100k (phasing out to $0 by $150k); unused losses carry forward. On sale, claimed depreciation is recaptured at up to 25%, and gains may owe capital-gains tax (a 1031 exchange can defer both). Figures are a year-1 estimate at your 24.0% rate — not tax advice; consult a CPA.
Schools (NCES district)
- District
- Lafayette Parish
- NCES district ID
- 2200870
- Math proficiency
- 38% ▼ -32.00%
- Reading proficiency
- 46% ▼ -24.00%
- Median HH income
- $50,238
- Composite
- 36.15/100
- National rank
- #4741
- State rank
- #19 of 98 in LA
Livability — Scott
- Score
- 66/100
- State rank
- #116
- US rank
- #11265
Category grades
Schools grade is shown separately in the Schools card above.
Census & demographics
- Census place
- Scott, LA
- County
- Lafayette Parish · 207,544 people
- City population
- 158,114
- Metro
- Lafayette, LA
- Population (ZIP)
- 42,318
- Household income
- $57,379
- Rent vs Own
- Severe rent burden
- 2095.0
Population outlook (Lafayette County) Hauer SSP2
- Today (2025)
- 280,930 people
- By 2030
- 301,092 · +7.2%
- By 2040
- 339,456 · +20.8%
- By 2050
- 375,156 · +33.5%
- By 2075
- 451,672 · +60.8%
- By 2100
- 497,203 · +77.0%
Race, ethnicity, and origin ACS 2023
- Neighborhood character
- Diverse neighborhood (Simpson 0.58)
- Race & ethnicity
- White 60% Black 20% Hispanic / Latino 13% Two or more races 13% Asian 3%
- Hispanic origin (detail)
- Mexican 4%
- Common ancestry
- Lithuanian 18% Armenian 1% Slovak 1%
- Foreign-born
- 12% · Canada, Vietnam
- Languages at home
- 83% English-only · Spanish 9% French/Haitian/Cajun 3% Vietnamese 1%
Political lean MEDSL · Lafayette
- 2024 margin
- Solid R (+31.4) · D 33.5% · R 64.8% · Other 1.7%
- 2008→2024 swing
- -0.1pp no change · 2008: -31.3pp · 2024: -31.4pp
- All cycles
- 2024: R+31.4 2020: R+28.7 2016: R+33.6 2012: R+33.7 2008: R+31.3
Not yet ingested
- Civics
- —
Market trends
- HPI YoY
- ▼ -75.28%
- Current HPI
- 140.8445
- Rent YoY
- ▲ 4.12%
- Metro
- Lafayette, LA
- State GDP YoY
- ▲ 3.29%
- F500 in state
- 10
Industry mix (Fortune 500 HQ in LA)
| Industry | F500 HQs | Revenue |
|---|---|---|
| Telecommunications | 2 | $23B |
|
||
| Utilities | 1 | $12B |
|
||
| Wholesale / Distribution | 1 | $5B |
|
||
| Advertising | 1 | $2B |
|
||
Price history
+7.5% since first listed5 events — show timeline
- 2025-12-03 Sold (Public Records) $259,000 Public Records
- 2025-11-09 Contingent — ForSaleByOwner.com
- 2025-10-01 Listed $267,000 ForSaleByOwner.com
- 2008-01-14 Sold (Public Records) — Public Records
- 2006-06-20 Listed $241,000 AcadianaMLS
Property tax history
+3.9%/yrLatest (2025): $2,335 · -1.3% YoY. Source: county tax records.
Cash-flow waterfall
monthlySold comps — $/sqft
last 12 mo · ≤1 miLoading sold comps…