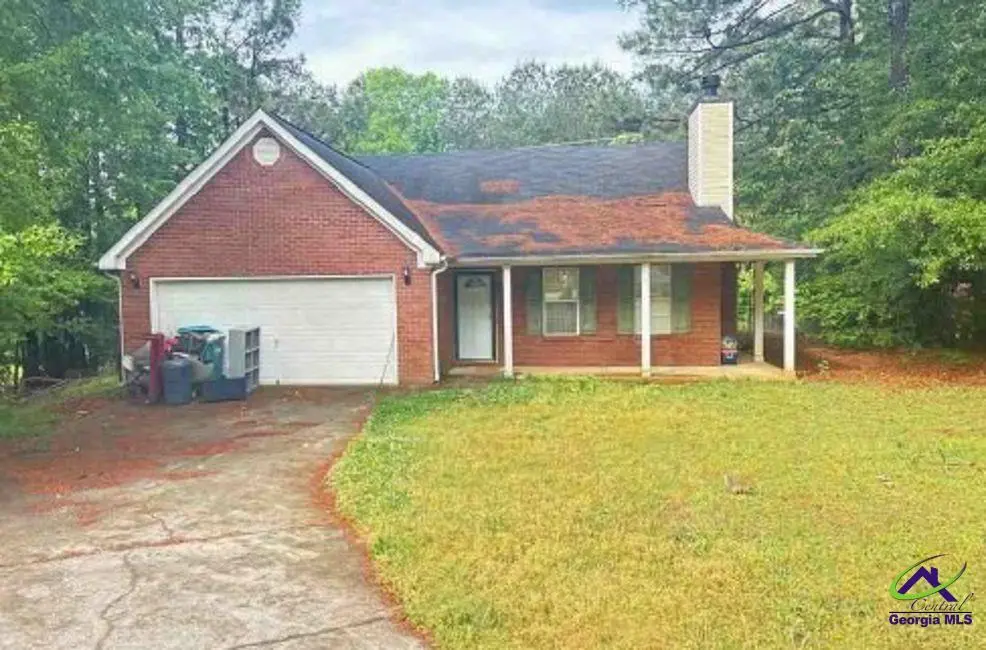
208 Drake Elm Ct · Hampton, GA
Flood risk 1/10 · Minimal
- FEMA flood zone
- X (unshaded)
- Chance of flooding over 30 yrs
- 0.0%
- Est. flood insurance / yr
- $507 – $1,088
Fire risk 3/10 · Minor
- Est. fire insurance / yr
- $963 – $1,789
Heat risk 6/10 · Moderate
- Hot days now (above 105°F)
- 7 days/yr
- Hot days in 30 yrs
- 17 days/yr
Wind risk 6/10 · Moderate
- Chance of severe wind over 30 yrs
- 27.0%
Air-quality risk 4/10 · Minor
- Unhealthy air days now
- 4 days/yr
- Unhealthy air days in 30 yrs
- 5 days/yr
Risk factors via First Street. Map © Google.
Why this score? — see what drove the C grade
The composite is a weighted blend of 9 inputs, each scored 0–100. Each bar is that input's sub-score; the figure is the points it added to the 100-point composite (weight × sub-score).
- Cash flow +19.5/30.0
- ARV discount +15.0/15.0
- DSCR +6.2/10.0
- 1% rule +6.1/10.0
- Livability +3.2/5.0
- Rent growth +3.1/5.0
- Schools +2.6/10.0
- Condition / age +2.5/5.0
- Appreciation +0.0/10.0
$188,500
🖨 Deal sheet (PDF) 📄 Offer letter ✓ Due diligence
Listing remarks
Offers to be placed on Xome.com. Interior inspections are not available, do not trespass! Forward all inquiries and questions to Xome Customer Service . NO REPRESENTATION TO VALIDITY OF INFORMATION IS MADE, BUYER TO VERIFY ALL INFORMATION WHERIN.
Key facts
- 0.94 acre lot
- 2 garage spots
- Built 1999
Property features AI
Exterior
- Parking: Attached 2-car garage (2 covered spaces, 2 total parking spaces)
- Utilities: Sewer: Unknown
- Home design: Single-family residence; One level
- Construction: Brick construction
- Exterior features: Deck
Interior
- Bathrooms: 2 full bathrooms
- Heating & cooling: Heating available (see remarks for details)
- Interior features: Fireplace (1)
Neighborhood map
What this means for you Summary
Snapshot
- This is a 3-bed/2.0-bath single-family listed at $188k.
Deal economics
- At list price, monthly cash flow is $213 ($3k/yr) — positive.
- The deal already cash-flows at list — no discount required.
- Meets the 1% rule at list price ($2k rent vs $188k).
- Recommended offer: $186k (1.5% below list) — sets the bar for market timing.
- Cap rate 7.6% vs local median 4.5% in Hampton — top-decile yield for the area; either an underpriced asset or a hidden risk that comps aren't pricing in. Stress-test before assuming the spread holds.
Location & tenants
- Location reads 65/100 on livability (#213 in GA) — a middle-class / working-renter tenant base. Strengths: cost of living A+, housing A+, crime A-; Watch: amenities F, commute F, health & safety F.
- Henry County (rural): math 24% / reading 33% proficiency, ranked #89 of 174 in GA (top 51%) — low school quality limits family demand, transient renter base, plan for 1-2y turnover.
- Zoned schools: Rocky Creek Elementary (math 29% / reading 35%, grade F, #582 of 1,228 statewide, top 50%, 663 students, 49% FRL); Hampton Middle School (math 18% / reading 33%, grade F, #288 of 470 statewide, top 62%, 850 students, 62% FRL); Hampton High School (math 22% / reading 34%, grade F, #151 of 424 statewide, top 36%, 1,265 students, 50% FRL).
- Market conditions: Rents rising (+2.2%/yr); 561 active listings in the ZIP; 9 comparable units currently listed for rent nearby; rentals at typical pace (median 24d on market — plan ~3-4 weeks tenant-placement turnaround); solid renter incomes; 1,989 units permitted in Henry County in 2024 (92 in 5+ unit buildings).
- This rent runs 30% of the median local income ($83k/yr) — at the standard rent-burdened threshold; future hikes will face affordability resistance.
Forward outlook
- Local home prices are declining (-3.0%/yr); year-one equity from $1k of loan paydown is wiped out by about $6k of value loss. Plan a longer hold.
- Henry County population projected at +29% by 2050 — long-run rental-demand tailwind backs the buy-and-hold thesis.
Negotiation context
- It's been on market 22 days — a 2% lower offer ($186k) is reasonable based on typical stale-listing flexibility.
- Current owner paid $146k; 29% above their basis — modest negotiation headroom, anchor on the comps not their cost.
Risks & watch-outs
- Climate carrying-cost: major wind risk, 27% chance of damaging wind over 30y; extreme-heat days projected 7→17/yr by 2055 (HVAC capex compounding) — expect insurance premiums to compound above CPI over the hold.
Questions for the listing agent
- Is there a deadline driving the sale (1031 exchange, divorce, estate, relocation)? That informs how much negotiation room exists.
- Schools are F-rated, which usually means shorter tenancies and higher turnover. Who's the typical renter profile here, and what's been the actual vacancy rate?
- What's the average days-on-market for RENTAL listings here right now (not sales)? A rising rental-DOM trend means longer vacancies and softer asking-rent achievability than the comps imply.
- What's the recent tenant-quality profile in this submarket — average credit score on applications, eviction rate, late-payment / NSF rate, and stable-employment percentage? A property-management company in the area should have these aggregated.
- How much new for-sale + rental construction is in the pipeline within 1–3 miles? Heavy new supply typically softens prices + rents 12–24 months out; constrained supply supports both.
Investment metrics
- 1% rule
- 1.11% ✓
- Cap rate
- 7.65%
- Cash-on-cash
- 4.84%
- DSCR
- 1.22
- GRM
- 7.5
CMA / ARV
- ARV (median comp)
- $272,658
- List price
- $188,500
- Delta
- -30.87%
- Verdict
- UNDERPRICED
- Comps
- 20 within 1.0 mi
Show comp detail 12 sales within ~0.75 mi
| Address | Dist | Beds/Ba | Sqft | Sold | Price | $/sf | Match |
|---|---|---|---|---|---|---|---|
| 130 Elm St | 0.14mi | 3/2.0 | 1,511 (+1%) | 10mo | $176,650 | $117 | 83 |
| 126 Elmwood Dr | 0.19mi | 3/2.0 | 1,318 (-12%) | 7mo | $250,000 | $190 | 66 |
| 25 Mcdonough St | 0.61mi | 3/2.0 | 1,507 (+1%) | 7mo | $289,000 | $192 | 64 |
| 248 Fern Ct | 0.34mi | 3/2.0 | 1,310 (-12%) | 2mo | $220,000 | $168 | 62 |
| 6 Derrick St | 0.55mi | 3/2.0 | 1,389 (-7%) | 1mo | $108,000 | $78 | 61 |
| 162 Olde Hampton Way | 0.61mi | 3/2.0 | 1,568 (+5%) | 2mo | $242,000 | $154 | 61 |
| 64 Dogwood Lakes Dr | 0.53mi | 3/2.0 | 1,372 (-8%) | 1mo | $257,000 | $187 | 61 |
| 1904 Elm Park Dr | 0.54mi | 3/2.5 | 1,420 (-5%) | 5mo | $225,000 | $158 | 60 |
| 2012 Elm Grove Ln | 0.59mi | 3/2.0 | 1,589 (+6%) | 4mo | $256,000 | $161 | 58 |
| 2040 Elm Grove Ln | 0.43mi | 3/2.0 | 1,294 (-13%) | 4mo | $245,000 | $189 | 55 |
| 1903 Elm Park Dr | 0.57mi | 3/2.0 | 1,279 (-14%) | 2mo | $235,000 | $184 | 48 |
| 64 Dogwood Rdg | 0.51mi | 3/2.0 | 1,694 (+13%) | 10mo | $270,000 | $159 | 46 |
Match score weights: distance 35% · size 25% · config 20% · recency 20%. Top-matched comps best support the ARV.
Projected returns pro-forma
-3.0% appreciation · 2.2% rent growth · sell at horizon
- IRR
- -9.7%
- Equity multiple
- 0.65×
- Total profit
- $-18,547
- Equity at exit
- $28,106
- IRR
- -1.4%
- Equity multiple
- 0.91×
- Total profit
- $-4,970
- Equity at exit
- $16,298
Cash invested: $52,780 (down + closing). Projections, not guarantees.
Landlord ↔ Tenant lean methodology
- Overall (STATE)
- 90 Strongly Landlord-Friendly
- State Georgia
- 90 Strongly Landlord-Friendly · R+3
- County
- — inherits STATE
- City
- — inherits STATE
ZIP-level market 30228
- Home prices YoY
- -24.3%
- Rents YoY
- 2.2%
- Active inventory
- 561
- Price-to-rent
- 7.5×
Monthly cashflow live
- Estimated rent
- $2,088 high interval (Pro) →
- Mortgage (P&I)
- −$989
- Tax from tax record
- −$370 /mo · $4,437/yr
- Insurance
- −$79
- HOA
- −$0
- Vacancy / Maint / Mgmt
- −$439
- Net cashflow
- $213
Break-even live
Sensitivity live
| Price | -10% $319 | -5% $266 | +0% $213 | +5% $159 | +10% $106 |
|---|---|---|---|---|---|
| Rent | -10% $48 | -5% $130 | +0% $213 | +5% $295 | +10% $378 |
| Rate | -1.0pp $308 | -0.5pp $261 | base $213 | +0.5pp $164 | +1.0pp $114 |
UW: 25.0% down · 7.5% · 30yr · 1.5% tax · 5.0% vac · 8.0% maint · 8.0% mgmt
Financing live
Cash to close
- Down payment
- $47,125
- Closing costs
- $5,655
- Reserves months
- —
- Total cash needed
- —
Loan-product check · same deal, 3 products live
Conventional
25% down · 7.5% · 30yr
- Down + closing
- —
- Monthly P&I
- —
- Monthly cashflow
- —
- DSCR
- —
- Eligible?
- —
Personal DTI + credit; lowest rate.
DSCR
20% down · 8.5% · 30yr
- Down + closing
- —
- Monthly P&I
- —
- Monthly cashflow
- —
- DSCR
- —
- Eligible?
- —
No personal income docs; deal must DSCR.
Hard money
10% down · 12.0% · 12mo
- Down + closing
- —
- Monthly P&I
- —
- Monthly cashflow
- —
- DSCR
- —
- Eligible?
- —
Short-term bridge; refi at stabilization.
Rent comps 9 comps
| Address | Beds | Baths | Sqft | Rent | $/sqft | DOM | Units | Dist |
|---|---|---|---|---|---|---|---|---|
| 104 Dana Dr Hampton, GA | 3.0 | 2.0 | 1460 | $1,945 | $1.33 | 6d | 1 | 0.24mi |
| 20 Windpher Rdg Hampton, GA | 3.0 | 2.0 | 1694 | $2,090 | $1.23 | 45d | 1 | 0.26mi |
| 241 Fern Ct Hampton, GA | 3.0 | 2.0 | 1306 | $1,900 | $1.45 | 1d | 1 | 0.35mi |
| 1905 Elm Park Dr Hampton, GA | 3.0 | 2.5 | 1739 | $1,905 | $1.10 | 3d | 1 | 0.57mi |
| 9 W Main St Hampton, GA | 3.0 | 2.0 | 1560 | $1,713 | $1.10 | 26d | 1 | 0.74mi |
| 100 Cottage Way Hampton, GA | 2.0–3.0 | 2.0–3.0 | 1220 | $2,342 | $1.92 | 0d | 18 | 1.13mi |
| 1184 Warm Spring Ct Hampton, GA | 3.0 | 2.0 | 1595 | $1,889 | $1.18 | 23d | 1 | 1.26mi |
| 110 Jay Ln Unit A Hampton, GA | 2.0 | 1.0 | 878 | $1,275 | $1.45 | 45d | 1 | 1.29mi |
| 102 Jay Ln Unit A Hampton, GA | 2.0 | 1.0 | 878 | $1,175 | $1.34 | 45d | 1 | 1.40mi |
Listing history 6 events
-
2026-06-02statusdays on market $188,500 Pending 22 DOM
-
2026-06-01days on market $188,500 Active 21 DOM
-
2026-05-31days on market $188,500 Active 20 DOM
-
2026-05-11$188,500 Active 246-char remark
-
2017-12-18soldstatus $145,800
-
2005-08-25soldstatus $136,000
ⓘ Source: listings_history table (triggers on properties + properties_extension) + one-shot
backfill from property_details.listing_events for pre-trigger history.
Tax reassessment forecast GA · Resets to sale price
- Current annual tax
- $4,437 · $370/mo
- Projected year-2 tax
- $4,437 · $370/mo
- Expected delta
- $0/yr ($0/mo · 0.0%)
ⓘ Screening estimate from a state-policy table — verify with the county assessor before closing.
Climate risk First Street
- Flood 1/10 Low FEMA zone X (unshaded) · 0% chance over 30 yrs
- Wildfire 3/10 Moderate
- Heat 6/10 Major 7 d/yr ≥105°F today · 17 d/yr by 30 yrs out
- Wind 6/10 Major 27% chance of damaging wind over 30 yrs
- Air quality 4/10 Moderate 4 unhealthy d/yr today · 5 by 30 yrs out
Nearby sold comps map
Loading sold comps map…
Walkable amenities ~0.75 mi
Loading nearby amenities…
Taxation est. · year 1
- Rental income
- $25,057
- − Mortgage interest
- −$10,559
- − Property taxes
- −$4,437
- − Insurance
- −$942
- − Repairs & maintenance
- −$2,005
- − Management
- −$2,005
- − Depreciation
- −$5,484
- Taxable loss
- −$374
- Est. tax savings @ 24.0%
- +$90
- After-tax cash flow
- $2,643/yr
For passive investors: Depreciation is non-cash, so a rental often shows a tax loss while cash-flowing — sheltering income. Rental losses are passive: they offset passive income freely, and up to $25,000/yr can offset ordinary (W-2) income if you actively participate and your MAGI is under $100k (phasing out to $0 by $150k); unused losses carry forward. On sale, claimed depreciation is recaptured at up to 25%, and gains may owe capital-gains tax (a 1031 exchange can defer both). Figures are a year-1 estimate at your 24.0% rate — not tax advice; consult a CPA.
Schools (NCES district)
- District
- Henry County
- NCES district ID
- 1302820
- Math proficiency
- 24% ▼ -9.00%
- Reading proficiency
- 33% ▼ -7.00%
- Median HH income
- $62,594
- Composite
- 26.13/100
- National rank
- #7279
- State rank
- #89 of 174 in GA
Livability — Hampton
- Score
- 65/100
- State rank
- #213
- US rank
- #12664
Category grades
Schools grade is shown separately in the Schools card above.
Census & demographics
- Census place
- Hampton, GA
- County
- Henry County · 316,359 people
- City population
- 52,402
- Metro
- Atlanta-Sandy Springs-Alpharetta, GA
- Population (ZIP)
- 52,402
- Household income
- $82,619
- Rent vs Own
- Severe rent burden
- 1285.0
Population outlook (Henry County) Hauer SSP2
- Today (2025)
- 249,041 people
- By 2030
- 264,369 · +6.2%
- By 2040
- 294,459 · +18.2%
- By 2050
- 322,249 · +29.4%
- By 2075
- 392,310 · +57.5%
- By 2100
- 437,836 · +75.8%
Race, ethnicity, and origin ACS 2023
- Neighborhood character
- Majority Black (63%)
- Race & ethnicity
- Black 63% White 23% Hispanic / Latino 8% Two or more races 6% Asian 2%
- Hispanic origin (detail)
- Mexican 5% Puerto Rican 1%
- Common ancestry
- Hispanic 4% Lithuanian 1% Italian 1%
- Foreign-born
- 9% · Canada, Vietnam, Jamaica
- Languages at home
- 89% English-only · Spanish 6% French/Haitian/Cajun 2% Vietnamese 1%
Political lean MEDSL · Henry
- 2024 margin
- Strong D (+29.7) · D 64.5% · R 34.9%
- 2008→2024 swing
- +37.1pp toward D · 2008: -7.5pp · 2024: 29.7pp
- All cycles
- 2024: D+29.7 2020: D+20.5 2016: D+4.3 2012: R+3.2 2008: R+7.5
Not yet ingested
- Civics
- —
Market trends
- HPI YoY
- ▼ -71.11%
- Current HPI
- 222.0357
- Rent YoY
- ▲ 2.20%
- Metro
- Atlanta-Sandy Springs-Alpharetta, GA
- State GDP YoY
- ▲ 2.66%
- F500 in state
- 28
Industry mix (Fortune 500 HQ in GA)
| Industry | F500 HQs | Revenue |
|---|---|---|
| Paper / Packaging | 2 | $29B |
|
||
| Retail | 1 | $160B |
|
||
| Transportation / Logistics | 1 | $91B |
|
||
| Airlines | 1 | $62B |
|
||
| Consumer Goods | 1 | $47B |
|
||
| Utilities | 1 | $25B |
|
||
Price history
+38.6% since first listed4 events — show timeline
- 2026-06-02 Pending — CGMLS
- 2026-05-11 Listed $188,500 CGMLS
- 2017-12-18 Sold (Public Records) $145,800 Public Records
- 2005-08-25 Sold (Public Records) $136,000 Public Records
Property tax history
+6.6%/yrLatest (2025): $4,437 · +5.2% YoY. Source: county tax records.
Cash-flow waterfall
monthlySold comps — $/sqft
last 12 mo · ≤1 miLoading sold comps…