104 North St #401 · Stamford, CT
Flood risk 1/10 · Minimal
- FEMA flood zone
- X (unshaded)
- Chance of flooding over 30 yrs
- 0.0%
- Est. flood insurance / yr
- $507 – $1,088
Fire risk 1/10 · Minimal
- Est. fire insurance / yr
- $829 – $1,539
Heat risk 6/10 · Moderate
- Hot days now (above 98°F)
- 7 days/yr
- Hot days in 30 yrs
- 16 days/yr
Wind risk 6/10 · Moderate
- Chance of severe wind over 30 yrs
- 70.0%
Air-quality risk 4/10 · Minor
- Unhealthy air days now
- 4 days/yr
- Unhealthy air days in 30 yrs
- 6 days/yr
Risk factors via First Street. Map © Google.
Why this score? — see what drove the D- grade
The composite is a weighted blend of 9 inputs, each scored 0–100. Each bar is that input's sub-score; the figure is the points it added to the 100-point composite (weight × sub-score).
- ARV discount +14.5/15.0
- Cash flow +7.6/30.0
- 1% rule +3.6/10.0
- Schools +3.5/10.0
- Livability +3.5/5.0
- Rent growth +3.0/5.0
- Condition / age +2.5/5.0
- DSCR +1.7/10.0
- Appreciation +0.0/10.0
$299,500
🖨 Deal sheet (PDF) 📄 Offer letter ✓ Due diligence
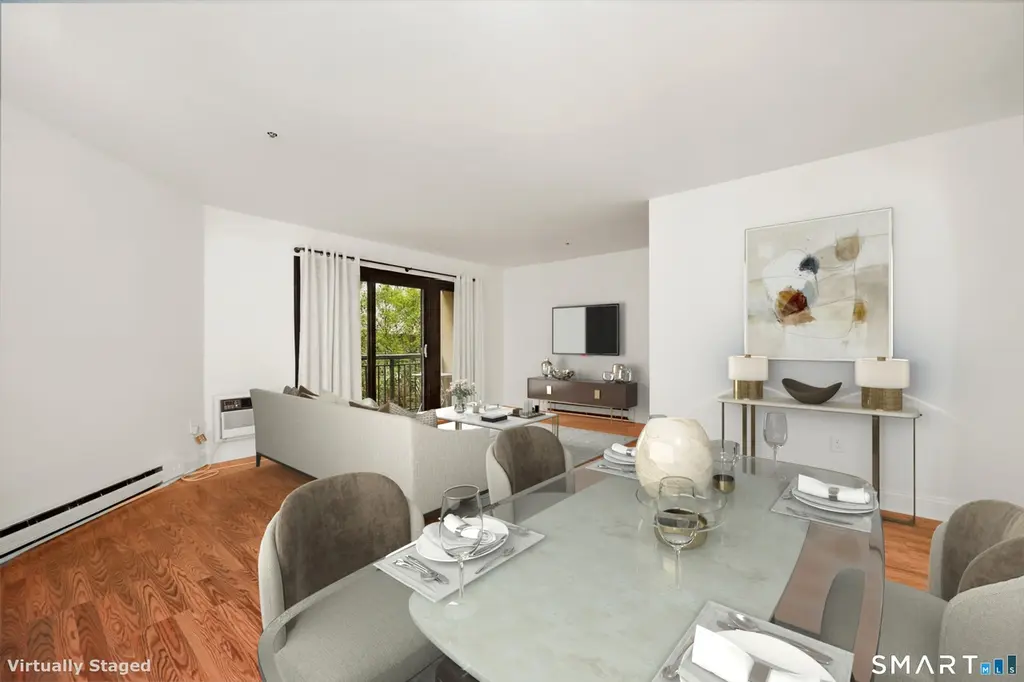
Listing remarks
Great Location & Move-In Ready! This spacious one-bedroom residence features an open-concept layout with a modern, updated bathroom and a seamless flow from the kitchen into the combined living/dining area. Both the living room and the bedroom offer access to a private balcony, providing sweeping city views and a relaxing outdoor retreat. Additional highlights include an in-unit washer/dryer, elevator access, and assigned parking (46). Ideally situated just minutes from UConn Stamford, top restaurants, shops, and all the vibrant amenities that downtown Stamford has to offer.
Key facts
- Private balcony
- Sweeping city views
- In-unit washer dryer
Tags
Property features AI
Finance
- Financial info: Professionally managed off-site; Pets allowed (dogs permitted)
- HOA & community: Homeowners association with monthly fee; Monthly HOA fee includes grounds maintenance, trash pickup, snow removal, water, property management, pest control, and insurance; Association amenities include elevator and guest parking
Exterior
- Parking: Covered garage parking (1 garage space)
- Utilities: Public water connected; Public sewer connected; Electric service
- Home design: Condominium; Located on 4th floor of a multi-unit building; Part of the Northstar complex
- Construction: Brick construction
- Exterior features: Brick and stucco exterior; Beach rights
Interior
- Kitchen: Oven/Range; Microwave; Refrigerator; Dishwasher
- Bedrooms: 1 bedroom
- Bathrooms: 1 full bathroom
- Heating & cooling: Wall unit cooling; Electric hot air heat; 40-gallon electric hot water tank
- Interior features: One-level unit; City views; Balcony; Lighting
- Laundry & utility: In-unit washer and dryer
Neighborhood map
What this means for you Summary
Snapshot
- This is a 1-bed/1.0-bath condo listed at $300k.
Deal economics
- At list price, monthly cash flow is $-362 ($-4k/yr) — negative.
- To cash-flow at today's rent, offer at most $236k (21.4% below list).
- To meet the 1% rule (rent ≥ 1% of price), the offer needs to be $258k (13.8% below list).
- Recommended offer: $236k (21.4% below list) — sets the bar for cash-flow.
- Cap rate 4.8% vs local median 3.0% in Stamford — top-decile yield for the area; either an underpriced asset or a hidden risk that comps aren't pricing in. Stress-test before assuming the spread holds.
Location & tenants
- Location reads 70/100 on livability (#98 in CT) — a middle-class / working-renter tenant base. Strengths: employment A+, health & safety A+, crime A-; Watch: amenities F, commute F, cost of living F.
- Stamford School District (urban): math 32% / reading 43% proficiency, ranked #103 of 153 in CT (top 67%) — families likely to look elsewhere, expect single-tenant / working-renter base with shorter leases.
- Market conditions: Rents rising (+1.9%/yr); 190 active listings in the ZIP; 40 comparable units currently listed for rent nearby; rentals at typical pace (median 23d on market — plan ~3-4 weeks tenant-placement turnaround); solid renter incomes; 1,151 units permitted in Western Connecticut Planning Region in 2024 (714 in 5+ unit buildings).
- This rent runs 33% of the median local income ($95k/yr) — at the standard rent-burdened threshold; future hikes will face affordability resistance.
Forward outlook
- Local home prices are declining (-3.0%/yr); year-one equity from $2k of loan paydown is wiped out by about $9k of value loss. Plan a longer hold.
Negotiation context
- It's been on market 25 days — a 2% lower offer ($295k) is reasonable based on typical stale-listing flexibility.
- 6 sale attempts since 22y ago with the ask held roughly flat each time — persistent listings suggest the price (not the market) is what's stuck; bring a comps-based counter.
- Current owner paid $229k; 31% above their basis — modest negotiation headroom, anchor on the comps not their cost.
Risks & watch-outs
- Climate carrying-cost: major wind risk, 70% chance of damaging wind over 30y; extreme-heat days projected 7→16/yr by 2055 (HVAC capex compounding) — expect insurance premiums to compound above CPI over the hold.
Questions for the listing agent
- What do current leases actually rent for vs. the listed asking? Can we see a recent rent roll and the last 12 months of T-12 income?
- What does the HOA fee cover, when was the last increase, and are there any pending special assessments or reserve-fund shortfalls?
- Any open or pending special assessments — roof, HVAC, plumbing, elevator, façade? What's the per-unit balance and payoff schedule, and is the seller paying it off at close or rolling it to the buyer?
- Is there a deadline driving the sale (1031 exchange, divorce, estate, relocation)? That informs how much negotiation room exists.
- Schools are B-rated — typically a magnet for longer-tenancy family renters. What's the average tenant stay here, and is there a school-zone premium baked into asking?
- The area grade is low — what's the realistic commute time and amenity access for the typical tenant pool here? Any planned neighborhood developments (good or bad) we should know about?
- What's the average days-on-market for RENTAL listings here right now (not sales)? A rising rental-DOM trend means longer vacancies and softer asking-rent achievability than the comps imply.
- What's the recent tenant-quality profile in this submarket — average credit score on applications, eviction rate, late-payment / NSF rate, and stable-employment percentage? A property-management company in the area should have these aggregated.
- How much new apartment / multifamily construction is in the pipeline within 1–3 miles? Heavy new supply (>2% of stock underway) typically softens rents 12–24 months out; light construction supports rent growth.
Investment metrics
- 1% rule
- 0.86% ✗
- Cap rate
- 4.84%
- Cash-on-cash
- -5.18%
- DSCR
- 0.77
- GRM
- 9.7
CMA / ARV
- ARV (median comp)
- $354,610
- List price
- $299,500
- Delta
- -8.35%
- Verdict
- FAIR
- Comps
- 20 within 1.0 mi
Projected returns pro-forma
-3.0% appreciation · 1.95% rent growth · sell at horizon
- IRR
- -26.4%
- Equity multiple
- 0.12×
- Total profit
- $-74,055
- Equity at exit
- $44,656
- IRR
- -27.8%
- Equity multiple
- -0.24×
- Total profit
- $-104,045
- Equity at exit
- $25,895
Cash invested: $83,860 (down + closing). Projections, not guarantees.
Landlord ↔ Tenant lean methodology
- Overall (STATE)
- 27 Tenant-Leaning
- State Connecticut
- 27 Tenant-Leaning · D+7
- County
- — inherits STATE
- City
- — inherits STATE
ZIP-level market 06902
- Rents YoY
- 1.9%
- Active inventory
- 190
- Price-to-rent
- 9.7×
Monthly cashflow live
- Estimated rent
- $2,581 high interval (Pro) →
- Mortgage (P&I)
- −$1,571
- Tax from tax record
- −$332 /mo · $3,978/yr
- Insurance
- −$125
- HOA
- −$374
- Vacancy / Maint / Mgmt
- −$542
- Net cashflow
- $-362
Break-even live
Sensitivity live
| Price | -10% $-193 | -5% $-277 | +0% $-362 | +5% $-447 | +10% $-532 |
|---|---|---|---|---|---|
| Rent | -10% $-566 | -5% $-464 | +0% $-362 | +5% $-260 | +10% $-158 |
| Rate | -1.0pp $-211 | -0.5pp $-286 | base $-362 | +0.5pp $-440 | +1.0pp $-519 |
UW: 25.0% down · 7.5% · 30yr · 1.5% tax · 5.0% vac · 8.0% maint · 8.0% mgmt
Financing live
Cash to close
- Down payment
- $74,875
- Closing costs
- $8,985
- Reserves months
- —
- Total cash needed
- —
Loan-product check · same deal, 3 products live
Conventional
25% down · 7.5% · 30yr
- Down + closing
- —
- Monthly P&I
- —
- Monthly cashflow
- —
- DSCR
- —
- Eligible?
- —
Personal DTI + credit; lowest rate.
DSCR
20% down · 8.5% · 30yr
- Down + closing
- —
- Monthly P&I
- —
- Monthly cashflow
- —
- DSCR
- —
- Eligible?
- —
No personal income docs; deal must DSCR.
Hard money
10% down · 12.0% · 12mo
- Down + closing
- —
- Monthly P&I
- —
- Monthly cashflow
- —
- DSCR
- —
- Eligible?
- —
Short-term bridge; refi at stabilization.
Rent comps 40 comps
| Address | Beds | Baths | Sqft | Rent | $/sqft | DOM | Units | Dist |
|---|---|---|---|---|---|---|---|---|
| 104 North St #604 Stamford, CT | 2.0 | 2.0 | 1116 | $2,950 | $2.64 | 45d | 1 | 0.02mi |
| 104 North St #604 Stamford, CT | 2.0 | 2.0 | 1116 | $3,000 | $2.69 | 15d | 1 | 0.02mi |
| 1455 Washington Blvd Stamford, CT | 1.0–2.0 | 1.0–2.0 | 1041 | $2,858 | $2.74 | 4d | 8 | 0.08mi |
| 750 Summer St Stamford, CT | 1.0 | 1.0 | 888 | $2,629 | $2.96 | 45d | 1 | 0.09mi |
| 750 Summer St Stamford, CT | 2.0 | 2.0 | 1090 | $3,350 | $3.07 | 4d | 1 | 0.09mi |
| 700 Summer St Stamford, CT | 1.0 | 1.0 | 739 | $2,300 | $3.11 | 4d | 3 | 0.11mi |
| 700 Summer St Unit 6C Stamford, CT | 1.0 | 1.0 | 900 | $2,950 | $3.28 | 45d | 1 | 0.11mi |
| 1450 Washington Blvd Stamford, CT | 3.0 | 1.0–2.5 | 1188 | $2,700 | $2.27 | 25d | 1 | 0.11mi |
| 1340 Washington Blvd Stamford, CT | 1.0–2.0 | 1.0–2.0 | 969 | $2,669 | $2.75 | 13d | 11 | 0.12mi |
| 777 Summer St Stamford, CT | 2.0 | 1.0–2.0 | 848 | $3,730 | $4.40 | 4d | 65 | 0.12mi |
| 833 Summer St Stamford, CT | 1.0–2.0 | 1.0 | 1057 | $2,700 | $2.55 | 4d | 2 | 0.12mi |
| 711 Summer St Unit 318 Stamford, CT | 1.0 | 1.0 | 600 | $2,303 | $3.84 | 4d | 1 | 0.13mi |
| 711 Summer St Unit 567 Stamford, CT | 1.0 | 1.0 | 600 | $2,218 | $3.70 | 45d | 1 | 0.13mi |
| 711 Summer St Unit 420 Stamford, CT | 1.0 | 1.0 | 600 | $2,206 | $3.68 | 25d | 1 | 0.13mi |
| 163 Franklin St Stamford, CT | 1.0 | 1.0 | 888 | $2,625 | $2.96 | 45d | 1 | 0.13mi |
| 639 Summer St #20 Stamford, CT | 2.0 | 1.0 | 836 | $2,500 | $2.99 | 4d | 1 | 0.14mi |
| 15 Renwick St #2 Stamford, CT | 2.0 | 1.5 | 1064 | $2,750 | $2.58 | 45d | 1 | 0.16mi |
| 460 Summer St Ste 310 Stamford, CT | 1.0 | 1.0 | 550 | $2,400 | $4.36 | 4d | 1 | 0.18mi |
| 460 Summer St Unit 500 Stamford, CT | 1.0 | 1.0 | 550 | $2,425 | $4.41 | 15d | 1 | 0.18mi |
| 485 Summer St Unit 307 Stamford, CT | 1.0 | 1.0 | 619 | $2,200 | $3.55 | 25d | 1 | 0.20mi |
| 444 Bedford St Unit 6J Stamford, CT | 1.0 | 1.0 | 610 | $2,200 | $3.61 | 13d | 1 | 0.20mi |
| 444 Bedford St Stamford, CT | 1.0 | 1.0 | 690 | $2,062 | $2.99 | 22d | 2 | 0.20mi |
| 444 Bedford St Stamford, CT | 2.0 | 1.0 | 705 | $2,298 | $3.26 | 45d | 3 | 0.20mi |
| 488 Bedford St Unit 308 Stamford, CT | 2.0 | 2.0 | 1050 | $2,757 | $2.63 | 22d | 1 | 0.21mi |
| 488 Bedford St Unit 232 Stamford, CT | 1.0 | 1.0 | 770 | $2,217 | $2.88 | 15d | 1 | 0.21mi |
| 488 Bedford St Unit 308 Stamford, CT | 2.0 | 2.0 | 1050 | $2,757 | $2.63 | 45d | 1 | 0.21mi |
| 488 Bedford St Unit 108 Stamford, CT | 2.0 | 2.0 | 1050 | $2,567 | $2.44 | 25d | 1 | 0.21mi |
| 488 Bedford St Unit 326 Stamford, CT | 1.0 | 1.0 | 770 | $2,106 | $2.74 | 45d | 1 | 0.21mi |
| 20 North St Unit 11-2 Stamford, CT | 1.0 | 1.0 | 596 | $2,000 | $3.36 | 15d | 1 | 0.21mi |
| 1462 Summer St Unit 1 Stamford, CT | 1.0 | 1.0 | 550 | $1,900 | $3.45 | 25d | 1 | 0.26mi |
| 1 Atlantic St Unit 609 Stamford, CT | 1.0 | 1.0 | 600 | $2,284 | $3.81 | 45d | 1 | 0.29mi |
| 184 Summer St Stamford, CT | 3.0 | 1.0–2.5 | 1138 | $2,876 | $2.53 | 45d | 18 | 0.30mi |
| 184 Summer St Stamford, CT | 2.0 | 1.0–2.5 | 901 | $3,456 | $3.83 | 4d | 18 | 0.30mi |
| 191 Summer St Unit 3 Stamford, CT | 1.0 | 1.0 | 700 | $2,500 | $3.57 | 45d | 1 | 0.31mi |
| 77 Prospect St Stamford, CT | 1.0–2.0 | 1.0–2.0 | 1080 | $2,931 | $2.71 | 4d | 5 | 0.33mi |
| 25 Forest St Unit 7G Stamford, CT | 1.0 | 1.0 | 784 | $2,725 | $3.48 | 15d | 1 | 0.33mi |
| 99 Prospect St Unit 7K Stamford, CT | 1.0 | 1.0 | 630 | $1,995 | $3.17 | 45d | 1 | 0.35mi |
| 66 Summer St Stamford, CT | 1.0–2.0 | 1.0–2.0 | 889 | $2,861 | $3.22 | 4d | 15 | 0.35mi |
| 25 3rd St Stamford, CT | 1.0 | 1.0 | 560 | $1,890 | $3.38 | 15d | 1 | 0.36mi |
| 112 Hoyt St Stamford, CT | 3.0 | 1.0 | 758 | $2,288 | $3.02 | 15d | 10 | 0.36mi |
HOA detail condo
- Monthly dues
- $374 · $4,488/yr
- Likely covers
- parking
- Assessments
- None detected in remarks — confirm with the listing agent.
Listing history 31 events
-
2026-06-21days on market $299,500 Active 25 DOM
-
2026-06-18days on market $299,500 Active 22 DOM
-
2026-06-17days on market $299,500 Active 21 DOM
-
2026-06-16days on market $299,500 Active 20 DOM
-
2026-06-15days on market $299,500 Active 19 DOM
-
2026-06-13days on market $299,500 Active 17 DOM
-
2026-06-13days on market $299,500 Active 16 DOM
-
2026-06-10pricedays on market $299,500 Active 14 DOM
-
2026-06-09days on market $314,900 Active 13 DOM
-
2026-06-08days on market $314,900 Active 12 DOM
-
2026-06-07days on market $314,900 Active 11 DOM
-
2026-06-05days on market $314,900 Active 8 DOM
-
2026-06-03days on market $314,900 Active 7 DOM
-
2026-06-03days on market $314,900 Active 6 DOM
-
2026-06-01days on market $314,900 Active 5 DOM
-
2026-05-31days on market $314,900 Active 4 DOM
-
2026-04-17price $325,000 585-char remark
-
2026-03-26historical $2,300
-
2026-03-26$349,000 Active 585-char remark
-
2025-11-15$2,300
-
2017-07-05soldstatus $229,000
-
2006-08-01soldstatus $285,000
-
2006-08-01soldstatus $285,000
-
2006-07-31soldstatus $285,000
-
2006-05-19$285,000
-
2006-05-18$285,000
-
2004-07-16soldstatus $219,900
-
2004-07-16soldstatus $219,900
-
2004-06-01$219,900
-
1992-08-17soldstatus $63,600
-
1992-08-17soldstatus $63,600
ⓘ Source: listings_history table (triggers on properties + properties_extension) + one-shot
backfill from property_details.listing_events for pre-trigger history.
Tax reassessment forecast CT · Partial reset (capped growth)
- Current annual tax
- $3,978 · $332/mo
- Projected year-2 tax
- $5,194 · $433/mo
- Expected delta
- +$1,216/yr (+$101/mo · 30.6%)
ⓘ Screening estimate from a state-policy table — verify with the county assessor before closing.
Climate risk First Street
- Flood 1/10 Low FEMA zone X (unshaded) · 0% chance over 30 yrs
- Wildfire 1/10 Low
- Heat 6/10 Major 7 d/yr ≥98°F today · 16 d/yr by 30 yrs out
- Wind 6/10 Major 70% chance of damaging wind over 30 yrs
- Air quality 4/10 Moderate 4 unhealthy d/yr today · 6 by 30 yrs out
Nearby sold comps map
Loading sold comps map…
Walkable amenities ~0.75 mi
Loading nearby amenities…
Taxation est. · year 1
- Rental income
- $30,968
- − Mortgage interest
- −$16,777
- − Property taxes
- −$3,978
- − Insurance
- −$1,498
- − Repairs & maintenance
- −$2,477
- − Management
- −$2,477
- − HOA
- −$4,488
- − Depreciation
- −$8,713
- Taxable loss
- −$9,440
- Est. tax savings @ 24.0%
- +$2,266
- After-tax cash flow
- $-2,081/yr
For passive investors: Depreciation is non-cash, so a rental often shows a tax loss while cash-flowing — sheltering income. Rental losses are passive: they offset passive income freely, and up to $25,000/yr can offset ordinary (W-2) income if you actively participate and your MAGI is under $100k (phasing out to $0 by $150k); unused losses carry forward. On sale, claimed depreciation is recaptured at up to 25%, and gains may owe capital-gains tax (a 1031 exchange can defer both). Figures are a year-1 estimate at your 24.0% rate — not tax advice; consult a CPA.
Schools (NCES district)
- District
- Stamford School District
- NCES district ID
- 0904320
- Math proficiency
- 32% ▼ -10.00%
- Reading proficiency
- 43% ▼ -7.00%
- Median HH income
- $78,843
- Composite
- 35.14/100
- National rank
- #5010
- State rank
- #103 of 153 in CT
Livability — Stamford
- Score
- 70/100
- State rank
- #98
- US rank
- #7716
Category grades
Schools grade is shown separately in the Schools card above.
Census & demographics
- Census place
- Stamford, CT
- County
- Fairfield County · 765,532 people
- City population
- 123,058
- Metro
- Bridgeport-Stamford-Norwalk, CT
- Population (ZIP)
- 73,392
- Household income
- $94,843
- Rent vs Own
- Severe rent burden
- 4139.0
Population outlook (Western Connecticut County) Hauer SSP2
- By 2040
- 685,031
Race, ethnicity, and origin ACS 2023
- Neighborhood character
- Highly diverse neighborhood (Simpson 0.71)
- Race & ethnicity
- Hispanic / Latino 35% White 32% Black 23% Two or more races 13% Asian 7%
- Hispanic origin (detail)
- Mexican 3% Puerto Rican 4% Dominican 3%
- Common ancestry
- Hispanic 5% Romanian 3% Scotch-Irish 1%
- Foreign-born
- 36% · Canada, Jamaica, China
- Languages at home
- 51% English-only · Spanish 30% French/Haitian/Cajun 6% Other Indo-European 4%
Political lean MEDSL · Western Connecticut
- 2024 margin
- D (+19.1) · D 58.8% · R 39.7% · Other 1.6%
- All cycles
- 2024: D+19.1
Not yet ingested
- Civics
- —
Market trends
- HPI YoY
- ▼ -450.67%
- Current HPI
- 173.4108
- Rent YoY
- ▲ 1.95%
- Metro
- Bridgeport-Stamford-Norwalk, CT
- State GDP YoY
- ▲ 1.06%
- F500 in state
- 38
Industry mix (Fortune 500 HQ in CT)
| Industry | F500 HQs | Revenue |
|---|---|---|
| Industrial Machinery | 4 | $38B |
|
||
| Insurance | 3 | $71B |
|
||
| Financial Services | 2 | $25B |
|
||
| Transportation / Logistics | 2 | $18B |
|
||
| Healthcare | 1 | $247B |
|
||
| Telecommunications | 1 | $55B |
|
||
Price history
+370.9% since first listed18 events — show timeline
- 2026-06-09 Price Changed $299,500 Smart MLS
- 2026-05-27 Listed $314,900 Smart MLS
- 2026-05-21 Listing Removed — Smart MLS
- 2026-04-17 Price Changed $325,000 Smart MLS
- 2026-03-26 Rental Removed $2,300 SMARTMLS
- 2026-03-26 Listed $349,000 Smart MLS
- 2025-11-15 Listed for Rent $2,300 SMARTMLS
- 2017-07-05 Sold (Public Records) $229,000 Public Records
- 2006-08-01 Sold (Public Records) $285,000 Public Records
- 2006-08-01 Sold (Public Records) $285,000 Public Records
- 2006-07-31 Sold (MLS) $285,000 Smart MLS
- 2006-05-19 Listed $285,000 GMLS
- 2006-05-18 Listed $285,000 Smart MLS
- 2004-07-16 Sold (Public Records) $219,900 Public Records
- 2004-07-16 Sold (MLS) $219,900 Smart MLS
- 2004-06-01 Listed $219,900 Smart MLS
- 1992-08-17 Sold (Public Records) $63,600 Public Records
- 1992-08-17 Sold (Public Records) $63,600 Public Records
Property tax history
+1.6%/yrLatest (2022): $3,978 · +0.9% YoY. Source: county tax records.
Cash-flow waterfall
monthlySold comps — $/sqft
last 12 mo · ≤1 miLoading sold comps…