49 Rolling Meadows Ct · Mountain Home, AR
Flood risk No data
- FEMA flood zone
- —
- Chance of flooding over 30 yrs
- —
- Est. flood insurance / yr
- —
Fire risk No data
- Est. fire insurance / yr
- —
Heat risk No data
- Hot days now (above threshold)
- —
- Hot days in 30 yrs
- —
Wind risk No data
- Chance of severe wind over 30 yrs
- —
Air-quality risk No data
- Unhealthy air days now
- —
- Unhealthy air days in 30 yrs
- —
Risk factors via First Street. Map © Google.
Why this score? — see what drove the C+ grade
The composite is a weighted blend of 9 inputs, each scored 0–100. Each bar is that input's sub-score; the figure is the points it added to the 100-point composite (weight × sub-score).
- Cash flow +30.0/30.0
- 1% rule +10.0/10.0
- DSCR +10.0/10.0
- Condition / age +3.8/5.0
- Schools +3.7/10.0
- Livability +3.5/5.0
- Rent growth +2.5/5.0
- ARV discount +0.0/15.0
- Appreciation +0.0/10.0
$75,900
🖨 Deal sheet 📄 Offer letter ✓ Due diligence
Listing remarks MLS
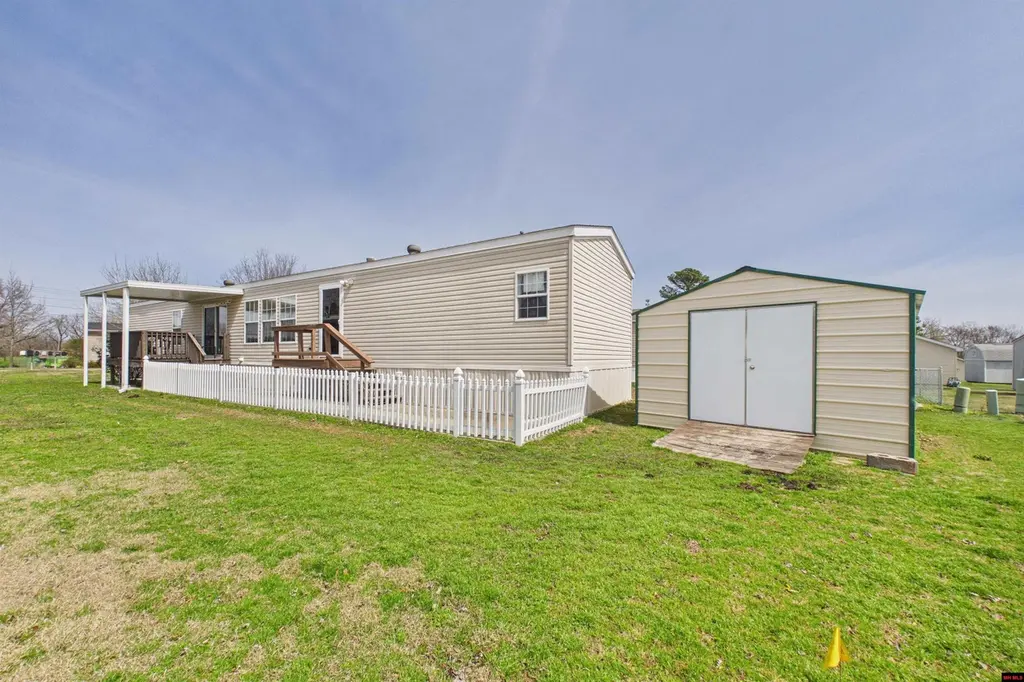
New to the spring market is this exceptionally well kept 3 bedroom/2 bath mobile home in the peaceful, 55+ Rolling Meadows Mobile Home Park. This super clean home features an open concept kitchen with a dedicated dining area and a split bedroom plan ensuring privacy for overnight guests. A screened in front porch as well as a covered back deck provide plenty of space for enjoying the outdoors and getting fresh air and/or entertaining. The large primary suite features a massive walk-in closet, a step-in shower, soaker tub, double vanity, and plenty of built-ins for storage. Come see all that it has to offer!
Key facts
- Open concept kitchen
- Covered back deck
- Split bedroom plan
Tags
Neighborhood map
What this means for you Summary
Snapshot
- This is a 3-bed/2.0-bath manufactured listed at $76k. Condition is rated good.
Deal economics
- At list price, monthly cash flow is $471 ($6k/yr) — positive.
- The deal already cash-flows at list — no discount required.
- Meets the 1% rule at list price ($1k rent vs $76k).
- Recommended offer: $69k (9.0% below list) — sets the bar for market timing.
- Cap rate 13.7% vs local median 3.1% in Mountain Home — top-decile yield for the area; either an underpriced asset or a hidden risk that comps aren't pricing in. Stress-test before assuming the spread holds.
Location & tenants
- Location reads 70/100 on livability (#54 in AR) — a middle-class / working-renter tenant base. Strengths: cost of living A+, housing A+, health & safety A+; Watch: schools C-, amenities F, commute F.
- Mountain Home School District (town): math 45% / reading 45% proficiency, ranked #40 of 238 in AR (top 17%) — families likely to look elsewhere, expect single-tenant / working-renter base with shorter leases.
- Market conditions: 386 active listings in the ZIP; 47 units permitted in Baxter County in 2024 (0 in 5+ unit buildings).
- This rent runs 31% of the median local income ($49k/yr) — at the standard rent-burdened threshold; future hikes will face affordability resistance.
Forward outlook
- Local home prices are declining (-3.0%/yr); year-one equity from $525 of loan paydown is wiped out by about $2k of value loss. Plan a longer hold.
- Baxter County population projected to shrink 9% by 2050 — rents likely to lag national; underwrite the cash flow, not the appreciation.
- At projected returns (-3.0% appreciation + 3.0% rent growth), your $21k cash investment doubles in ~5 years — after that, you're playing with house money.
Negotiation context
- It's been on market 92 days — a 9% lower offer ($69k) is reasonable based on typical stale-listing flexibility.
Questions for the listing agent
- It's been on market 92 days. Have you received any prior offers? Is the seller open to a 9% concession, seller financing, or rate buy-down credit?
- Why hasn't it sold? Are there any deal-killer items the seller is aware of (foundation, flood, title, zoning, code violations)?
- Is there a deadline driving the sale (1031 exchange, divorce, estate, relocation)? That informs how much negotiation room exists.
- What's the average days-on-market for RENTAL listings here right now (not sales)? A rising rental-DOM trend means longer vacancies and softer asking-rent achievability than the comps imply.
- What's the recent tenant-quality profile in this submarket — average credit score on applications, eviction rate, late-payment / NSF rate, and stable-employment percentage? A property-management company in the area should have these aggregated.
- How much new for-sale + rental construction is in the pipeline within 1–3 miles? Heavy new supply typically softens prices + rents 12–24 months out; constrained supply supports both.
Investment metrics
- 1% rule
- 1.66% ✓
- Cap rate
- 13.74%
- Cash-on-cash
- 26.61%
- DSCR
- 2.18
- GRM
- 5.0
CMA / ARV
- ARV (median comp)
- $54,386
- List price
- $75,900
- Delta
- 39.56%
- Verdict
- OVERPRICED
- Comps
- 15 within 1.0 mi
Show comp detail 12 sales within ~0.75 mi
| Address | Dist | Beds/Ba | Sqft | Sold | Price | $/sf | Match |
|---|---|---|---|---|---|---|---|
| 146 Wehmeyer Loop | 0.05mi | 3/2.0 | 1,216 (0%) | 2mo | $65,000 | $53 | 96 |
| 43 Nora Ct | 0.11mi | 3/2.0 | 1,216 (0%) | 4mo | $46,000 | $38 | 91 |
| 79 Rolling Meadows Ct | 0.03mi | 3/2.0 | 1,216 (0%) | 11mo | $74,699 | $61 | 90 |
| 316 Wehmeyer Loop | 0.15mi | 3/2.0 | 1,216 (0%) | 8mo | $83,000 | $68 | 86 |
| 136 Wehmeyer Loop | 0.04mi | 2/2.0 (-1) | 1,216 (0%) | 9mo | $78,000 | $64 | 86 |
| 102 Hal Dr | 0.15mi | 3/2.0 | 1,288 (+6%) | 8mo | $45,000 | $35 | 77 |
| 65 Fleck Dr | 0.22mi | 3/2.0 | 1,120 (-8%) | 2mo | $85,000 | $76 | 75 |
| 73 Nora Ct | 0.11mi | 2/2.0 (-1) | 1,150 (-5%) | 8mo | $43,000 | $37 | 74 |
| 101 Nora Ct | 0.13mi | 2/2.0 (-1) | 1,120 (-8%) | 4mo | $51,000 | $46 | 73 |
| 131 Nora Ct | 0.15mi | 3/2.0 | 1,352 (+11%) | 6mo | $85,000 | $63 | 70 |
| 29 Benjamin Dr | 0.19mi | 2/2.0 (-1) | 1,072 (-12%) | 5mo | $50,000 | $47 | 62 |
| 32 Hal Dr | 0.14mi | 3/2.0 | 1,040 (-14%) | 10mo | $50,000 | $48 | 61 |
Match score weights: distance 35% · size 25% · config 20% · recency 20%. Top-matched comps best support the ARV.
Projected returns pro-forma
-3.0% appreciation · 3.0% rent growth · sell at horizon
- IRR
- 20.5%
- Equity multiple
- 1.83×
- Total profit
- $17,735
- Equity at exit
- $11,317
- IRR
- 28.7%
- Equity multiple
- 3.55×
- Total profit
- $54,170
- Equity at exit
- $6,562
Cash invested: $21,252 (down + closing). Projections, not guarantees.
Landlord ↔ Tenant lean methodology
- Overall (STATE)
- 92 Strongly Landlord-Friendly
- State Arkansas
- 92 Strongly Landlord-Friendly · R+14
- County
- — inherits STATE
- City
- — inherits STATE
ZIP-level market 72653
- Home prices YoY
- -15.8%
- Active inventory
- 386
- Price-to-rent
- 5.0×
Monthly cashflow live
- Estimated rent
- $1,260 medium interval (Pro) →
- Mortgage (P&I)
- −$398
- Tax est. 1.5%
- −$95 /mo · $1,138/yr
- Insurance
- −$32
- HOA
- −$0
- Vacancy / Maint / Mgmt
- −$265
- Net cashflow
- $471
Break-even live
UW: 25.0% down · 7.5% · 30yr · 1.5% tax · 5.0% vac · 8.0% maint · 8.0% mgmt
Financing live
Cash to close
- Down payment
- $18,975
- Closing costs
- $2,277
- Reserves months
- —
- Total cash needed
- —
Loan-product check · same deal, 3 products live
Conventional
25% down · 7.5% · 30yr
- Down + closing
- —
- Monthly P&I
- —
- Monthly cashflow
- —
- DSCR
- —
- Eligible?
- —
Personal DTI + credit; lowest rate.
DSCR
20% down · 8.5% · 30yr
- Down + closing
- —
- Monthly P&I
- —
- Monthly cashflow
- —
- DSCR
- —
- Eligible?
- —
No personal income docs; deal must DSCR.
Hard money
10% down · 12.0% · 12mo
- Down + closing
- —
- Monthly P&I
- —
- Monthly cashflow
- —
- DSCR
- —
- Eligible?
- —
Short-term bridge; refi at stabilization.
Listing history 17 events
-
2026-06-19days on market $75,900 Active 92 DOM
-
2026-06-18days on market $75,900 Active 91 DOM
-
2026-06-17days on market $75,900 Active 90 DOM
-
2026-06-16days on market $75,900 Active 89 DOM
-
2026-06-15days on market $75,900 Active 88 DOM
-
2026-06-14days on market $75,900 Active 86 DOM
-
2026-06-12days on market $75,900 Active 85 DOM
-
2026-06-09days on market $75,900 Active 82 DOM
-
2026-06-08days on market $75,900 Active 81 DOM
-
2026-06-07days on market $75,900 Active 80 DOM
-
2026-06-05pricedays on market $75,900 Active 77 DOM
-
2026-06-02days on market $79,900 Active 75 DOM
-
2026-06-01days on market $79,900 Active 74 DOM
-
2026-05-31days on market $79,900 Active 73 DOM
-
2026-05-30days on market $79,900 Active 72 DOM
-
2026-04-29price $79,900 614-char remark
Show marketing remark (614 chars)
New to the spring market is this exceptionally well kept 3 bedroom/2 bath mobile home in the peaceful, 55+ Rolling Meadows Mobile Home Park. This super clean home features an open concept kitchen with a dedicated dining area and a split bedroom plan ensuring privacy for overnight guests. A screened in front porch as well as a covered back deck provide plenty of space for enjoying the outdoors and getting fresh air and/or entertaining. The large primary suite features a massive walk-in closet, a step-in shower, soaker tub, double vanity, and plenty of built-ins for storage. Come see all that it has to offer!
-
2026-03-19$82,000 Active 614-char remark
Show marketing remark (614 chars)
New to the spring market is this exceptionally well kept 3 bedroom/2 bath mobile home in the peaceful, 55+ Rolling Meadows Mobile Home Park. This super clean home features an open concept kitchen with a dedicated dining area and a split bedroom plan ensuring privacy for overnight guests. A screened in front porch as well as a covered back deck provide plenty of space for enjoying the outdoors and getting fresh air and/or entertaining. The large primary suite features a massive walk-in closet, a step-in shower, soaker tub, double vanity, and plenty of built-ins for storage. Come see all that it has to offer!
ⓘ Source: listings_history table (triggers on properties + properties_extension) + one-shot
backfill from property_details.listing_events for pre-trigger history.
Nearby sold comps map
Loading sold comps map…
Walkable amenities ~0.75 mi
Loading nearby amenities…
Taxation est. · year 1
- Rental income
- $15,126
- − Mortgage interest
- −$4,252
- − Property taxes
- −$1,138
- − Insurance
- −$380
- − Repairs & maintenance
- −$1,210
- − Management
- −$1,210
- − Depreciation
- −$2,208
- Taxable income
- $4,728
- Est. tax owed @ 24.0%
- −$1,135
- After-tax cash flow
- $4,520/yr
For passive investors: Depreciation is non-cash, so a rental often shows a tax loss while cash-flowing — sheltering income. Rental losses are passive: they offset passive income freely, and up to $25,000/yr can offset ordinary (W-2) income if you actively participate and your MAGI is under $100k (phasing out to $0 by $150k); unused losses carry forward. On sale, claimed depreciation is recaptured at up to 25%, and gains may owe capital-gains tax (a 1031 exchange can defer both). Figures are a year-1 estimate at your 24.0% rate — not tax advice; consult a CPA.
Condition & rehab AI · 12 photos
This well-maintained mobile home in Rolling Meadows Mobile Home Park offers a good starting point for a cosmetic renovation, with updates to the kitchen and bathrooms providing the highest return on investment.
Repairs flagged
- Minor kitchen cabinets — slight wear
- Minor bathroom cabinets — slight wear
- Moderate exterior siding — moderate wear
Value-add opportunities
- Resale update kitchen cabinets and countertops — modernizing the kitchen
- Resale update bathroom fixtures and cabinets — modernizing the bathrooms
- Both paint interior walls — enhances curb appeal and interior aesthetics
- Both repair exterior siding — enhances curb appeal and structural integrity
Renovation cost estimate screening
| Repair item | Severity | Est. cost |
|---|---|---|
| kitchen cabinets · slight wear | Minor | $500–3,000 |
| bathroom cabinets · slight wear | Minor | $500–3,000 |
| exterior siding · moderate wear | Moderate | $3,000–15,000 |
| Total estimated repair cost · 3 items | $4,000–21,000 |
Value-add ROI direction
- Resale update kitchen cabinets and countertops — modernizing the kitchen ↑
- Resale update bathroom fixtures and cabinets — modernizing the bathrooms ↑
- Both paint interior walls — enhances curb appeal and interior aesthetics ↑
- Both repair exterior siding — enhances curb appeal and structural integrity ↑
ⓘ Cost ranges are severity-bucket heuristics (US national rule-of-thumb). Get contractor quotes + a written scope before underwriting a rehab budget.
Schools (NCES district)
- District
- Mountain Home School District
- NCES district ID
- 0500043
- Math proficiency
- 45% ▼ -8.00%
- Reading proficiency
- 45% ▼ -4.00%
- Median HH income
- $36,966
- Composite
- 37.4/100
- National rank
- #4424
- State rank
- #40 of 238 in AR
Livability — Mountain Home
- Score
- 70/100
- State rank
- #54
- US rank
- #7718
Category grades
Schools grade is shown separately in the Schools card above.
Census & demographics
- County
- Baxter County · 29,564 people
- City population
- 29,564
- Metro
- Mountain Home, AR
- Population (ZIP)
- 29,564
- Household income
- $48,718
- Rent vs Own
- Severe rent burden
- 663.0
Population outlook (Baxter County) Hauer SSP2
- Today (2025)
- 39,886 people
- By 2030
- 39,226 · -1.7%
- By 2040
- 37,810 · -5.2%
- By 2050
- 36,287 · -9.0%
- By 2075
- 32,965 · -17.4%
- By 2100
- 28,002 · -29.8%
Race, ethnicity, and origin ACS 2023
- Neighborhood character
- Predominantly White (91%)
- Race & ethnicity
- White 91% Two or more races 6% Hispanic / Latino 3%
- Common ancestry
- Slovak 2% Romanian 2% Portuguese 2%
- Foreign-born
- 2% · Canada
- Languages at home
- 96% English-only · Spanish 2% German/W. Germanic 1%
Political lean MEDSL · Baxter
- 2024 margin
- Solid R (+56.9) · D 20.7% · R 77.6% · Other 1.7%
- 2008→2024 swing
- -25.3pp toward R · 2008: -31.6pp · 2024: -56.9pp
- All cycles
- 2024: R+56.9 2020: R+53.3 2016: R+53.6 2012: R+44.0 2008: R+31.6
Not yet ingested
- Civics
- —
Market trends
- HPI YoY
- ▼ -46.18%
- Current HPI
- 246.3231
- Rent YoY
- —
- Metro
- Mountain Home, AR
- State GDP YoY
- ▲ 3.80%
- F500 in state
- 10
Industry mix (Fortune 500 HQ in AR)
| Industry | F500 HQs | Revenue |
|---|---|---|
| Retail | 1 | $681B |
|
||
| Food / Agriculture | 1 | $53B |
|
||
| Retail / Energy | 1 | $22B |
|
||
| Transportation / Logistics | 1 | $12B |
|
||
| Energy | 1 | $4B |
|
||
Price history
-2.6% since first listed2 events — show timeline
- 2026-04-29 Price Changed $79,900 MHMLS
- 2026-03-19 Listed $82,000 MHMLS
Cash-flow waterfall
monthlySold comps — $/sqft
last 12 mo · ≤1 miLoading sold comps…