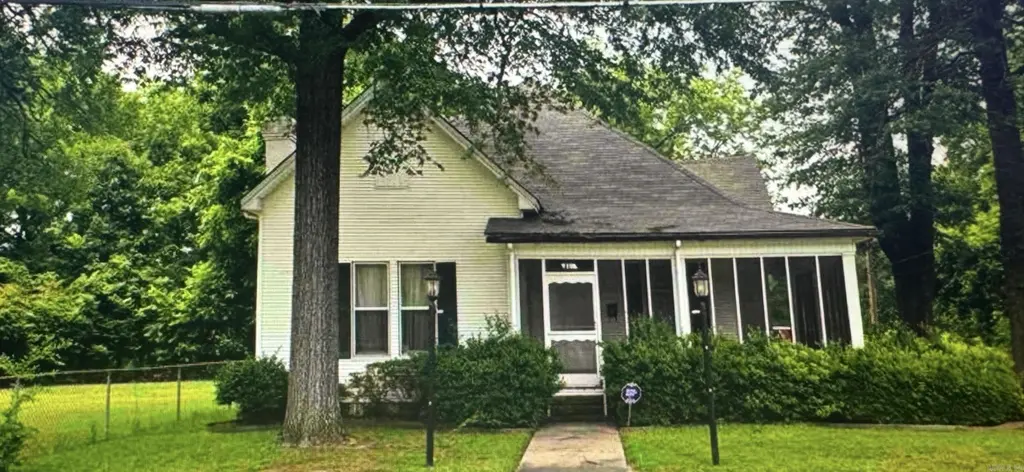
519 E 15th · Pine Bluff, AR
Flood risk 1/10 · Minimal
- FEMA flood zone
- X (unshaded)
- Chance of flooding over 30 yrs
- 0.0%
- Est. flood insurance / yr
- $507 – $1,088
Fire risk 2/10 · Minimal
- Est. fire insurance / yr
- $1,499 – $2,785
Heat risk 6/10 · Moderate
- Hot days now (above 111°F)
- 7 days/yr
- Hot days in 30 yrs
- 19 days/yr
Wind risk 4/10 · Minor
- Chance of severe wind over 30 yrs
- 20.0%
Air-quality risk 1/10 · Minimal
- Unhealthy air days now
- 0 days/yr
- Unhealthy air days in 30 yrs
- 0 days/yr
Risk factors via First Street. Map © Google.
Why this score? — see what drove the B- grade
The composite is a weighted blend of 9 inputs, each scored 0–100. Each bar is that input's sub-score; the figure is the points it added to the 100-point composite (weight × sub-score).
- Cash flow +26.6/30.0
- ARV discount +15.0/15.0
- DSCR +9.1/10.0
- 1% rule +6.3/10.0
- Appreciation +3.2/10.0
- Rent growth +2.5/5.0
- Livability +2.5/5.0
- Condition / age +2.5/5.0
- Schools +0.6/10.0
$75,000
🖨 Deal sheet (PDF) 📄 Offer letter ✓ Due diligence
Listing remarks
Welcome to this charming 2-story home nestled on a corner lot in Pine Bluff. Offering 3 bedrooms and 1 bath, this home blends classic character with functional space. The primary bedroom is conveniently located on the main level, with two additional bedrooms upstairs. Inside, you’ll find a formal living room, den, and dining room—perfect for both everyday living and entertaining. Cozy up by the wood-burning fireplace or relax on the screened-in front porch and enjoy the peaceful surroundings. The property also includes a garage, central heat and air, and an additional lot—providing endless possibilities for expansion, investment, or outdoor enjoyment. With just a little vi
Key facts
- Additional lot
- Formal living room
- Corner lot
Tags
Property features AI
Exterior
- Parking: Detached 2-car garage
- Utilities: Public sewer; Public water; Electric (municipal, Entergy); Natural gas
- Home design: Frame exterior
- Construction: Crawl space foundation; 3-tab shingle roof
- Exterior features: Corner lot; Located in a subdivision; Paved road
Interior
- Flooring: Carpet; Wood; Vinyl
- Bathrooms: 1 full bathroom
- Heating & cooling: Central heating (gas); Central cooling (electric)
- Interior features: Formal living room; Den / family room; Office / study; Wood-burning fireplace (site-built)
- Laundry & utility: Laundry room
Neighborhood map
What this means for you Summary
Snapshot
- This is a 3-bed/1.0-bath single-family listed at $75k.
Deal economics
- At list price, monthly cash flow is $200 ($2k/yr) — positive.
- The deal already cash-flows at list — no discount required.
- Meets the 1% rule at list price ($850 rent vs $75k).
- Recommended offer: $73k (3.0% below list) — sets the bar for market timing.
Location & tenants
- Location reads 50/100 on livability (#483 in AR) — a working-class tenant base; expect higher turnover. Strengths: cost of living A+, housing A; Watch: schools F, crime F, amenities F.
- Pine Bluff School District (urban): math 6% / reading 9% proficiency, ranked #236 of 238 in AR (top 99%) — low school quality limits family demand, transient renter base, plan for 1-2y turnover; 85% free/reduced lunch — lower-income household profile, screen leases tightly.
- Market conditions: 90 active listings in the ZIP; 1 comparable units currently listed for rent nearby; 62 units permitted in Jefferson County in 2024 (0 in 5+ unit buildings).
Forward outlook
- Local home prices are declining (-3.0%/yr); year-one equity from $519 of loan paydown is wiped out by about $2k of value loss. Plan a longer hold.
- Jefferson County population projected at -33% by 2050 — secular population decline; favor cash flow + early exit over multi-decade hold.
- At projected returns (-3.0% appreciation + 3.0% rent growth), your $21k cash investment doubles in ~10 years — after that, you're playing with house money.
Negotiation context
- It's been on market 59 days — a 3% lower offer ($73k) is reasonable based on typical stale-listing flexibility.
- 9 sale attempts since 3y ago with the ask held roughly flat each time — persistent listings suggest the price (not the market) is what's stuck; bring a comps-based counter.
Risks & watch-outs
- Watch-outs: built in 1919 — expect roof / HVAC / electrical / plumbing capex.
- Climate carrying-cost: extreme-heat days projected 7→19/yr by 2055 (HVAC capex compounding) — expect insurance premiums to compound above CPI over the hold.
Questions for the listing agent
- It's been on market 59 days. Have you received any prior offers? Is the seller open to a 3% concession, seller financing, or rate buy-down credit?
- Built in 1919 — when were the roof, HVAC, electrical panel, plumbing, and water heater last replaced?
- Is there a deadline driving the sale (1031 exchange, divorce, estate, relocation)? That informs how much negotiation room exists.
- Schools are F-rated, which usually means shorter tenancies and higher turnover. Who's the typical renter profile here, and what's been the actual vacancy rate?
- Crime grade is F in this area — have there been break-ins, vandalism, or insurance claims at this property in the last 3 years? What carrier currently insures it and at what premium?
- What's the average days-on-market for RENTAL listings here right now (not sales)? A rising rental-DOM trend means longer vacancies and softer asking-rent achievability than the comps imply.
- What's the recent tenant-quality profile in this submarket — average credit score on applications, eviction rate, late-payment / NSF rate, and stable-employment percentage? A property-management company in the area should have these aggregated.
- How much new for-sale + rental construction is in the pipeline within 1–3 miles? Heavy new supply typically softens prices + rents 12–24 months out; constrained supply supports both.
Investment metrics
- 1% rule
- 1.13% ✓
- Cap rate
- 9.50%
- Cash-on-cash
- 11.44%
- DSCR
- 1.51
- GRM
- 7.4
CMA / ARV
- ARV (median comp)
- $96,386
- List price
- $75,000
- Delta
- -22.19%
- Verdict
- UNDERPRICED
- Comps
- 20 within 1.0 mi
Show comp detail 7 sales within ~0.75 mi
| Address | Dist | Beds/Ba | Sqft | Sold | Price | $/sf | Match |
|---|---|---|---|---|---|---|---|
| 315 W 15th Ave | 0.42mi | 3/2.0 | 1,856 (+5%) | 0mo | $3,500 | $2 | 68 |
| 402 W 15th Ave | 0.46mi | 3/2.0 | 1,778 (+0%) | 10mo | $97,500 | $55 | 66 |
| 817 S Walnut St | 0.62mi | 3/1.5 | 1,682 (-5%) | 4mo | $9,000 | $5 | 57 |
| 1006 E 10th Ave | 0.46mi | 3/2.0 | 1,626 (-8%) | 8mo | $147,500 | $91 | 54 |
| 511 W 20th Ave | 0.64mi | 4/2.0 (+1) | 1,829 (+3%) | 11mo | $22,000 | $12 | 47 |
| 300 W 11th Ave | 0.49mi | 4/2.5 (+1) | 1,710 (-3%) | 22mo | $76,500 | $45 | 42 |
| 1423 Belmoor Dr | 0.70mi | 3/2.0 | 1,548 (-12%) | 24mo | $110,000 | $71 | 22 |
Match score weights: distance 35% · size 25% · config 20% · recency 20%. Top-matched comps best support the ARV.
Projected returns pro-forma
-3.0% appreciation · 3.0% rent growth · sell at horizon
- IRR
- 0.7%
- Equity multiple
- 1.03×
- Total profit
- $584
- Equity at exit
- $11,183
- IRR
- 10.3%
- Equity multiple
- 1.80×
- Total profit
- $16,865
- Equity at exit
- $6,485
Cash invested: $21,000 (down + closing). Projections, not guarantees.
Landlord ↔ Tenant lean methodology
- Overall (STATE)
- 92 Strongly Landlord-Friendly
- State Arkansas
- 92 Strongly Landlord-Friendly · R+14
- County
- — inherits STATE
- City
- — inherits STATE
ZIP-level market 71601
- Home prices YoY
- -2.1%
- Active inventory
- 90
- Price-to-rent
- 7.4×
Monthly cashflow live
- Estimated rent
- $850 medium interval (Pro) →
- Mortgage (P&I)
- −$393
- Tax from tax record
- −$47 /mo · $560/yr
- Insurance
- −$31
- HOA
- −$0
- Vacancy / Maint / Mgmt
- −$178
- Net cashflow
- $200
Break-even live
Sensitivity live
| Price | -10% $243 | -5% $221 | +0% $200 | +5% $179 | +10% $158 |
|---|---|---|---|---|---|
| Rent | -10% $133 | -5% $167 | +0% $200 | +5% $234 | +10% $267 |
| Rate | -1.0pp $238 | -0.5pp $219 | base $200 | +0.5pp $181 | +1.0pp $161 |
UW: 25.0% down · 7.5% · 30yr · 1.5% tax · 5.0% vac · 8.0% maint · 8.0% mgmt
Financing live
Cash to close
- Down payment
- $18,750
- Closing costs
- $2,250
- Reserves months
- —
- Total cash needed
- —
Loan-product check · same deal, 3 products live
Conventional
25% down · 7.5% · 30yr
- Down + closing
- —
- Monthly P&I
- —
- Monthly cashflow
- —
- DSCR
- —
- Eligible?
- —
Personal DTI + credit; lowest rate.
DSCR
20% down · 8.5% · 30yr
- Down + closing
- —
- Monthly P&I
- —
- Monthly cashflow
- —
- DSCR
- —
- Eligible?
- —
No personal income docs; deal must DSCR.
Hard money
10% down · 12.0% · 12mo
- Down + closing
- —
- Monthly P&I
- —
- Monthly cashflow
- —
- DSCR
- —
- Eligible?
- —
Short-term bridge; refi at stabilization.
Rent comps 1 comps
| Address | Beds | Baths | Sqft | Rent | $/sqft | DOM | Units | Dist |
|---|---|---|---|---|---|---|---|---|
| 107 S Beech St Pine Bluff, AR | 3.0 | 2.0 | 1346 | $850 | $0.63 | 45d | 1 | 1.14mi |
Listing history 40 events
-
2026-06-21days on market $75,000 Active 59 DOM
-
2026-06-19days on market $75,000 Active 57 DOM
-
2026-06-18days on market $75,000 Active 56 DOM
-
2026-06-17days on market $75,000 Active 55 DOM
-
2026-06-16days on market $75,000 Active 54 DOM
-
2026-06-15days on market $75,000 Active 53 DOM
-
2026-06-14days on market $75,000 Active 51 DOM
-
2026-06-12days on market $75,000 Active 50 DOM
-
2026-06-09days on market $75,000 Active 47 DOM
-
2026-06-08days on market $75,000 Active 46 DOM
-
2026-06-07days on market $75,000 Active 45 DOM
-
2026-06-05days on market $75,000 Active 42 DOM
-
2026-06-03days on market $75,000 Active 41 DOM
-
2026-06-02days on market $75,000 Active 40 DOM
-
2026-06-01days on market $75,000 Active 39 DOM
-
2026-05-31days on market $75,000 Active 38 DOM
-
2026-05-30days on market $75,000 Active 37 DOM
-
2026-04-22$75,000 New Listing 774-char remark
-
2026-01-04historical
-
2025-09-06price $77,600
-
2025-07-19$80,000 New Listing
-
2025-07-17historical
-
2025-06-06$80,000 New Listing
-
2025-05-06historical
-
2025-03-05$80,000 New Listing
-
2025-03-05historical
-
2025-03-05$94,900 New Listing
-
2025-03-05historical
-
2025-03-05$80,900 New Listing
-
2024-12-20historical
-
2024-11-24price $85,000
-
2024-08-19$90,000 New Listing
-
2024-07-18historical
-
2024-06-25status Back on Market
-
2024-06-21historical
-
2024-05-17price $94,900
-
2024-04-04price $100,000
-
2024-04-02price $99,900
-
2024-02-22price $125,000
-
2023-12-26$159,900 New Listing
ⓘ Source: listings_history table (triggers on properties + properties_extension) + one-shot
backfill from property_details.listing_events for pre-trigger history.
Tax reassessment forecast AR · Resets to sale price
- Current annual tax
- $560 · $47/mo
- Projected year-2 tax
- $560 · $47/mo
- Expected delta
- $0/yr ($0/mo · 0.0%)
ⓘ Screening estimate from a state-policy table — verify with the county assessor before closing.
Climate risk First Street
- Flood 1/10 Low FEMA zone X (unshaded) · 0% chance over 30 yrs
- Wildfire 2/10 Low
- Heat 6/10 Major 7 d/yr ≥111°F today · 19 d/yr by 30 yrs out
- Wind 4/10 Moderate 20% chance of damaging wind over 30 yrs
- Air quality 1/10 Low 0 unhealthy d/yr today · 0 by 30 yrs out
Nearby sold comps map
Loading sold comps map…
Walkable amenities ~0.75 mi
Loading nearby amenities…
Taxation est. · year 1
- Rental income
- $10,200
- − Mortgage interest
- −$4,201
- − Property taxes
- −$560
- − Insurance
- −$375
- − Repairs & maintenance
- −$816
- − Management
- −$816
- − Depreciation
- −$2,182
- Taxable income
- $1,250
- Est. tax owed @ 24.0%
- −$300
- After-tax cash flow
- $2,103/yr
For passive investors: Depreciation is non-cash, so a rental often shows a tax loss while cash-flowing — sheltering income. Rental losses are passive: they offset passive income freely, and up to $25,000/yr can offset ordinary (W-2) income if you actively participate and your MAGI is under $100k (phasing out to $0 by $150k); unused losses carry forward. On sale, claimed depreciation is recaptured at up to 25%, and gains may owe capital-gains tax (a 1031 exchange can defer both). Figures are a year-1 estimate at your 24.0% rate — not tax advice; consult a CPA.
Schools (NCES district)
- District
- Pine Bluff School District
- NCES district ID
- 0500026
- Math proficiency
- 6% ▼ -9.00%
- Reading proficiency
- 9% ▼ -7.00%
- Median HH income
- $32,374
- Composite
- 5.86/100
- National rank
- #10014
- State rank
- #236 of 238 in AR
Livability — Pine Bluff
- Score
- 50/100
- State rank
- #483
- US rank
- #25645
Category grades
Schools grade is shown separately in the Schools card above.
Census & demographics
- Census place
- Pine Bluff, AR
- City population
- 29,578
- Population (ZIP)
- 13,981
Population outlook (Jefferson County) Hauer SSP2
- Today (2025)
- 63,110 people
- By 2030
- 58,519 · -7.3%
- By 2040
- 49,740 · -21.2%
- By 2050
- 42,331 · -32.9%
- By 2075
- 29,591 · -53.1%
- By 2100
- 21,047 · -66.7%
Race, ethnicity, and origin ACS 2023
- Neighborhood character
- Predominantly Black (81%)
- Race & ethnicity
- Black 81% White 13% Two or more races 4% Hispanic / Latino 2%
- Foreign-born
- 1% · Canada
- Languages at home
- 97% English-only · Spanish 2%
Political lean MEDSL · Jefferson
- 2024 margin
- Strong D (+20.1) · D 59.2% · R 39.2% · Other 1.6%
- 2008→2024 swing
- -6.2pp toward R · 2008: 26.3pp · 2024: 20.1pp
- All cycles
- 2024: D+20.1 2020: D+21.7 2016: D+25.3 2012: D+29.0 2008: D+26.3
Not yet ingested
- Civics
- —
Market trends
- HPI YoY
- ▼ -3.51%
- Current HPI
- 160.3064
- Rent YoY
- —
- Metro
- —
- State GDP YoY
- ▲ 3.80%
- F500 in state
- 10
Industry mix (Fortune 500 HQ in AR)
| Industry | F500 HQs | Revenue |
|---|---|---|
| Retail | 1 | $681B |
|
||
| Food / Agriculture | 1 | $53B |
|
||
| Retail / Energy | 1 | $22B |
|
||
| Transportation / Logistics | 1 | $12B |
|
||
| Energy | 1 | $4B |
|
||
Price history
-53.1% since first listed23 events — show timeline
- 2026-04-22 Listed $75,000 CARMLS
- 2026-01-04 Listing Removed — CARMLS
- 2025-09-06 Price Changed $77,600 CARMLS
- 2025-07-19 Listed $80,000 CARMLS
- 2025-07-17 Listing Removed — CARMLS
- 2025-06-06 Listed $80,000 CARMLS
- 2025-05-06 Listing Removed — CARMLS
- 2025-03-05 Listed $80,900 CARMLS
- 2025-03-05 Listing Removed — CARMLS
- 2025-03-05 Listed $94,900 CARMLS
- 2025-03-05 Listing Removed — CARMLS
- 2025-03-05 Listed $80,000 CARMLS
- 2024-12-20 Listing Removed — CARMLS
- 2024-11-24 Price Changed $85,000 CARMLS
- 2024-08-19 Listed $90,000 CARMLS
- 2024-07-18 Listing Removed — CARMLS
- 2024-06-25 Relisted — CARMLS
- 2024-06-21 Listing Removed — CARMLS
- 2024-05-17 Price Changed $94,900 CARMLS
- 2024-04-04 Price Changed $100,000 CARMLS
- 2024-04-02 Price Changed $99,900 CARMLS
- 2024-02-22 Price Changed $125,000 CARMLS
- 2023-12-26 Listed $159,900 CARMLS
Property tax history
+12.0%/yrLatest (2025): $560 · +0.0% YoY. Source: county tax records.
Cash-flow waterfall
monthlySold comps — $/sqft
last 12 mo · ≤1 miLoading sold comps…