201 Wilkes St · Farragut, IA
Flood risk 1/10 · Minimal
- FEMA flood zone
- X (unshaded)
- Chance of flooding over 30 yrs
- 0.0%
- Est. flood insurance / yr
- $473 – $860
Fire risk 1/10 · Minimal
- Est. fire insurance / yr
- $902 – $1,676
Heat risk 4/10 · Minor
- Hot days now (above 107°F)
- 7 days/yr
- Hot days in 30 yrs
- 15 days/yr
Wind risk 2/10 · Minimal
- Chance of severe wind over 30 yrs
- —
Air-quality risk 1/10 · Minimal
- Unhealthy air days now
- 0 days/yr
- Unhealthy air days in 30 yrs
- 0 days/yr
Risk factors via First Street. Map © Google.
Why this score? — see what drove the A grade
The composite is a weighted blend of 9 inputs, each scored 0–100. Each bar is that input's sub-score; the figure is the points it added to the 100-point composite (weight × sub-score).
- Cash flow +29.1/30.0
- ARV discount +15.0/15.0
- DSCR +10.0/10.0
- Appreciation +9.9/10.0
- 1% rule +8.0/10.0
- Schools +5.6/10.0
- Livability +3.2/5.0
- Rent growth +2.5/5.0
- Condition / age +2.5/5.0
$99,000
🖨 Deal sheet 📄 Offer letter ✓ Due diligence
Listing remarks
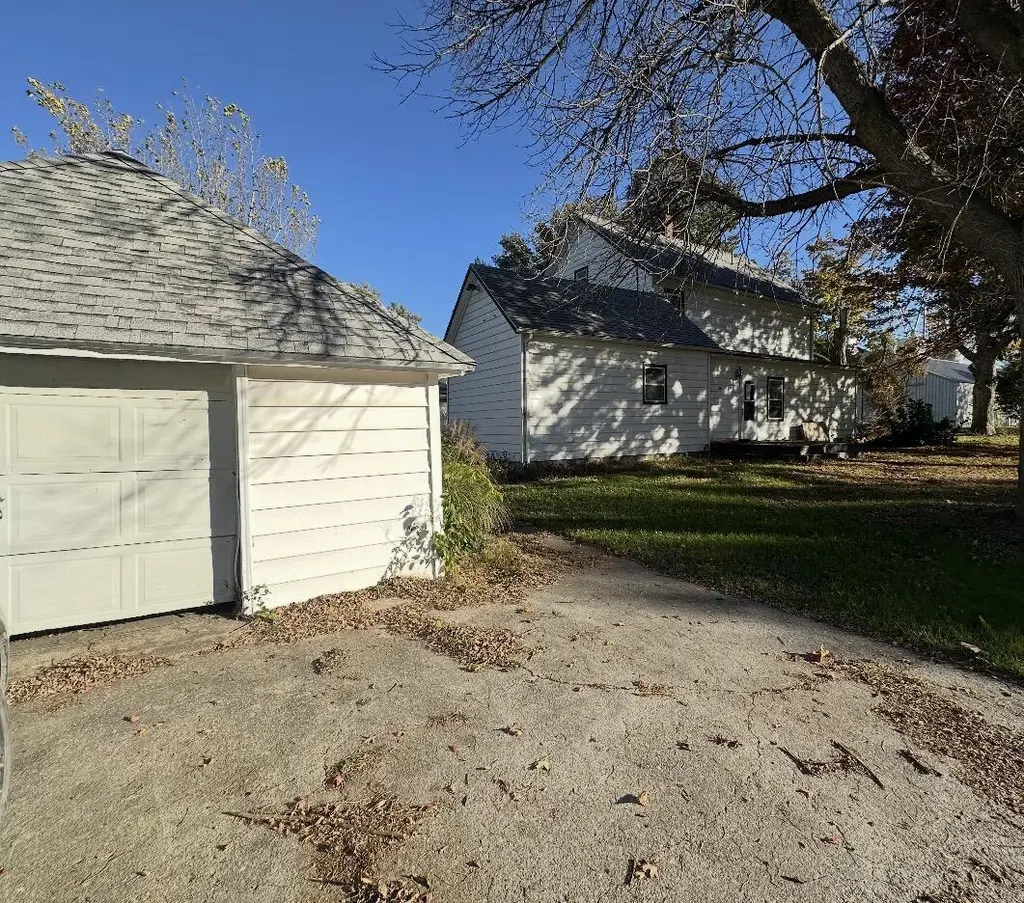
Opportunity awaits with this spacious 2-story home featuring 4 bedrooms and 1.5 baths! This property offers great potential for an investor, flipper, or buyer looking to build equity with a little work. Inside you'll find a functional layout, a full unfinished basement for extra storage or future finishing potential, and a newer furnace installed in 2024. Outside, enjoy the detached 1-stall garage and a unique stamped concrete patio complete with a built-in fireplace -- perfect for entertaining or relaxing evenings outdoors. The home does need flooring, clean-out, and cosmetic updates, but the possibilities are there for the right buyer willing to put in some sweat equity.
Key facts
- Built-in fireplace
- Garage
- Built 1890
Tags
Property features AI
Exterior
- Parking: Off-street parking; 1-car garage
- Security: Smoke detector(s)
- Utilities: Natural gas available
- Home design: Single family residence; Residential property; 2 stories
- Construction: Frame construction; Composition roof
- Exterior features: Patio; Deck; Lot about 0.22 acres
Interior
- Heating & cooling: Forced air heating; Central air; Ceiling fan(s) for cooling
- Interior features: Ceiling fan(s); Fireplace; Full unfinished basement
- Laundry & utility: No dedicated laundry features listed
Neighborhood map
What this means for you Summary
Snapshot
- This is a 4-bed/1.5-bath single-family listed at $99k.
Deal economics
- At list price, monthly cash flow is $342 ($4k/yr) — positive.
- The deal already cash-flows at list — no discount required.
- Meets the 1% rule at list price ($1k rent vs $99k).
- Recommended offer: $96k (3.0% below list) — sets the bar for market timing.
Location & tenants
- Location reads 64/100 on livability (#601 in IA) — a middle-class / working-renter tenant base. Strengths: cost of living A+, housing A+; Watch: amenities F, commute F, health & safety F.
- Shenandoah Community School District (town): math 64% / reading 69% proficiency, ranked #190 of 289 in IA (top 66%) — acceptable for families but not a draw, mixed tenant base, ~2y average lease.
- Zoned schools: Shenandoah Elementary School (math 77% / reading 57%, grade B+, #273 of 616 statewide, top 51%, 375 students, 39% FRL); Shenandoah Middle School (math 61% / reading 74%, grade A-, #133 of 246 statewide, top 56%, 296 students, 38% FRL); Shenandoah High School (math 61% / reading 68%, grade B-, #211 of 336 statewide, top 70%, 259 students, 38% FRL) — zoned schools at 38% FRL track the district average.
- Market conditions: 4 active listings in the ZIP; 7 units permitted in Fremont County in 2024 (0 in 5+ unit buildings).
Forward outlook
- In year one you build about $10k of equity ($684 loan paydown + $10k appreciation (9.8% local appreciation)).
- Fremont County population projected at -33% by 2050 — secular population decline; favor cash flow + early exit over multi-decade hold.
- At projected returns (9.8% appreciation + 3.0% rent growth), your $28k cash investment doubles in ~2 years — after that, you're playing with house money.
- By year 4, paydown + projected appreciation supports a ~$37k cash-out refi (75% LTV) — recoverable capital for the next deal without selling this one.
Negotiation context
- It's been on market 34 days — a 3% lower offer ($96k) is reasonable based on typical stale-listing flexibility.
- 4 sale attempts since 10y ago; this cycle's ask has dropped $26k (21%) from the opening price — seller is motivated, your offer sets the floor, not the list.
- Current owner paid $59k; list at $99k implies a 68% gain — meaningful room to come down on a strong offer.
Risks & watch-outs
- Watch-outs: built in 1890 — expect roof / HVAC / electrical / plumbing capex.
Questions for the listing agent
- It's been on market 34 days. Have you received any prior offers? Is the seller open to a 3% concession, seller financing, or rate buy-down credit?
- Built in 1890 — when were the roof, HVAC, electrical panel, plumbing, and water heater last replaced?
- Is there a deadline driving the sale (1031 exchange, divorce, estate, relocation)? That informs how much negotiation room exists.
- Schools are D-rated, which usually means shorter tenancies and higher turnover. Who's the typical renter profile here, and what's been the actual vacancy rate?
- What's the average days-on-market for RENTAL listings here right now (not sales)? A rising rental-DOM trend means longer vacancies and softer asking-rent achievability than the comps imply.
- What's the recent tenant-quality profile in this submarket — average credit score on applications, eviction rate, late-payment / NSF rate, and stable-employment percentage? A property-management company in the area should have these aggregated.
- How much new for-sale + rental construction is in the pipeline within 1–3 miles? Heavy new supply typically softens prices + rents 12–24 months out; constrained supply supports both.
Investment metrics
- 1% rule
- 1.30% ✓
- Cap rate
- 10.44%
- Cash-on-cash
- 14.82%
- DSCR
- 1.66
- GRM
- 6.4
CMA / ARV
- ARV (median comp)
- $149,687
- List price
- $99,000
- Delta
- -33.86%
- Verdict
- UNDERPRICED
- Comps
- 10 within 1.0 mi
Show comp detail 1 sale within ~0.75 mi
| Address | Dist | Beds/Ba | Sqft | Sold | Price | $/sf | Match |
|---|---|---|---|---|---|---|---|
| 1110 New Orleans Ave | 0.21mi | 3/3.0 (-1) | 2,067 (+12%) | 13mo | $290,000 | $140 | 48 |
Match score weights: distance 35% · size 25% · config 20% · recency 20%. Top-matched comps best support the ARV.
Projected returns pro-forma
9.82% appreciation · 3.0% rent growth · sell at horizon
- IRR
- 34.9%
- Equity multiple
- 3.69×
- Total profit
- $74,520
- Equity at exit
- $87,900
- IRR
- 30.1%
- Equity multiple
- 8.29×
- Total profit
- $202,020
- Equity at exit
- $188,206
Cash invested: $27,720 (down + closing). Projections, not guarantees.
Landlord ↔ Tenant lean methodology
- Overall (STATE)
- 83 Strongly Landlord-Friendly
- State Iowa
- 83 Strongly Landlord-Friendly · R+6
- County
- — inherits STATE
- City
- — inherits STATE
ZIP-level market 51639
- Home prices YoY
- 5.3%
- Active inventory
- 4
- Price-to-rent
- 6.4×
Monthly cashflow live
- Estimated rent
- $1,290 medium interval (Pro) →
- Mortgage (P&I)
- −$519
- Tax from tax record
- −$116 /mo · $1,398/yr
- Insurance
- −$41
- HOA
- −$0
- Vacancy / Maint / Mgmt
- −$271
- Net cashflow
- $342
Break-even live
UW: 25.0% down · 7.5% · 30yr · 1.5% tax · 5.0% vac · 8.0% maint · 8.0% mgmt
Financing live
Cash to close
- Down payment
- $24,750
- Closing costs
- $2,970
- Reserves months
- —
- Total cash needed
- —
Loan-product check · same deal, 3 products live
Conventional
25% down · 7.5% · 30yr
- Down + closing
- —
- Monthly P&I
- —
- Monthly cashflow
- —
- DSCR
- —
- Eligible?
- —
Personal DTI + credit; lowest rate.
DSCR
20% down · 8.5% · 30yr
- Down + closing
- —
- Monthly P&I
- —
- Monthly cashflow
- —
- DSCR
- —
- Eligible?
- —
No personal income docs; deal must DSCR.
Hard money
10% down · 12.0% · 12mo
- Down + closing
- —
- Monthly P&I
- —
- Monthly cashflow
- —
- DSCR
- —
- Eligible?
- —
Short-term bridge; refi at stabilization.
Listing history 22 events
-
2026-06-18price $99,000 Active 34 DOM
-
2026-06-18days on market $100,000 Active 34 DOM
-
2026-06-17days on market $100,000 Active 33 DOM
-
2026-06-16days on market $100,000 Active 32 DOM
-
2026-06-15days on market $100,000 Active 31 DOM
-
2026-06-13days on market $100,000 Active 29 DOM
-
2026-06-12days on market $100,000 Active 28 DOM
-
2026-06-09days on market $100,000 Active 25 DOM
-
2026-06-08days on market $100,000 Active 24 DOM
-
2026-06-07days on market $100,000 Active 23 DOM
-
2026-06-07pricedays on market $100,000 Active 22 DOM
-
2026-06-04days on market $105,000 Active 19 DOM
-
2026-06-02days on market $105,000 Active 18 DOM
-
2026-06-01days on market $105,000 Active 17 DOM
-
2026-05-31days on market $105,000 Active 16 DOM
-
2026-05-31pricedays on market $105,000 Active 15 DOM
-
2026-05-15$125,000 Active 684-char remark
-
2018-10-15$63,000
-
2017-11-09soldstatus $59,000
-
2017-11-07soldstatus $58,900
-
2017-05-18$58,500
-
2016-07-31$59,000
ⓘ Source: listings_history table (triggers on properties + properties_extension) + one-shot
backfill from property_details.listing_events for pre-trigger history.
Tax reassessment forecast IA · Partial reset (capped growth)
- Current annual tax
- $1,398 · $116/mo
- Projected year-2 tax
- $1,476 · $123/mo
- Expected delta
- +$78/yr (+$7/mo · 5.6%)
ⓘ Screening estimate from a state-policy table — verify with the county assessor before closing.
Climate risk First Street
- Flood 1/10 Low FEMA zone X (unshaded) · 0% chance over 30 yrs
- Wildfire 1/10 Low
- Heat 4/10 Moderate 7 d/yr ≥107°F today · 15 d/yr by 30 yrs out
- Wind 2/10 Low
- Air quality 1/10 Low 0 unhealthy d/yr today · 0 by 30 yrs out
Nearby sold comps map
Loading sold comps map…
Walkable amenities ~0.75 mi
Loading nearby amenities…
Taxation est. · year 1
- Rental income
- $15,481
- − Mortgage interest
- −$5,546
- − Property taxes
- −$1,398
- − Insurance
- −$495
- − Repairs & maintenance
- −$1,238
- − Management
- −$1,238
- − Depreciation
- −$2,880
- Taxable income
- $2,685
- Est. tax owed @ 24.0%
- −$644
- After-tax cash flow
- $3,462/yr
For passive investors: Depreciation is non-cash, so a rental often shows a tax loss while cash-flowing — sheltering income. Rental losses are passive: they offset passive income freely, and up to $25,000/yr can offset ordinary (W-2) income if you actively participate and your MAGI is under $100k (phasing out to $0 by $150k); unused losses carry forward. On sale, claimed depreciation is recaptured at up to 25%, and gains may owe capital-gains tax (a 1031 exchange can defer both). Figures are a year-1 estimate at your 24.0% rate — not tax advice; consult a CPA.
Schools (NCES district)
- District
- Shenandoah Community School District
- NCES district ID
- 1926070
- Math proficiency
- 64% ▼ -10.00%
- Reading proficiency
- 69% ▼ -5.00%
- Median HH income
- $41,835
- Composite
- 55.67/100
- National rank
- #1225
- State rank
- #190 of 289 in IA
Livability — Farragut
- Score
- 64/100
- State rank
- #601
- US rank
- #13697
Category grades
Schools grade is shown separately in the Schools card above.
Census & demographics
- Census place
- Farragut, IA
- Population (ZIP)
- 884
Population outlook (Fremont County) Hauer SSP2
- Today (2025)
- 6,095 people
- By 2030
- 5,632 · -7.6%
- By 2040
- 4,806 · -21.1%
- By 2050
- 4,106 · -32.6%
- By 2075
- 2,947 · -51.6%
- By 2100
- 2,205 · -63.8%
Race, ethnicity, and origin ACS 2023
- Neighborhood character
- Predominantly White (94%)
- Race & ethnicity
- White 94% Two or more races 6% Hispanic / Latino 3%
- Common ancestry
- Italian 2% Slovak 2% Scottish 2%
- Foreign-born
- 3% · Canada
- Languages at home
- 96% English-only · Spanish 3% German/W. Germanic 1%
Political lean MEDSL · Fremont
- 2024 margin
- Solid R (+44.6) · D 27.0% · R 71.6% · Other 1.4%
- 2008→2024 swing
- -41.0pp toward R · 2008: -3.6pp · 2024: -44.6pp
- All cycles
- 2024: R+44.6 2020: R+42.3 2016: R+40.6 2012: R+9.2 2008: R+3.6
Not yet ingested
- Civics
- —
Market trends
- HPI YoY
- ▲ 9.82%
- Current HPI
- 193.5983
- Rent YoY
- —
- Metro
- —
- State GDP YoY
- ▲ 2.48%
- F500 in state
- 4
Industry mix (Fortune 500 HQ in IA)
| Industry | F500 HQs | Revenue |
|---|---|---|
| Financial Services | 1 | $16B |
|
||
| Retail / Convenience | 1 | $15B |
|
||
Price history
+69.5% since first listed9 events — show timeline
- 2026-06-06 Price Changed $100,000 SWIAR
- 2026-05-30 Price Changed $105,000 SWIAR
- 2026-05-21 Price Changed $115,000 SWIAR
- 2026-05-15 Listed $125,000 SWIAR
- 2018-10-15 Listed $63,000 IAR
- 2017-11-09 Sold (Public Records) $59,000 Public Records
- 2017-11-07 Sold (MLS) $58,900 IAR
- 2017-05-18 Listed $58,500 IAR
- 2016-07-31 Listed $59,000 SWIAR
Property tax history
+0.7%/yrLatest (2025): $1,398 · +2.6% YoY. Source: county tax records.
Cash-flow waterfall
monthlySold comps — $/sqft
last 12 mo · ≤1 miLoading sold comps…