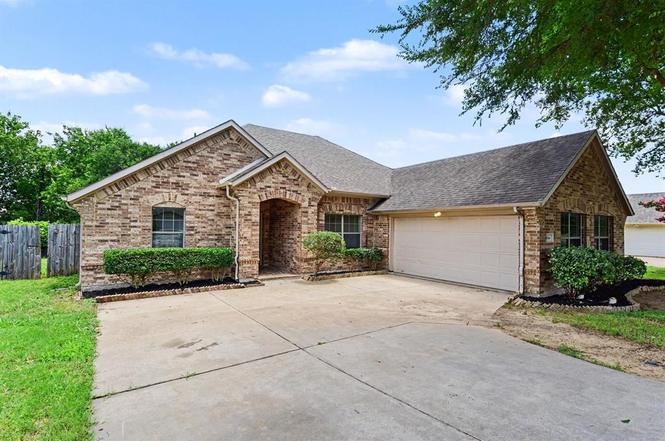
504 Hidden Meadow Ct · DeSoto, TX
Flood risk 1/10 · Minimal
- FEMA flood zone
- X (unshaded)
- Chance of flooding over 30 yrs
- 0.0%
- Est. flood insurance / yr
- $507 – $1,088
Fire risk 1/10 · Minimal
- Est. fire insurance / yr
- $1,222 – $2,270
Heat risk 7/10 · Major
- Hot days now (above 110°F)
- 7 days/yr
- Hot days in 30 yrs
- 25 days/yr
Wind risk 6/10 · Moderate
- Chance of severe wind over 30 yrs
- 27.0%
Air-quality risk 2/10 · Minimal
- Unhealthy air days now
- 2 days/yr
- Unhealthy air days in 30 yrs
- 2 days/yr
Risk factors via First Street. Map © Google.
Why this score? — see what drove the D+ grade
The composite is a weighted blend of 9 inputs, each scored 0–100. Each bar is that input's sub-score; the figure is the points it added to the 100-point composite (weight × sub-score).
- ARV discount +15.0/15.0
- Cash flow +14.7/30.0
- 1% rule +5.9/10.0
- DSCR +4.5/10.0
- Livability +3.3/5.0
- Condition / age +2.5/5.0
- Rent growth +1.9/5.0
- Schools +1.9/10.0
- Appreciation +0.0/10.0
$215,000
🖨 Deal sheet (PDF) 📄 Offer letter ✓ Due diligence
Listing remarks
This four-bedroom, two-bathroom, one-story home features an open floor plan that creates a seamless, airy feel throughout the main living spaces. The inviting interior is centered around a cozy fireplace in the main living area, which flows into a thoughtfully updated kitchen boasting granite countertops and sleek black appliances, making it a functional and stylish space for cooking and entertaining. The primary suite offers a private retreat, complete with a large walk-in closet and an attached en-suite bathroom featuring a double-sink vanity. Outside, the property includes a two-car garage and a private, fully fenced backyard that provides a secure space for outdoor entertaining or garde
Key facts
- Black appliances
- Double-sink vanity
- Open floor plan
Tags
Property features AI
Finance
- Other: Subdivision: South Meadows 5th Sec; County: Dallas
- Financial info: Listing accepts cash and conventional financing
- HOA & community: Mandatory HOA with monthly fee of $275; HOA fee includes management fees
Exterior
- Parking: Attached 2-car garage; 2 covered parking spaces
- Utilities: Electricity connected; Natural gas available; Sewer available; Not in a municipal utility district
- Home design: Single-family residence; One story; Residential property
- Construction: Built in 2006; Brick construction; Composition roof; Slab foundation
- Exterior features: Back yard fencing; Lot under 0.5 acre (approx. 0.22 acres) with irregular dimensions
Interior
- Kitchen: Dishwasher; Microwave
- Bedrooms: Primary bedroom on level 1 (approx. 14 x 16); Bedroom on level 1 (approx. 14 x 10); Bedroom on level 1 (approx. 10 x 12); Bedroom on level 1 (approx. 17 x 16)
- Flooring: Carpet; Laminate; Tile
- Bathrooms: Two full bathrooms
- Heating & cooling: Central heating (natural gas); Central air conditioning
- Interior features: Walk-in closet(s); Six total rooms; One living area; One dining area; Living room fireplace
- Laundry & utility: Laundry area (other)
Neighborhood map
What this means for you Summary
Snapshot
- This is a 4-bed/2.0-bath single-family listed at $215k.
Deal economics
- At list price, monthly cash flow is $54 ($645/yr) — positive.
- The deal already cash-flows at list — no discount required.
- Meets the 1% rule at list price ($2k rent vs $215k).
- Cap rate 6.6% vs local median 3.4% in DeSoto — top-decile yield for the area; either an underpriced asset or a hidden risk that comps aren't pricing in. Stress-test before assuming the spread holds.
Location & tenants
- Location reads 66/100 on livability (#589 in TX) — a middle-class / working-renter tenant base. Strengths: cost of living A+, housing A+; Watch: amenities F, commute F, health & safety D-.
- Desoto ISD (suburban): math 14% / reading 26% proficiency, ranked #754 of 826 in TX (top 91%) — low school quality limits family demand, transient renter base, plan for 1-2y turnover; 66% free/reduced lunch — lower-income household profile, screen leases tightly.
- Zoned schools: Woodridge El (math 11% / reading 21%, grade F, #3,974 of 4,322 statewide, top 92%, 601 students, 78% FRL); Ruby Young Personalized Steam Academy (math 7% / reading 15%, grade F, #1,634 of 1,662 statewide, top 99%, 179 students, 54% FRL); Desoto H S (math 16% / reading 28%, grade F, #1,366 of 1,632 statewide, top 84%, 2,216 students, 60% FRL) — zoned schools at 64% FRL track the district average.
- Market conditions: Rents soft (-2.6%/yr); 475 active listings in the ZIP; 40 comparable units currently listed for rent nearby; rentals at typical pace (median 24d on market — plan ~3-4 weeks tenant-placement turnaround); solid renter incomes; 12,577 units permitted in Dallas County in 2024 (6,829 in 5+ unit buildings).
- This rent runs 34% of the median local income ($83k/yr) — at the standard rent-burdened threshold; future hikes will face affordability resistance.
Forward outlook
- Local home prices are declining (-3.0%/yr); year-one equity from $1k of loan paydown is wiped out by about $6k of value loss. Plan a longer hold.
- Dallas County population projected at +35% by 2050 — long-run rental-demand tailwind backs the buy-and-hold thesis.
Negotiation context
- Only 7 days on market — expect competitive offers; lowballing is unlikely to land.
Risks & watch-outs
- Watch-outs: property tax is 3.2% of price.
- Climate carrying-cost: major wind risk, 27% chance of damaging wind over 30y; extreme-heat days projected 7→25/yr by 2055 (HVAC capex compounding) — expect insurance premiums to compound above CPI over the hold.
Questions for the listing agent
- Property tax is high relative to price — has the assessment been appealed recently, and will the sale trigger a re-assessment?
- Is there a deadline driving the sale (1031 exchange, divorce, estate, relocation)? That informs how much negotiation room exists.
- Schools are D-rated, which usually means shorter tenancies and higher turnover. Who's the typical renter profile here, and what's been the actual vacancy rate?
- The area grade is low — what's the realistic commute time and amenity access for the typical tenant pool here? Any planned neighborhood developments (good or bad) we should know about?
- What's the average days-on-market for RENTAL listings here right now (not sales)? A rising rental-DOM trend means longer vacancies and softer asking-rent achievability than the comps imply.
- What's the recent tenant-quality profile in this submarket — average credit score on applications, eviction rate, late-payment / NSF rate, and stable-employment percentage? A property-management company in the area should have these aggregated.
- How much new for-sale + rental construction is in the pipeline within 1–3 miles? Heavy new supply typically softens prices + rents 12–24 months out; constrained supply supports both.
Investment metrics
- 1% rule
- 1.09% ✓
- Cap rate
- 6.59%
- Cash-on-cash
- 1.07%
- DSCR
- 1.05
- GRM
- 7.7
CMA / ARV
- ARV (on-the-fly)
- $316,128
- Comps found
- 12
Show comp detail 12 sales within ~0.75 mi
| Address | Dist | Beds/Ba | Sqft | Sold | Price | $/sf | Match |
|---|---|---|---|---|---|---|---|
| 629 N Parks Dr | 0.28mi | 3/2.0 (-1) | 2,145 (+0%) | 4mo | $279,999 | $131 | 78 |
| 628 Heather Knoll Dr | 0.33mi | 4/2.5 | 2,286 (+7%) | 8mo | $339,000 | $148 | 65 |
| 604 The Meadows Pkwy | 0.68mi | 3/2.0 (-1) | 2,142 (+0%) | 0mo | $200,000 | $93 | 63 |
| 732 Heather Knoll Dr | 0.47mi | 4/2.5 | 2,222 (+4%) | 9mo | $339,999 | $153 | 62 |
| 709 Arbor Creek Dr | 0.26mi | 3/2.0 (-1) | 1,927 (-10%) | 10mo | $325,000 | $169 | 59 |
| 748 Arbor Creek Dr | 0.32mi | 3/2.5 (-1) | 1,993 (-7%) | 11mo | $289,500 | $145 | 58 |
| 522 E Lanett Dr | 0.15mi | 3/2.0 (-1) | 1,822 (-15%) | 8mo | $265,000 | $145 | 57 |
| 840 Robin Meadow Ct | 0.55mi | 3/2.0 (-1) | 2,225 (+4%) | 12mo | $339,900 | $153 | 52 |
| 326 Lisa Ln | 0.75mi | 4/2.0 | 1,968 (-8%) | 7mo | $265,000 | $135 | 46 |
| 906 Heather Knoll Dr | 0.68mi | 4/2.0 | 2,387 (+12%) | 8mo | $279,000 | $117 | 42 |
| 825 Robin Meadow Dr | 0.63mi | 3/2.0 (-1) | 1,932 (-10%) | 11mo | $293,000 | $152 | 41 |
| 817 Robin Meadow Dr | 0.62mi | 3/2.0 (-1) | 1,838 (-14%) | 13mo | $275,000 | $150 | 32 |
Match score weights: distance 35% · size 25% · config 20% · recency 20%. Top-matched comps best support the ARV.
Projected returns pro-forma
-3.0% appreciation · 0.0% rent growth · sell at horizon
- IRR
- -18.6%
- Equity multiple
- 0.37×
- Total profit
- $-38,035
- Equity at exit
- $32,057
- IRR
- -20.6%
- Equity multiple
- 0.10×
- Total profit
- $-54,257
- Equity at exit
- $18,589
Cash invested: $60,200 (down + closing). Projections, not guarantees.
Landlord ↔ Tenant lean methodology
- Overall (STATE)
- 87 Strongly Landlord-Friendly
- State Texas
- 87 Strongly Landlord-Friendly · R+5
- County
- — inherits STATE
- City
- — inherits STATE
ZIP-level market 75115
- Rents YoY
- -2.6%
- Active inventory
- 475
- Price-to-rent
- 7.7×
Monthly cashflow live
- Estimated rent
- $2,336 high interval (Pro) →
- Mortgage (P&I)
- −$1,127
- Tax from tax record
- −$574 /mo · $6,892/yr
- Insurance
- −$90
- HOA
- −$0
- Vacancy / Maint / Mgmt
- −$490
- Net cashflow
- $54
Break-even live
Sensitivity live
| Price | -10% $175 | -5% $115 | +0% $54 | +5% $-7 | +10% $-68 |
|---|---|---|---|---|---|
| Rent | -10% $-131 | -5% $-38 | +0% $54 | +5% $146 | +10% $238 |
| Rate | -1.0pp $162 | -0.5pp $108 | base $54 | +0.5pp $-2 | +1.0pp $-59 |
UW: 25.0% down · 7.5% · 30yr · 1.5% tax · 5.0% vac · 8.0% maint · 8.0% mgmt
Financing live
Cash to close
- Down payment
- $53,750
- Closing costs
- $6,450
- Reserves months
- —
- Total cash needed
- —
Loan-product check · same deal, 3 products live
Conventional
25% down · 7.5% · 30yr
- Down + closing
- —
- Monthly P&I
- —
- Monthly cashflow
- —
- DSCR
- —
- Eligible?
- —
Personal DTI + credit; lowest rate.
DSCR
20% down · 8.5% · 30yr
- Down + closing
- —
- Monthly P&I
- —
- Monthly cashflow
- —
- DSCR
- —
- Eligible?
- —
No personal income docs; deal must DSCR.
Hard money
10% down · 12.0% · 12mo
- Down + closing
- —
- Monthly P&I
- —
- Monthly cashflow
- —
- DSCR
- —
- Eligible?
- —
Short-term bridge; refi at stabilization.
Rent comps 40 comps
| Address | Beds | Baths | Sqft | Rent | $/sqft | DOM | Units | Dist |
|---|---|---|---|---|---|---|---|---|
| 609 Arbor Creek Dr Unit 1056421P DeSoto, TX | 5.0 | 2.0 | 2271 | $10,815 | $4.76 | 24d | 1 | 0.14mi |
| 524 E Lanett Dr Desoto, TX | 3.0 | 3.5 | 1908 | $2,320 | $1.22 | 45d | 1 | 0.18mi |
| 522 E Lanett Dr Desoto, TX | 3.0 | 2.0 | 1822 | $2,385 | $1.31 | 45d | 1 | 0.18mi |
| 629 N Parks Dr Desoto, TX | 3.0 | 2.0 | 2145 | $2,500 | $1.17 | 45d | 1 | 0.28mi |
| 616 Havencrest Dr Desoto, TX | 3.0 | 2.5 | 1855 | $2,350 | $1.27 | 24d | 1 | 0.36mi |
| 744 Teresa Dr Desoto, TX | 4.0 | 2.5 | 2335 | $2,420 | $1.04 | 45d | 1 | 0.55mi |
| 115 Brook Hollow Dr Desoto, TX | 3.0 | 2.0 | 1520 | $1,931 | $1.27 | 26d | 1 | 0.65mi |
| 115 Brook Hollow Dr Desoto, TX | 3.0 | 2.0 | 1520 | $1,835 | $1.21 | 22d | 1 | 0.65mi |
| 334 Lisa Ln Unit 1019597P DeSoto, TX | 4.0 | 3.0 | 2023 | $16,361 | $8.09 | 24d | 1 | 0.71mi |
| 334 Lisa Ln Desoto, TX | 4.0 | 3.0 | 2034 | $9,750 | $4.79 | 26d | 1 | 0.71mi |
| 829 Hunters Creek Dr Desoto, TX | 3.0 | 2.0 | 2187 | $2,500 | $1.14 | 45d | 1 | 0.74mi |
| 101 Streamside Dr Unit A1 DeSoto, TX | 3.0 | 2.0 | 1450 | $2,070 | $1.43 | 5d | 1 | 0.78mi |
| 912 Oak Trl Desoto, TX | 3.0 | 2.0 | 1722 | $2,000 | $1.16 | 9d | 1 | 0.82mi |
| 827 Ash Grove Ln Unit 829 DeSoto, TX | 3.0 | 2.5 | 1700 | $1,900 | $1.12 | 6d | 1 | 0.84mi |
| 829 Ash Grove Ln DeSoto, TX | 3.0 | 2.5 | 1700 | $1,900 | $1.12 | 9d | 1 | 0.85mi |
| 831 Ash Grove Ln Desoto, TX | 3.0 | 2.0 | 1954 | $1,975 | $1.01 | 9d | 1 | 0.85mi |
| 1204 Laurie Ave Desoto, TX | 4.0 | 2.0 | 2104 | $2,895 | $1.38 | 16d | 1 | 0.90mi |
| 1231 Springbrook Cir Desoto, TX | 5.0 | 2.0 | 1863 | $8,750 | $4.70 | 24d | 1 | 0.91mi |
| 1231 Springbrook Cir Unit 1262017P DeSoto, TX | 5.0 | 2.0 | 1862 | $16,400 | $8.81 | 24d | 1 | 0.91mi |
| 921 Cedar Ridge Dr Unit 919 DeSoto, TX | 3.0 | 2.0 | 1700 | $2,150 | $1.26 | 4d | 1 | 0.91mi |
| 726 Cottonwood Cir Desoto, TX | 3.0 | 2.0 | 1900 | $2,350 | $1.24 | 45d | 1 | 1.01mi |
| 1012 Cloverdale Ln Desoto, TX | 5.0 | 2.5 | 2428 | $9,950 | $4.10 | 24d | 1 | 1.04mi |
| 1012 Cloverdale Ln Unit 1024494P DeSoto, TX | 5.0 | 2.5 | 2421 | $16,997 | $7.02 | 24d | 1 | 1.04mi |
| 1105 Cedar Ridge Dr Desoto, TX | 3.0 | 2.0 | 1848 | $1,905 | $1.03 | 4d | 1 | 1.09mi |
| 160 N Crestwood Blvd Desoto, TX | 3.0 | 2.0 | 1934 | $1,850 | $0.96 | 9d | 1 | 1.09mi |
| 144 N Crestwood Blvd Desoto, TX | 3.0 | 2.0 | 1556 | $1,900 | $1.22 | 45d | 1 | 1.11mi |
| 816 Woodridge Dr Desoto, TX | 4.0 | 2.0 | 1922 | $2,988 | $1.55 | 45d | 1 | 1.13mi |
| 419 Buckingham Pl Desoto, TX | 3.0 | 2.0 | 2245 | $2,026 | $0.90 | 1d | 1 | 1.16mi |
| 1044 Briarwood Ln Desoto, TX | 4.0 | 3.0 | 2078 | $8,750 | $4.21 | 24d | 1 | 1.20mi |
| 1044 Briarwood Ln Unit 1051607P DeSoto, TX | 4.0 | 3.0 | 2077 | $14,645 | $7.05 | 26d | 1 | 1.20mi |
| 708 Azalea Dr Desoto, TX | 5.0 | 2.5 | 2380 | $8,750 | $3.68 | 45d | 1 | 1.20mi |
| 708 Azalea Dr Unit 1310919P DeSoto, TX | 5.0 | 2.5 | 2378 | $17,002 | $7.15 | 26d | 1 | 1.20mi |
| 111 Evelyn St Desoto, TX | 5.0 | 2.5 | 2400 | $2,395 | $1.00 | 26d | 1 | 1.21mi |
| 1325 Forest Crk Desoto, TX | 4.0 | 3.5 | 2950 | $2,683 | $0.91 | 5d | 1 | 1.21mi |
| 426 Newcastle Dr DeSoto, TX | 3.0 | 2.5 | 1834 | $1,600 | $0.87 | 6d | 1 | 1.23mi |
| 705 Timber Trl Desoto, TX | 4.0 | 2.5 | 2048 | $2,370 | $1.16 | 45d | 1 | 1.23mi |
| 428 Newcastle Dr Desoto, TX | 3.0 | 2.5 | 1834 | $1,200 | $0.65 | 0d | 1 | 1.24mi |
| 120 Shadybrook Dr Desoto, TX | 3.0 | 2.0 | 1548 | $1,975 | $1.28 | 26d | 1 | 1.24mi |
| 216 Wesley Dr Desoto, TX | 4.0 | 2.0 | 1769 | $2,299 | $1.30 | 24d | 1 | 1.24mi |
| 737 Eldorado Dr Desoto, TX | 4.0 | 2.5 | 2262 | $2,345 | $1.04 | 1d | 1 | 1.24mi |
Listing history 8 events
-
2026-06-18status $215,000 Pending 7 DOM
-
2026-06-18days on market $215,000 Active 7 DOM
-
2026-06-17days on market $215,000 Active 6 DOM
-
2026-06-16days on market $215,000 Active 5 DOM
-
2026-06-15days on market $215,000 Active 4 DOM
-
2026-06-13days on market $215,000 Active 2 DOM
-
2026-06-13remarks 699-char remark
-
2026-06-13$215,000 Active 1 DOM
ⓘ Source: listings_history table (triggers on properties + properties_extension) + one-shot
backfill from property_details.listing_events for pre-trigger history.
Tax reassessment forecast TX · Resets to sale price
- Current annual tax
- $6,892 · $574/mo
- Projected year-2 tax
- $6,892 · $574/mo
- Expected delta
- $0/yr ($0/mo · -0.0%)
ⓘ Screening estimate from a state-policy table — verify with the county assessor before closing.
Climate risk First Street
- Flood 1/10 Low FEMA zone X (unshaded) · 0% chance over 30 yrs
- Wildfire 1/10 Low
- Heat 7/10 Severe 7 d/yr ≥110°F today · 25 d/yr by 30 yrs out
- Wind 6/10 Major 27% chance of damaging wind over 30 yrs
- Air quality 2/10 Low 2 unhealthy d/yr today · 2 by 30 yrs out
Nearby sold comps map
Loading sold comps map…
Walkable amenities ~0.75 mi
Loading nearby amenities…
Taxation est. · year 1
- Rental income
- $28,028
- − Mortgage interest
- −$12,043
- − Property taxes
- −$6,892
- − Insurance
- −$1,075
- − Repairs & maintenance
- −$2,242
- − Management
- −$2,242
- − Depreciation
- −$6,255
- Taxable loss
- −$2,721
- Est. tax savings @ 24.0%
- +$653
- After-tax cash flow
- $1,299/yr
For passive investors: Depreciation is non-cash, so a rental often shows a tax loss while cash-flowing — sheltering income. Rental losses are passive: they offset passive income freely, and up to $25,000/yr can offset ordinary (W-2) income if you actively participate and your MAGI is under $100k (phasing out to $0 by $150k); unused losses carry forward. On sale, claimed depreciation is recaptured at up to 25%, and gains may owe capital-gains tax (a 1031 exchange can defer both). Figures are a year-1 estimate at your 24.0% rate — not tax advice; consult a CPA.
Schools (NCES district)
- District
- Desoto ISD
- NCES district ID
- 4816860
- Math proficiency
- 14% ▼ -19.00%
- Reading proficiency
- 26% ▼ -8.00%
- Median HH income
- $61,556
- Composite
- 18.98/100
- National rank
- #8851
- State rank
- #754 of 826 in TX
Livability — DeSoto
- Score
- 66/100
- State rank
- #589
- US rank
- #11236
Category grades
Schools grade is shown separately in the Schools card above.
Census & demographics
- Census place
- DeSoto, TX
- County
- Dallas County · 2,612,404 people
- City population
- 56,211
- Metro
- Dallas-Fort Worth-Arlington, TX
- Population (ZIP)
- 56,211
- Household income
- $82,782
- Rent vs Own
- Severe rent burden
- 1867.0
Population outlook (Dallas County) Hauer SSP2
- Today (2025)
- 2,979,839 people
- By 2030
- 3,191,823 · +7.1%
- By 2040
- 3,619,611 · +21.5%
- By 2050
- 4,026,915 · +35.1%
- By 2075
- 4,957,073 · +66.4%
- By 2100
- 5,508,725 · +84.9%
Race, ethnicity, and origin ACS 2023
- Neighborhood character
- Predominantly Black (68%)
- Race & ethnicity
- Black 68% Hispanic / Latino 19% Two or more races 11% White 8%
- Hispanic origin (detail)
- Mexican 17%
- Common ancestry
- Swedish 1%
- Foreign-born
- 9% · Canada, Dominican Republic
- Languages at home
- 83% English-only · Spanish 15% French/Haitian/Cajun 1%
Political lean MEDSL · Dallas
- 2024 margin
- Strong D (+22.2) · D 60.2% · R 38.0% · Other 1.8%
- 2008→2024 swing
- +6.9pp toward D · 2008: 15.3pp · 2024: 22.2pp
- All cycles
- 2024: D+22.2 2020: D+31.6 2016: D+26.2 2012: D+15.4 2008: D+15.3
Not yet ingested
- Civics
- —
Market trends
- HPI YoY
- ▼ -170.49%
- Current HPI
- 272.1565
- Rent YoY
- ▼ -2.60%
- Metro
- Dallas-Fort Worth-Arlington, TX
- State GDP YoY
- ▲ 3.95%
- F500 in state
- 110
Industry mix (Fortune 500 HQ in TX)
| Industry | F500 HQs | Revenue |
|---|---|---|
| Energy | 16 | $1,198B |
|
||
| Technology | 5 | $198B |
|
||
| Engineering / Construction | 4 | $72B |
|
||
| Energy Services | 3 | $60B |
|
||
| Utilities | 3 | $41B |
|
||
| Healthcare | 2 | $330B |
|
||
Price history
2 events — show timeline
- 2026-06-11 Listed $215,000 NTREIS
- 2006-10-03 Sold (Public Records) — Public Records
Property tax history
+3.1%/yrLatest (2025): $6,892 · +7.1% YoY. Source: county tax records.
Cash-flow waterfall
monthlySold comps — $/sqft
last 12 mo · ≤1 miLoading sold comps…