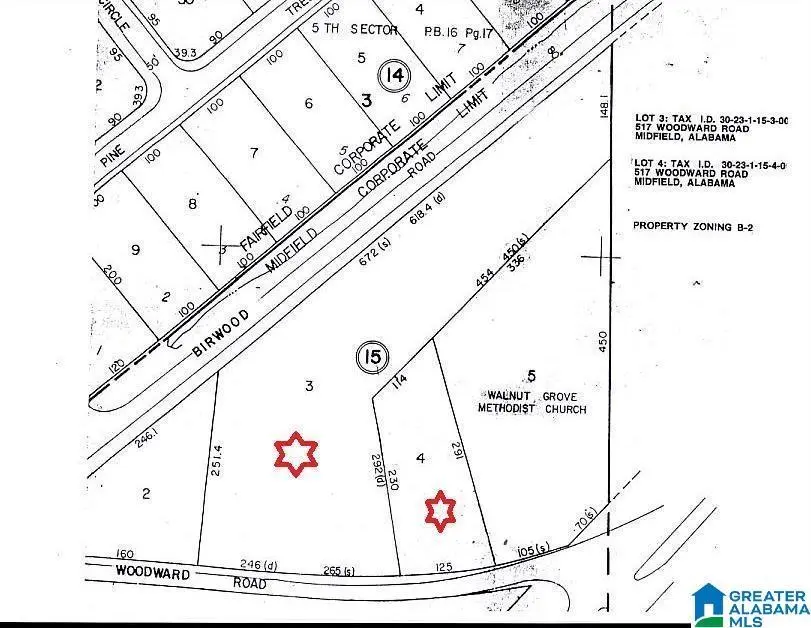
517 Woodward Rd · Midfield, AL
Flood risk 1/10 · Minimal
- FEMA flood zone
- X (unshaded)
- Chance of flooding over 30 yrs
- 0.0%
- Est. flood insurance / yr
- $507 – $1,088
Fire risk 1/10 · Minimal
- Est. fire insurance / yr
- $916 – $1,700
Heat risk 7/10 · Major
- Hot days now (above 108°F)
- 7 days/yr
- Hot days in 30 yrs
- 19 days/yr
Wind risk 6/10 · Moderate
- Chance of severe wind over 30 yrs
- 27.0%
Air-quality risk 4/10 · Minor
- Unhealthy air days now
- 5 days/yr
- Unhealthy air days in 30 yrs
- 5 days/yr
Risk factors via First Street. Map © Google.
Why this score? — see what drove the B- grade
The composite is a weighted blend of 9 inputs, each scored 0–100. Each bar is that input's sub-score; the figure is the points it added to the 100-point composite (weight × sub-score).
- Cash flow +30.0/30.0
- 1% rule +10.0/10.0
- DSCR +10.0/10.0
- ARV discount +7.5/15.0
- Livability +3.2/5.0
- Appreciation +2.6/10.0
- Condition / age +2.5/5.0
- Rent growth +2.1/5.0
- Schools +0.7/10.0
$65,000
🖨 Deal sheet 📄 Offer letter ✓ Due diligence
Listing remarks
PRIME 3.72 ACRE +/- B-2 zoned parcel in Midfield is an IDEAL OPPORTUNITY and offers EXCEPTIONAL REDEVELOPMENT POTENTIAL * Multiple existing structures on site including two residences and a storage building * FLEXIBLE ZONING permits a variety of uses including single-family and manufactured housing * Land value drives the opportunity * Sold "as-is" * No owner financing *
Key facts
- Flexible zoning
- 3.72 acre parcel
- Storage building
Tags
Property features AI
Exterior
- Parking: Parking at main level
- Utilities: Public water; Septic system; Internet service availability unknown
- Home design: Existing construction; 3-sided brick exterior
- Construction: Basement foundation
- Exterior features: Fenced yard; Storage building; Acreage with heavy tree cover
Interior
- Kitchen: Kitchen on main level
- Bedrooms: Multiple bedrooms on main and upper levels (bedrooms on main level and 2+ level)
- Flooring: Hardwood floors
- Bathrooms: One full bath; One half bath; Tub/shower combo
- Heating & cooling: No heat; No air conditioning
- Interior features: Handyman special; Attic (other); Partial, unfinished concrete block basement; Has laundry
- Laundry & utility: Washer hookup; Electric dryer hookup; Laundry located on main level
Neighborhood map
What this means for you Summary
Snapshot
- This is a 5-bed/1.0-bath single-family listed at $65k.
Deal economics
- At list price, monthly cash flow is $652 ($8k/yr) — positive.
- The deal already cash-flows at list — no discount required.
- Meets the 1% rule at list price ($1k rent vs $65k).
- Recommended offer: $63k (3.0% below list) — sets the bar for market timing.
- Cap rate 18.3% vs local median 10.0% in Midfield — top-decile yield for the area; either an underpriced asset or a hidden risk that comps aren't pricing in. Stress-test before assuming the spread holds.
Location & tenants
- Location reads 64/100 on livability (#164 in AL) — a middle-class / working-renter tenant base. Strengths: commute A+, cost of living A+, housing A+; Watch: amenities F, employment F, health & safety F.
- Midfield City (suburban): math 2% / reading 14% proficiency, ranked #126 of 129 in AL (top 98%) — low school quality limits family demand, transient renter base, plan for 1-2y turnover; 83% free/reduced lunch — lower-income household profile, screen leases tightly.
- Zoned schools: Midfield Elementary School (math 2% / reading 17%, grade F, #568 of 627 statewide, top 94%, 390 students, 84% FRL); Midfield High School (math 2% / reading 2%, grade F, #291 of 305 statewide, top 100%, 340 students, 87% FRL) — zoned schools at 86% FRL track the district average.
- Market conditions: Rents soft (-1.5%/yr); 87 active listings in the ZIP; 11 comparable units currently listed for rent nearby; rentals lingering (median 44d on market — plan ~5-8 weeks vacancy on turnover, expect pricing pressure); 64% of comp listings sitting > 30 days — soft ceiling on asking rent; 2,114 units permitted in Jefferson County in 2024 (556 in 5+ unit buildings).
- This rent runs 33% of the median local income ($51k/yr) — at the standard rent-burdened threshold; future hikes will face affordability resistance.
Forward outlook
- Local home prices are declining (-3.0%/yr); year-one equity from $449 of loan paydown is wiped out by about $2k of value loss. Plan a longer hold.
- Jefferson County population projected to shrink 4% by 2050 — rents likely to lag national; underwrite the cash flow, not the appreciation.
- At projected returns (-3.0% appreciation + 0.0% rent growth), your $18k cash investment doubles in ~3 years — after that, you're playing with house money.
Negotiation context
- It's been on market 46 days — a 3% lower offer ($63k) is reasonable based on typical stale-listing flexibility.
Risks & watch-outs
- Watch-outs: built in 1947 — expect roof / HVAC / electrical / plumbing capex.
- Climate carrying-cost: major wind risk, 27% chance of damaging wind over 30y; extreme-heat days projected 7→19/yr by 2055 (HVAC capex compounding) — expect insurance premiums to compound above CPI over the hold.
Questions for the listing agent
- It's been on market 46 days. Have you received any prior offers? Is the seller open to a 3% concession, seller financing, or rate buy-down credit?
- Built in 1947 — when were the roof, HVAC, electrical panel, plumbing, and water heater last replaced?
- Is there a deadline driving the sale (1031 exchange, divorce, estate, relocation)? That informs how much negotiation room exists.
- Schools are F-rated, which usually means shorter tenancies and higher turnover. Who's the typical renter profile here, and what's been the actual vacancy rate?
- What's the average days-on-market for RENTAL listings here right now (not sales)? A rising rental-DOM trend means longer vacancies and softer asking-rent achievability than the comps imply.
- What's the recent tenant-quality profile in this submarket — average credit score on applications, eviction rate, late-payment / NSF rate, and stable-employment percentage? A property-management company in the area should have these aggregated.
- How much new for-sale + rental construction is in the pipeline within 1–3 miles? Heavy new supply typically softens prices + rents 12–24 months out; constrained supply supports both.
Investment metrics
- 1% rule
- 2.18% ✓
- Cap rate
- 18.32%
- Cash-on-cash
- 42.96%
- DSCR
- 2.91
- GRM
- 3.8
CMA / ARV
- ARV (median comp)
- $157,729
- List price
- $65,000
- Delta
- -58.79%
- Verdict
- UNDERPRICED
- Comps
- 18 within 1.0 mi
Projected returns pro-forma
-3.0% appreciation · 0.0% rent growth · sell at horizon
- IRR
- 36.3%
- Equity multiple
- 2.47×
- Total profit
- $26,845
- Equity at exit
- $9,692
- IRR
- 41.4%
- Equity multiple
- 4.35×
- Total profit
- $60,889
- Equity at exit
- $5,620
Cash invested: $18,200 (down + closing). Projections, not guarantees.
Landlord ↔ Tenant lean methodology
- Overall (STATE)
- 90 Strongly Landlord-Friendly
- State Alabama
- 90 Strongly Landlord-Friendly · R+15
- County
- — inherits STATE
- City
- — inherits STATE
ZIP-level market 35228
- Home prices YoY
- -3.5%
- Rents YoY
- -1.5%
- Active inventory
- 87
- Price-to-rent
- 3.8×
Monthly cashflow live
- Estimated rent
- $1,418 high interval (Pro) →
- Mortgage (P&I)
- −$341
- Tax from tax record
- −$101 /mo · $1,209/yr
- Insurance
- −$27
- HOA
- −$0
- Vacancy / Maint / Mgmt
- −$298
- Net cashflow
- $652
Break-even live
UW: 25.0% down · 7.5% · 30yr · 1.5% tax · 5.0% vac · 8.0% maint · 8.0% mgmt
Financing live
Cash to close
- Down payment
- $16,250
- Closing costs
- $1,950
- Reserves months
- —
- Total cash needed
- —
Loan-product check · same deal, 3 products live
Conventional
25% down · 7.5% · 30yr
- Down + closing
- —
- Monthly P&I
- —
- Monthly cashflow
- —
- DSCR
- —
- Eligible?
- —
Personal DTI + credit; lowest rate.
DSCR
20% down · 8.5% · 30yr
- Down + closing
- —
- Monthly P&I
- —
- Monthly cashflow
- —
- DSCR
- —
- Eligible?
- —
No personal income docs; deal must DSCR.
Hard money
10% down · 12.0% · 12mo
- Down + closing
- —
- Monthly P&I
- —
- Monthly cashflow
- —
- DSCR
- —
- Eligible?
- —
Short-term bridge; refi at stabilization.
Rent comps 11 comps
| Address | Beds | Baths | Sqft | Rent | $/sqft | DOM | Units | Dist |
|---|---|---|---|---|---|---|---|---|
| 226 3rd Ave Birmingham, AL | 4.0 | 2.0 | 1248 | $1,300 | $1.04 | 43d | 1 | 0.61mi |
| 800 Fairfax Dr Fairfield, AL | 4.0 | 2.0 | 1200 | $1,650 | $1.38 | 1d | 1 | 0.72mi |
| 5624 Cairo Ave Birmingham, AL | 4.0 | 2.0 | 1386 | $1,200 | $0.87 | 43d | 1 | 0.76mi |
| 6629 Grasselli Rd Fairfield, AL | 4.0 | 1.0 | 1114 | $1,295 | $1.16 | 43d | 1 | 0.96mi |
| 373 Belcher Dr Birmingham, AL | 4.0 | 1.0 | 1255 | $1,100 | $0.88 | 43d | 1 | 1.01mi |
| 63 Wilkes Cir Birmingham, AL | 4.0 | 1.0 | 1164 | $1,200 | $1.03 | 43d | 1 | 1.11mi |
| 63 Wilkes Cir Unit 1 Birmingham, AL | 4.0 | 1.0 | 1164 | $1,250 | $1.07 | 43d | 1 | 1.11mi |
| 80 Wilkes Cir Birmingham, AL | 4.0 | 2.0 | 1078 | $1,200 | $1.11 | 14d | 1 | 1.15mi |
| 617 8th Ave Birmingham, AL | 4.0 | 2.0 | 1436 | $1,350 | $0.94 | 1d | 1 | 1.34mi |
| 913 Daniel Cir Birmingham, AL | 4.0 | 2.0 | 1317 | $1,300 | $0.99 | 43d | 1 | 1.36mi |
| 109 59th St Fairfield, AL | 4.0 | 1.0 | 1344 | $1,200 | $0.89 | 11d | 1 | 1.47mi |
Listing history 18 events
-
2026-06-18days on market $65,000 Active 46 DOM
-
2026-06-17days on market $65,000 Active 45 DOM
-
2026-06-16days on market $65,000 Active 44 DOM
-
2026-06-15days on market $65,000 Active 43 DOM
-
2026-06-13days on market $65,000 Active 41 DOM
-
2026-06-13days on market $65,000 Active 40 DOM
-
2026-06-10days on market $65,000 Active 38 DOM
-
2026-06-09days on market $65,000 Active 37 DOM
-
2026-06-08days on market $65,000 Active 36 DOM
-
2026-06-07days on market $65,000 Active 35 DOM
-
2026-06-05days on market $65,000 Active 32 DOM
-
2026-06-03days on market $65,000 Active 31 DOM
-
2026-06-02days on market $65,000 Active 30 DOM
-
2026-06-01days on market $65,000 Active 29 DOM
-
2026-05-31days on market $65,000 Active 28 DOM
-
2026-05-02$65,000 Active 394-char remark
-
2026-04-23price $65,000
-
2025-06-09price $75,000
ⓘ Source: listings_history table (triggers on properties + properties_extension) + one-shot
backfill from property_details.listing_events for pre-trigger history.
Tax reassessment forecast AL · Resets to sale price
- Current annual tax
- $1,209 · $101/mo
- Projected year-2 tax
- $1,209 · $101/mo
- Expected delta
- $0/yr ($0/mo · 0.0%)
ⓘ Screening estimate from a state-policy table — verify with the county assessor before closing.
Climate risk First Street
- Flood 1/10 Low FEMA zone X (unshaded) · 0% chance over 30 yrs
- Wildfire 1/10 Low
- Heat 7/10 Severe 7 d/yr ≥108°F today · 19 d/yr by 30 yrs out
- Wind 6/10 Major 27% chance of damaging wind over 30 yrs
- Air quality 4/10 Moderate 5 unhealthy d/yr today · 5 by 30 yrs out
Nearby sold comps map
Loading sold comps map…
Walkable amenities ~0.75 mi
Loading nearby amenities…
Taxation est. · year 1
- Rental income
- $17,018
- − Mortgage interest
- −$3,641
- − Property taxes
- −$1,209
- − Insurance
- −$325
- − Repairs & maintenance
- −$1,361
- − Management
- −$1,361
- − Depreciation
- −$1,891
- Taxable income
- $7,228
- Est. tax owed @ 24.0%
- −$1,735
- After-tax cash flow
- $6,084/yr
For passive investors: Depreciation is non-cash, so a rental often shows a tax loss while cash-flowing — sheltering income. Rental losses are passive: they offset passive income freely, and up to $25,000/yr can offset ordinary (W-2) income if you actively participate and your MAGI is under $100k (phasing out to $0 by $150k); unused losses carry forward. On sale, claimed depreciation is recaptured at up to 25%, and gains may owe capital-gains tax (a 1031 exchange can defer both). Figures are a year-1 estimate at your 24.0% rate — not tax advice; consult a CPA.
Schools (NCES district)
- District
- Midfield City
- NCES district ID
- 0102350
- Math proficiency
- 2% ▼ -18.00%
- Reading proficiency
- 14% ▼ -5.00%
- Median HH income
- $39,267
- Composite
- 6.89/100
- National rank
- #9978
- State rank
- #126 of 129 in AL
Livability — Midfield
- Score
- 64/100
- State rank
- #164
- US rank
- #14536
Category grades
Schools grade is shown separately in the Schools card above.
Census & demographics
- Census place
- Midfield, AL
- County
- Jefferson County · 527,445 people
- City population
- 10,216
- Metro
- Birmingham-Hoover, AL
- Population (ZIP)
- 10,216
- Household income
- $50,815
- Rent vs Own
- Severe rent burden
- 456.0
Population outlook (Jefferson County) Hauer SSP2
- Today (2025)
- 669,185 people
- By 2030
- 669,694 · +0.1%
- By 2040
- 661,388 · -1.2%
- By 2050
- 643,086 · -3.9%
- By 2075
- 577,267 · -13.7%
- By 2100
- 474,758 · -29.1%
Race, ethnicity, and origin ACS 2023
- Neighborhood character
- Predominantly Black (89%)
- Race & ethnicity
- Black 89% Hispanic / Latino 5% Two or more races 5% White 5%
- Foreign-born
- 2% · Canada
- Languages at home
- 95% English-only · Spanish 5%
Political lean MEDSL · Jefferson
- 2024 margin
- D (+10.4) · D 54.6% · R 44.2% · Other 1.2%
- 2008→2024 swing
- +5.4pp toward D · 2008: 5.1pp · 2024: 10.4pp
- All cycles
- 2024: D+10.4 2020: D+13.2 2016: D+7.2 2012: D+6.0 2008: D+5.1
Not yet ingested
- Civics
- —
Market trends
- HPI YoY
- ▼ -4.84%
- Current HPI
- 134.8633
- Rent YoY
- ▼ -1.47%
- Metro
- Birmingham-Hoover, AL
- State GDP YoY
- ▲ 2.94%
- F500 in state
- 4
Industry mix (Fortune 500 HQ in AL)
| Industry | F500 HQs | Revenue |
|---|---|---|
| Financial Services | 1 | $8B |
|
||
| Healthcare | 1 | $5B |
|
||
Price history
-13.3% since first listed3 events — show timeline
- 2026-05-02 Listed $65,000 Greater Alabama MLS
- 2026-04-23 Price Changed $65,000 Greater Alabama MLS
- 2025-06-09 Price Changed $75,000 Greater Alabama MLS
Property tax history
-3.7%/yrLatest (2025): $1,209 · +0.0% YoY. Source: county tax records.
Cash-flow waterfall
monthlySold comps — $/sqft
last 12 mo · ≤1 miLoading sold comps…