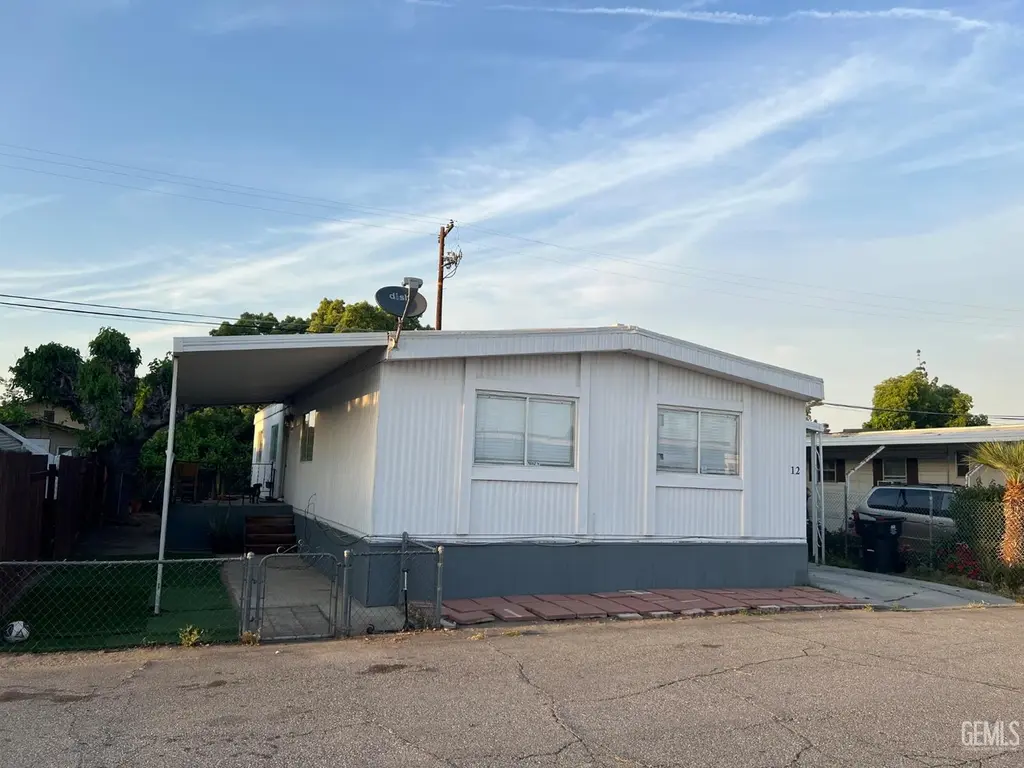
6201 Wible Rd #12 · Bakersfield, CA
Flood risk 1/10 · Minimal
- FEMA flood zone
- X (unshaded)
- Chance of flooding over 30 yrs
- 0.0%
- Est. flood insurance / yr
- $507 – $1,088
Fire risk 2/10 · Minimal
- Est. fire insurance / yr
- $659 – $1,223
Heat risk 8/10 · Major
- Hot days now (above 105°F)
- 7 days/yr
- Hot days in 30 yrs
- 17 days/yr
Wind risk 1/10 · Minimal
- Chance of severe wind over 30 yrs
- —
Air-quality risk 10/10 · Severe
- Unhealthy air days now
- 33 days/yr
- Unhealthy air days in 30 yrs
- 37 days/yr
Risk factors via First Street. Map © Google.
Why this score? — see what drove the C grade
The composite is a weighted blend of 9 inputs, each scored 0–100. Each bar is that input's sub-score; the figure is the points it added to the 100-point composite (weight × sub-score).
- Cash flow +16.5/30.0
- ARV discount +15.0/15.0
- 1% rule +10.0/10.0
- DSCR +5.1/10.0
- Schools +4.2/10.0
- Rent growth +3.0/5.0
- Livability +2.9/5.0
- Condition / age +2.5/5.0
- Appreciation +0.0/10.0
$119,990
🖨 Deal sheet 📄 Offer letter ✓ Due diligence
Listing remarks MLS
Recently Remodeled 3 Bed 2 Bath split wing manufactured home with newer A/C and newer water heater unit inside the desirable south west De Rancho Mobile Villa mobile home park, conveniently located near shopping center, Costco, pharmacy, the mall and easy freeway access, park fees include water trash, amenities like pool access and community room, good size yard with parking for 2 possible 3 cars, also a storage shed is included in the sale, seller may finance available
Key facts
- Pool
- Built 1978
- Listed 72 days
Neighborhood map
What this means for you Summary
Snapshot
- This is a 3-bed/2.0-bath manufactured listed at $120k.
Deal economics
- At list price, monthly cash flow is $70 ($837/yr) — positive.
- The deal already cash-flows at list — no discount required.
- Meets the 1% rule at list price ($2k rent vs $120k).
- Recommended offer: $113k (6.0% below list) — sets the bar for market timing.
- Cap rate 7.0% vs local median 3.6% in Bakersfield — top-decile yield for the area; either an underpriced asset or a hidden risk that comps aren't pricing in. Stress-test before assuming the spread holds.
Location & tenants
- Location reads 58/100 on livability (#716 in CA) — a working-class tenant base; expect higher turnover. Strengths: housing A+; Watch: health & safety D, schools D-, crime F.
- Panama-Buena Vista Union (urban): math 37% / reading 52% proficiency, ranked #542 of 1,400 in CA (top 39%) — families likely to look elsewhere, expect single-tenant / working-renter base with shorter leases.
- Market conditions: Rents rising (+2.1%/yr); 271 active listings in the ZIP; 28 comparable units currently listed for rent nearby; rentals at typical pace (median 15d on market — plan ~3-4 weeks tenant-placement turnaround); solid renter incomes; 3,244 units permitted in Kern County in 2024 (73 in 5+ unit buildings).
Forward outlook
- Local home prices are declining (-3.0%/yr); year-one equity from $830 of loan paydown is wiped out by about $4k of value loss. Plan a longer hold.
- Kern County population projected at +17% by 2050 — long-run rental-demand tailwind backs the buy-and-hold thesis.
Negotiation context
- It's been on market 72 days — a 6% lower offer ($113k) is reasonable based on typical stale-listing flexibility.
- 4 sale attempts since 4y ago with the ask held roughly flat each time — persistent listings suggest the price (not the market) is what's stuck; bring a comps-based counter.
Risks & watch-outs
- Watch-outs: HOA is 39% of rent.
- Climate carrying-cost: extreme-heat days projected 7→17/yr by 2055 (HVAC capex compounding) — expect insurance premiums to compound above CPI over the hold.
Questions for the listing agent
- It's been on market 72 days. Have you received any prior offers? Is the seller open to a 6% concession, seller financing, or rate buy-down credit?
- Built in 1978 — when were the roof, HVAC, electrical panel, plumbing, and water heater last replaced?
- What does the HOA fee cover, when was the last increase, and are there any pending special assessments or reserve-fund shortfalls?
- Why hasn't it sold? Are there any deal-killer items the seller is aware of (foundation, flood, title, zoning, code violations)?
- Is there a deadline driving the sale (1031 exchange, divorce, estate, relocation)? That informs how much negotiation room exists.
- Schools are D-rated, which usually means shorter tenancies and higher turnover. Who's the typical renter profile here, and what's been the actual vacancy rate?
- Crime grade is F in this area — have there been break-ins, vandalism, or insurance claims at this property in the last 3 years? What carrier currently insures it and at what premium?
- What's the average days-on-market for RENTAL listings here right now (not sales)? A rising rental-DOM trend means longer vacancies and softer asking-rent achievability than the comps imply.
- What's the recent tenant-quality profile in this submarket — average credit score on applications, eviction rate, late-payment / NSF rate, and stable-employment percentage? A property-management company in the area should have these aggregated.
- How much new for-sale + rental construction is in the pipeline within 1–3 miles? Heavy new supply typically softens prices + rents 12–24 months out; constrained supply supports both.
Investment metrics
- 1% rule
- 1.78% ✓
- Cap rate
- 6.99%
- Cash-on-cash
- 2.49%
- DSCR
- 1.11
- GRM
- 4.7
CMA / ARV
- ARV (median comp)
- $160,000
- List price
- $119,990
- Delta
- -25.01%
- Verdict
- UNDERPRICED
- Comps
- 9 within 1.0 mi
Show comp detail 12 sales within ~0.75 mi
| Address | Dist | Beds/Ba | Sqft | Sold | Price | $/sf | Match |
|---|---|---|---|---|---|---|---|
| 6309 Dennen St | 0.43mi | 3/2.0 | 1,521 (+13%) | 1mo | $280,000 | $184 | 57 |
| 6351 Akers Rd #87 | 0.57mi | 3/2.0 | 1,440 (+7%) | 8mo | $105,000 | $73 | 55 |
| 6351 Akers Rd #95 | 0.57mi | 3/2.0 | 1,456 (+8%) | 11mo | $130,000 | $89 | 50 |
| 2505 Carlita Ct | 0.65mi | 2/2.0 (-1) | 1,272 (-5%) | 8mo | $250,000 | $197 | 49 |
| 6216 Dennen St | 0.47mi | 3/2.0 | 1,440 (+7%) | 21mo | $150,000 | $104 | 49 |
| 6351 Akers Rd #101 | 0.57mi | 3/2.0 | 1,456 (+8%) | 13mo | $137,000 | $94 | 48 |
| 6351 Akers Rd #17 | 0.57mi | 4/2.0 (+1) | 1,456 (+8%) | 11mo | $150,000 | $103 | 45 |
| 2812 Wheatland Ave | 0.36mi | 3/2.0 | 1,536 (+14%) | 21mo | $255,000 | $166 | 42 |
| 6351 Akers Rd #13 | 0.57mi | 2/2.0 (-1) | 1,173 (-13%) | 10mo | $145,000 | $124 | 38 |
| 2604 Clara Ct | 0.68mi | 3/2.0 | 1,152 (-14%) | 11mo | $250,000 | $217 | 36 |
| 6301 Dennen St | 0.44mi | 2/2.0 (-1) | 1,152 (-14%) | 20mo | $230,000 | $200 | 34 |
| 6351 Akers Rd #32 | 0.57mi | 2/2.0 (-1) | 1,152 (-14%) | 17mo | $128,000 | $111 | 30 |
Match score weights: distance 35% · size 25% · config 20% · recency 20%. Top-matched comps best support the ARV.
Projected returns pro-forma
-3.0% appreciation · 2.12% rent growth · sell at horizon
- IRR
- -13.7%
- Equity multiple
- 0.51×
- Total profit
- $-16,361
- Equity at exit
- $17,891
- IRR
- -6.9%
- Equity multiple
- 0.58×
- Total profit
- $-13,994
- Equity at exit
- $10,375
Cash invested: $33,597 (down + closing). Projections, not guarantees.
Landlord ↔ Tenant lean methodology
- Overall (STATE)
- 18 Strongly Tenant-Friendly
- State California
- 18 Strongly Tenant-Friendly · D+13
- County
- — inherits STATE
- City
- — inherits STATE
ZIP-level market 93313
- Home prices YoY
- -20.4%
- Rents YoY
- 2.1%
- Active inventory
- 271
- Price-to-rent
- 4.7×
Monthly cashflow live
- Estimated rent
- $2,141 high interval (Pro) →
- Mortgage (P&I)
- −$629
- Tax from tax record
- −$118 /mo · $1,411/yr
- Insurance
- −$50
- HOA
- −$825
- Vacancy / Maint / Mgmt
- −$450
- Net cashflow
- $70
Break-even live
UW: 25.0% down · 7.5% · 30yr · 1.5% tax · 5.0% vac · 8.0% maint · 8.0% mgmt
Financing live
Cash to close
- Down payment
- $29,998
- Closing costs
- $3,600
- Reserves months
- —
- Total cash needed
- —
Loan-product check · same deal, 3 products live
Conventional
25% down · 7.5% · 30yr
- Down + closing
- —
- Monthly P&I
- —
- Monthly cashflow
- —
- DSCR
- —
- Eligible?
- —
Personal DTI + credit; lowest rate.
DSCR
20% down · 8.5% · 30yr
- Down + closing
- —
- Monthly P&I
- —
- Monthly cashflow
- —
- DSCR
- —
- Eligible?
- —
No personal income docs; deal must DSCR.
Hard money
10% down · 12.0% · 12mo
- Down + closing
- —
- Monthly P&I
- —
- Monthly cashflow
- —
- DSCR
- —
- Eligible?
- —
Short-term bridge; refi at stabilization.
Rent comps 28 comps
| Address | Beds | Baths | Sqft | Rent | $/sqft | DOM | Units | Dist |
|---|---|---|---|---|---|---|---|---|
| 3316 Fiesta Ave Bakersfield, CA | 3.0 | 3.0 | 1700 | $2,300 | $1.35 | 43d | 1 | 0.08mi |
| 6304 Castleford St Unit 4 Bakersfield, CA | 3.0 | 2.0 | 1144 | $1,500 | $1.31 | 43d | 1 | 0.13mi |
| 6302 Castleford St Unit 4 Bakersfield, CA | 3.0 | 2.0 | 1144 | $1,500 | $1.31 | 2d | 1 | 0.14mi |
| 6401 Castleford St Unit C Bakersfield, CA | 3.0 | 2.0 | 1125 | $1,500 | $1.33 | 19d | 1 | 0.18mi |
| 3921 White Sands Dr Bakersfield, CA | 4.0 | 2.0 | 1798 | $2,550 | $1.42 | 2d | 1 | 0.62mi |
| 4212 Cyclone Dr Bakersfield, CA | 4.0 | 2.0 | 1471 | $2,275 | $1.55 | 2d | 1 | 0.65mi |
| 2625 Miria Dr Bakersfield, CA | 3.0 | 1.0 | 1308 | $1,850 | $1.41 | 23d | 1 | 0.69mi |
| 4508 Blossom Valley Ln Bakersfield, CA | 3.0 | 2.0 | 1107 | $1,850 | $1.67 | 21d | 1 | 0.73mi |
| 4012 Island Mist Ct Bakersfield, CA | 3.0 | 2.0 | 1436 | $2,300 | $1.60 | 2d | 1 | 0.76mi |
| 6208 Stine Rd Apt B Bakersfield, CA | 2.0 | 1.0 | 904 | $1,495 | $1.65 | 10d | 1 | 0.92mi |
| 6513 Pine View Dr Bakersfield, CA | 3.0 | 2.5 | 1600 | $1,950 | $1.22 | 2d | 1 | 1.04mi |
| 5012 Greenville Ct Bakersfield, CA | 3.0 | 2.0 | 1500 | $2,200 | $1.47 | 43d | 1 | 1.04mi |
| 2308 Kelso Peak Ave Bakersfield, CA | 3.0 | 2.5 | 1752 | $3,900 | $2.23 | 3d | 1 | 1.07mi |
| 4309 Rosewall St Bakersfield, CA | 3.0 | 2.0 | 1356 | $2,200 | $1.62 | 2d | 1 | 1.18mi |
| 5201 Gasol Ct Unit V102 Bakersfield, CA | 3.0 | 2.0 | 1429 | $2,050 | $1.43 | 21d | 1 | 1.19mi |
| 5201 Gasol Ct Unit N107 Bakersfield, CA | 2.0 | 2.0 | 1166 | $1,995 | $1.71 | 2d | 1 | 1.19mi |
| 5201 Gasol Ct Unit F204 Bakersfield, CA | 2.0 | 2.0 | 1166 | $1,995 | $1.71 | 23d | 1 | 1.19mi |
| 5201 Gasol Ct Apt C103 Bakersfield, CA | 2.0 | 2.0 | 1166 | $1,995 | $1.71 | 43d | 1 | 1.19mi |
| 6600 Jerno Dr Bakersfield, CA | 2.0–3.0 | 2.0 | 1104 | $2,225 | $2.02 | 2d | 1 | 1.24mi |
| 3605 Biltmore Ln Bakersfield, CA | 2.0 | 2.0 | 1450 | $1,650 | $1.14 | 2d | 1 | 1.25mi |
| 4605 Mount Everest Way Bakersfield, CA | 3.0 | 2.0 | 1465 | $2,250 | $1.54 | 2d | 1 | 1.27mi |
| 8203 Libby Ct Bakersfield, CA | 4.0 | 2.0 | 1715 | $2,400 | $1.40 | 21d | 1 | 1.28mi |
| 4413 White Ln Bakersfield, CA | 3.0 | 2.0 | 1249 | $2,250 | $1.80 | 21d | 1 | 1.43mi |
| 5516 Dustin St Bakersfield, CA | 4.0 | 2.0 | 1507 | $2,450 | $1.63 | 43d | 1 | 1.43mi |
| 6104 Summer Springs Dr Bakersfield, CA | 3.0 | 2.0 | 1396 | $2,200 | $1.58 | 43d | 1 | 1.43mi |
| 4208 White Ln Unit A Bakersfield, CA | 3.0 | 2.5 | 1200 | $1,575 | $1.31 | 2d | 1 | 1.44mi |
| 4208 White Ln Apt B Bakersfield, CA | 3.0 | 2.5 | 1200 | $1,575 | $1.31 | 10d | 1 | 1.44mi |
| 8501 Tamworth St Bakersfield, CA | 3.0 | 2.0 | 1796 | $2,795 | $1.56 | 14d | 1 | 1.49mi |
HOA detail
- Monthly dues
- $825 · $9,900/yr
- Likely covers
- watertrashpool
Listing history 27 events
-
2026-06-18days on market $119,990 Active 72 DOM
-
2026-06-17days on market $119,990 Active 71 DOM
-
2026-06-16days on market $119,990 Active 70 DOM
-
2026-06-15days on market $119,990 Active 69 DOM
-
2026-06-14days on market $119,990 Active 67 DOM
-
2026-06-13pricedays on market $119,990 Active 66 DOM
-
2026-06-10days on market $124,990 Active 64 DOM
-
2026-06-09days on market $124,990 Active 63 DOM
-
2026-06-08days on market $124,990 Active 62 DOM
-
2026-06-07days on market $124,990 Active 61 DOM
-
2026-06-05days on market $124,990 Active 58 DOM
-
2026-06-03days on market $124,990 Active 57 DOM
-
2026-06-03days on market $124,990 Active 56 DOM
-
2026-06-01days on market $124,990 Active 55 DOM
-
2026-05-31days on market $124,990 Active 54 DOM
-
2026-04-08$124,990 Active 474-char remark
Show marketing remark (474 chars)
Recently Remodeled 3 Bed 2 Bath split wing manufactured home with newer A/C and newer water heater unit inside the desirable south west De Rancho Mobile Villa mobile home park, conveniently located near shopping center, Costco, pharmacy, the mall and easy freeway access, park fees include water trash, amenities like pool access and community room, good size yard with parking for 2 possible 3 cars, also a storage shed is included in the sale, seller may finance available
-
2025-04-02historical
-
2024-12-02price $129,000
-
2024-11-15price $129,000
-
2024-10-12$135,000 Active
-
2023-09-27soldstatus $120,000 Sold
-
2023-09-23status Pending
-
2023-08-28historical Active - Contingent
-
2023-08-23$120,000 Active
-
2022-08-05soldstatus $36,500 Sold
-
2022-07-26status Pending
-
2022-07-05$40,000 Active
ⓘ Source: listings_history table (triggers on properties + properties_extension) + one-shot
backfill from property_details.listing_events for pre-trigger history.
Tax reassessment forecast CA · Resets to sale price
- Current annual tax
- $1,411 · $118/mo
- Projected year-2 tax
- $1,411 · $118/mo
- Expected delta
- $0/yr ($0/mo · 0.0%)
ⓘ Screening estimate from a state-policy table — verify with the county assessor before closing.
Climate risk First Street
- Flood 1/10 Low FEMA zone X (unshaded) · 0% chance over 30 yrs
- Wildfire 2/10 Low
- Heat 8/10 Severe 7 d/yr ≥105°F today · 17 d/yr by 30 yrs out
- Wind 1/10 Low
- Air quality 10/10 Extreme 33 unhealthy d/yr today · 37 by 30 yrs out
Nearby sold comps map
Loading sold comps map…
Walkable amenities ~0.75 mi
Loading nearby amenities…
Taxation est. · year 1
- Rental income
- $25,695
- − Mortgage interest
- −$6,721
- − Property taxes
- −$1,411
- − Insurance
- −$600
- − Repairs & maintenance
- −$2,056
- − Management
- −$2,056
- − HOA
- −$9,900
- − Depreciation
- −$3,491
- Taxable loss
- −$539
- Est. tax savings @ 24.0%
- +$129
- After-tax cash flow
- $966/yr
For passive investors: Depreciation is non-cash, so a rental often shows a tax loss while cash-flowing — sheltering income. Rental losses are passive: they offset passive income freely, and up to $25,000/yr can offset ordinary (W-2) income if you actively participate and your MAGI is under $100k (phasing out to $0 by $150k); unused losses carry forward. On sale, claimed depreciation is recaptured at up to 25%, and gains may owe capital-gains tax (a 1031 exchange can defer both). Figures are a year-1 estimate at your 24.0% rate — not tax advice; consult a CPA.
Schools (NCES district)
- District
- Panama-Buena Vista Union
- NCES district ID
- 0606390
- Math proficiency
- 37% ▲ 3.00%
- Reading proficiency
- 52% ▲ 1.00%
- Median HH income
- $63,361
- Composite
- 41.71/100
- National rank
- #7191
- State rank
- #542 of 1400 in CA
Livability — Bakersfield
- Score
- 58/100
- State rank
- #716
- US rank
- #21355
Category grades
Schools grade is shown separately in the Schools card above.
Census & demographics
- Census place
- Bakersfield, CA
- County
- Kern County · 710,371 people
- City population
- 499,124
- Metro
- Bakersfield, CA
- Population (ZIP)
- 61,843
- Household income
- $91,943
- Rent vs Own
- Severe rent burden
- 1177.0
Population outlook (Kern County) Hauer SSP2
- Today (2025)
- 947,286 people
- By 2030
- 978,984 · +3.3%
- By 2040
- 1,045,018 · +10.3%
- By 2050
- 1,105,232 · +16.7%
- By 2075
- 1,229,538 · +29.8%
- By 2100
- 1,238,059 · +30.7%
Race, ethnicity, and origin ACS 2023
- Neighborhood character
- Diverse neighborhood (Simpson 0.61)
- Race & ethnicity
- Hispanic / Latino 57% Two or more races 28% White 22% Asian 13% Black 6%
- Hispanic origin (detail)
- Mexican 52%
- Common ancestry
- British 1% Romanian 1%
- Foreign-born
- 25% · Canada, Vietnam, China
- Languages at home
- 45% English-only · Spanish 40% Other Indo-European 8% Other Asian/Pacific 2%
Political lean MEDSL · Kern
- 2024 margin
- Strong R (+21.1) · D 38.2% · R 59.3% · Other 2.5%
- 2008→2024 swing
- -3.3pp toward R · 2008: -17.8pp · 2024: -21.1pp
- All cycles
- 2024: R+21.1 2020: R+10.2 2016: R+15.0 2012: R+20.9 2008: R+17.8
Not yet ingested
- Civics
- —
Market trends
- HPI YoY
- ▼ -85.95%
- Current HPI
- 335.9445
- Rent YoY
- ▲ 2.12%
- Metro
- Bakersfield, CA
- State GDP YoY
- ▲ 3.21%
- F500 in state
- 116
Industry mix (Fortune 500 HQ in CA)
| Industry | F500 HQs | Revenue |
|---|---|---|
| Technology | 27 | $1,492B |
|
||
| Financial Services | 3 | $174B |
|
||
| Retail | 3 | $44B |
|
||
| Insurance | 3 | $26B |
|
||
| Media / Entertainment | 2 | $115B |
|
||
| Pharmaceuticals / Biotech | 2 | $62B |
|
||
Price history
+212.5% since first listed12 events — show timeline
- 2026-04-08 Listed $124,990 GEMLS
- 2025-04-02 Listing Removed — CRMLS
- 2024-12-02 Price Changed $129,000 FRESNOMLS
- 2024-11-15 Price Changed $129,000 CRMLS
- 2024-10-12 Listed $135,000 CRMLS
- 2023-09-27 Sold (MLS) $120,000 GEMLS
- 2023-09-23 Pending — GEMLS
- 2023-08-28 Contingent — GEMLS
- 2023-08-23 Listed $120,000 GEMLS
- 2022-08-05 Sold (MLS) $36,500 GEMLS
- 2022-07-26 Pending — GEMLS
- 2022-07-05 Listed $40,000 GEMLS
Property tax history
+23.4%/yrLatest (2025): $1,411 · +236.5% YoY. Source: county tax records.
Cash-flow waterfall
monthlySold comps — $/sqft
last 12 mo · ≤1 miLoading sold comps…