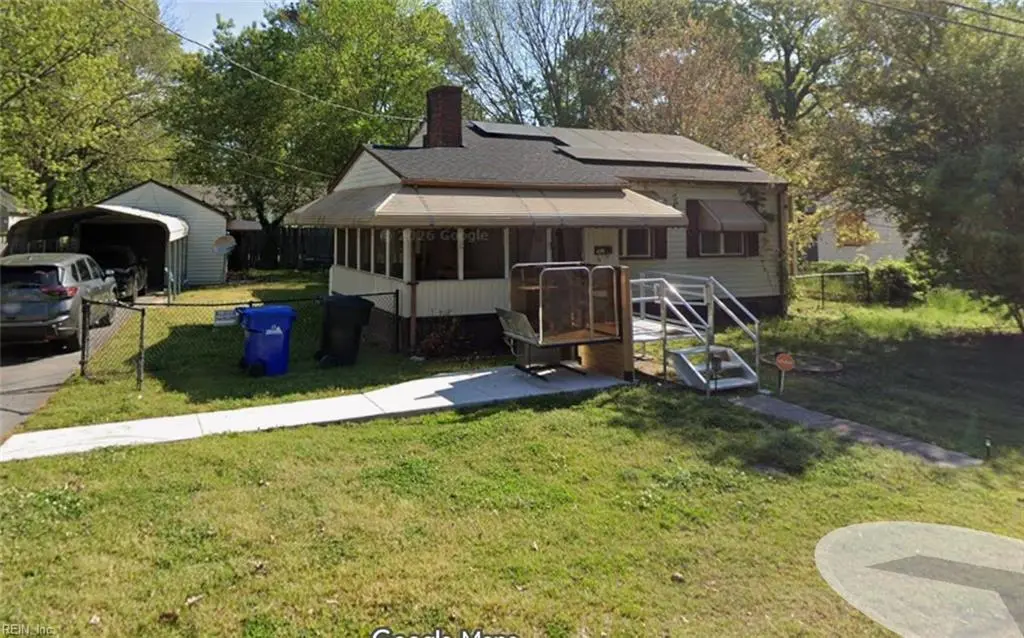
34 Frailey Pl · Portsmouth, VA
Flood risk 4/10 · Minor
- FEMA flood zone
- X (shaded)
- Chance of flooding over 30 yrs
- 0.22%
- Est. flood insurance / yr
- $507 – $1,088
Fire risk 1/10 · Minimal
- Est. fire insurance / yr
- $666 – $1,236
Heat risk 9/10 · Severe
- Hot days now (above 106°F)
- 7 days/yr
- Hot days in 30 yrs
- 15 days/yr
Wind risk 8/10 · Major
- Chance of severe wind over 30 yrs
- 80.0%
Air-quality risk 5/10 · Moderate
- Unhealthy air days now
- 6 days/yr
- Unhealthy air days in 30 yrs
- 7 days/yr
Risk factors via First Street. Map © Google.
Why this score? — see what drove the D grade
The composite is a weighted blend of 9 inputs, each scored 0–100. Each bar is that input's sub-score; the figure is the points it added to the 100-point composite (weight × sub-score).
- Appreciation +10.0/10.0
- Cash flow +9.4/30.0
- Schools +3.9/10.0
- Livability +3.7/5.0
- ARV discount +3.6/15.0
- Rent growth +3.5/5.0
- DSCR +2.6/10.0
- Condition / age +2.5/5.0
- 1% rule +2.4/10.0
$234,900
🖨 Deal sheet (PDF) 📄 Offer letter ✓ Due diligence
Key facts
- 6,969 sq ft lot
- Garage
- Built 1941
Property features AI
Finance
- HOA & community: No HOA fees
Exterior
- Parking: Covered carport; Driveway parking (3 spaces); Detached garage (approx. 320 sq ft)
- Utilities: City/County water; City/County sewer; Gas water heater
- Home design: Detached bungalow/ranch; Single-story; Level flooring; Simple ownership
- Construction: Vinyl siding; Crawl foundation; 1 story
- Exterior features: Patio; Screened porch; Converted garage; Storage shed; Back yard fenced with chain link and wood fencing
Interior
- Kitchen: Electric range; Refrigerator; Dishwasher; Disposal
- Bedrooms: First-floor bedroom with full bathroom; Master bedroom
- Flooring: Ceramic flooring; Laminate flooring
- Bathrooms: 2 full bathrooms
- Heating & cooling: Heat pump heating; Central air conditioning
- Interior features: Ceiling fan; Gas-propane fireplace; Pull-down attic stairs
- Laundry & utility: Main floor laundry; Washer hookup; Dryer hookup; Utility room
Neighborhood map
What this means for you Summary
Snapshot
- This is a 3-bed/2.0-bath single-family listed at $235k.
Deal economics
- At list price, monthly cash flow is $-168 ($-2k/yr) — negative.
- To cash-flow at today's rent, offer at most $205k (12.6% below list).
- To meet the 1% rule (rent ≥ 1% of price), the offer needs to be $173k (26.3% below list).
- Recommended offer: $173k (26.3% below list) — sets the bar for 1% rule.
Location & tenants
- Location reads 73/100 on livability (#172 in VA) — a middle-class / working-renter tenant base. Strengths: amenities A+, cost of living A+, housing A+; Watch: employment C-, crime F, commute F.
- Portsmouth City Public School District (urban): math 34% / reading 58% proficiency, ranked #107 of 131 in VA (top 82%) — families likely to look elsewhere, expect single-tenant / working-renter base with shorter leases.
- Zoned schools: Cradock Elementary (math 22% / reading 37%, grade F, #1,011 of 1,108 statewide, top 92%, 622 students, 98% FRL); Cradock Middle (math 32% / reading 62%, grade D+, #257 of 342 statewide, top 77%, 533 students, 100% FRL); Manor High (math 48% / reading 75%, grade B-, #240 of 319 statewide, top 75%, 1,236 students, 99% FRL) — zoned schools average 99% FRL vs 60% district-wide (39 pts higher); higher-poverty schools than district average — tighter screening recommended.
- Market conditions: Rents rising (+4.0%/yr); 65 active listings in the ZIP; 17 comparable units currently listed for rent nearby; rentals at typical pace (median 22d on market — plan ~3-4 weeks tenant-placement turnaround); 300 units permitted in Portsmouth city in 2024 (112 in 5+ unit buildings).
- This rent runs 43% of the median local income ($49k/yr) — at the standard rent-burdened threshold; future hikes will face affordability resistance.
Forward outlook
- In year one you build about $25k of equity ($2k loan paydown + $23k appreciation (10.0% local appreciation)).
- By year 2, paydown + projected appreciation supports a ~$40k cash-out refi (75% LTV) — recoverable capital for the next deal without selling this one.
Negotiation context
- It's been on market 28 days — a 2% lower offer ($231k) is reasonable based on typical stale-listing flexibility.
- 4 sale attempts since 4y ago with the ask held roughly flat each time — persistent listings suggest the price (not the market) is what's stuck; bring a comps-based counter.
Risks & watch-outs
- Watch-outs: built in 1941 — expect roof / HVAC / electrical / plumbing capex.
- Climate carrying-cost: severe wind risk, 80% chance of damaging wind over 30y; extreme-heat days projected 7→15/yr by 2055 (HVAC capex compounding) — expect insurance premiums to compound above CPI over the hold.
Questions for the listing agent
- What do current leases actually rent for vs. the listed asking? Can we see a recent rent roll and the last 12 months of T-12 income?
- Built in 1941 — when were the roof, HVAC, electrical panel, plumbing, and water heater last replaced?
- Is there a deadline driving the sale (1031 exchange, divorce, estate, relocation)? That informs how much negotiation room exists.
- Schools are B-rated — typically a magnet for longer-tenancy family renters. What's the average tenant stay here, and is there a school-zone premium baked into asking?
- Crime grade is F in this area — have there been break-ins, vandalism, or insurance claims at this property in the last 3 years? What carrier currently insures it and at what premium?
- The area grade is low — what's the realistic commute time and amenity access for the typical tenant pool here? Any planned neighborhood developments (good or bad) we should know about?
- What's the average days-on-market for RENTAL listings here right now (not sales)? A rising rental-DOM trend means longer vacancies and softer asking-rent achievability than the comps imply.
- What's the recent tenant-quality profile in this submarket — average credit score on applications, eviction rate, late-payment / NSF rate, and stable-employment percentage? A property-management company in the area should have these aggregated.
- How much new for-sale + rental construction is in the pipeline within 1–3 miles? Heavy new supply typically softens prices + rents 12–24 months out; constrained supply supports both.
Investment metrics
- 1% rule
- 0.74% ✗
- Cap rate
- 5.44%
- Cash-on-cash
- -3.06%
- DSCR
- 0.86
- GRM
- 11.3
CMA / ARV
- ARV (on-the-fly)
- $216,240
- Comps found
- 12
Show comp detail 12 sales within ~0.75 mi
| Address | Dist | Beds/Ba | Sqft | Sold | Price | $/sf | Match |
|---|---|---|---|---|---|---|---|
| 14 Woodland St | 0.26mi | 3/2.0 | 1,040 (+2%) | 7mo | $240,000 | $231 | 79 |
| 132 Cushing St | 0.33mi | 2/1.0 (-1) | 1,016 (-0%) | 3mo | $215,000 | $212 | 73 |
| 100 Dahlgren Ave Unit B | 0.33mi | 3/1.0 | 1,078 (+6%) | 1mo | $194,700 | $181 | 70 |
| 25 Fiske St | 0.19mi | 3/1.5 | 1,148 (+12%) | 6mo | $235,000 | $205 | 63 |
| 132 Afton Pkwy | 0.65mi | 3/2.0 | 1,056 (+4%) | 3mo | $244,900 | $232 | 61 |
| 41 Irwin St | 0.24mi | 3/1.0 | 900 (-12%) | 6mo | $215,000 | $239 | 61 |
| 206 Kelly Dr | 0.67mi | 2/2.0 (-1) | 1,000 (-2%) | 2mo | $125,000 | $125 | 59 |
| 4329 Deep Creek Blvd | 0.69mi | 3/1.0 | 985 (-3%) | 8mo | $230,000 | $234 | 52 |
| 12 Oakcrest St | 0.59mi | 3/1.0 | 1,115 (+9%) | 3mo | $120,000 | $108 | 50 |
| 70 Nicholson St | 0.59mi | 2/2.0 (-1) | 912 (-11%) | 3mo | $214,098 | $235 | 47 |
| 4320 Deep Creek Blvd | 0.72mi | 3/1.0 | 1,150 (+13%) | 1mo | $234,900 | $204 | 40 |
| 11 Aylwin Rd | 0.67mi | 2/1.0 (-1) | 1,165 (+14%) | 4mo | $129,900 | $112 | 33 |
Match score weights: distance 35% · size 25% · config 20% · recency 20%. Top-matched comps best support the ARV.
Projected returns pro-forma
10.0% appreciation · 3.97% rent growth · sell at horizon
- IRR
- 22.4%
- Equity multiple
- 2.81×
- Total profit
- $118,926
- Equity at exit
- $211,617
- IRR
- 20.3%
- Equity multiple
- 6.51×
- Total profit
- $362,160
- Equity at exit
- $456,359
Cash invested: $65,772 (down + closing). Projections, not guarantees.
Landlord ↔ Tenant lean methodology
- Overall (STATE)
- 55 Moderately Landlord-Leaning
- State Virginia
- 55 Moderately Landlord-Leaning · D+2
- County
- — inherits STATE
- City
- — inherits STATE
ZIP-level market 23702
- Home prices YoY
- 5.2%
- Rents YoY
- 4.0%
- Active inventory
- 65
- Price-to-rent
- 11.3×
Monthly cashflow live
- Estimated rent
- $1,730 high interval (Pro) →
- Mortgage (P&I)
- −$1,232
- Tax from tax record
- −$205 /mo · $2,458/yr
- Insurance
- −$98
- HOA
- −$0
- Vacancy / Maint / Mgmt
- −$363
- Net cashflow
- $-168
Break-even live
Sensitivity live
| Price | -10% $-35 | -5% $-101 | +0% $-168 | +5% $-234 | +10% $-301 |
|---|---|---|---|---|---|
| Rent | -10% $-304 | -5% $-236 | +0% $-168 | +5% $-99 | +10% $-31 |
| Rate | -1.0pp $-49 | -0.5pp $-108 | base $-168 | +0.5pp $-229 | +1.0pp $-291 |
UW: 25.0% down · 7.5% · 30yr · 1.5% tax · 5.0% vac · 8.0% maint · 8.0% mgmt
Financing live
Cash to close
- Down payment
- $58,725
- Closing costs
- $7,047
- Reserves months
- —
- Total cash needed
- —
Loan-product check · same deal, 3 products live
Conventional
25% down · 7.5% · 30yr
- Down + closing
- —
- Monthly P&I
- —
- Monthly cashflow
- —
- DSCR
- —
- Eligible?
- —
Personal DTI + credit; lowest rate.
DSCR
20% down · 8.5% · 30yr
- Down + closing
- —
- Monthly P&I
- —
- Monthly cashflow
- —
- DSCR
- —
- Eligible?
- —
No personal income docs; deal must DSCR.
Hard money
10% down · 12.0% · 12mo
- Down + closing
- —
- Monthly P&I
- —
- Monthly cashflow
- —
- DSCR
- —
- Eligible?
- —
Short-term bridge; refi at stabilization.
Rent comps 17 comps
| Address | Beds | Baths | Sqft | Rent | $/sqft | DOM | Units | Dist |
|---|---|---|---|---|---|---|---|---|
| 134 Monmouth St Portsmouth, VA | 3.0 | 2.5 | 1440 | $2,450 | $1.70 | 45d | 1 | 0.54mi |
| 18 Cooper Dr Portsmouth, VA | 2.0 | 1.0 | 920 | $1,400 | $1.52 | 19d | 1 | 0.67mi |
| 35 Fairview Cir S Portsmouth, VA | 4.0 | 1.5 | 1462 | $2,100 | $1.44 | 14d | 1 | 0.93mi |
| 21 DeKalb Ave Portsmouth, VA | 2.0 | 1.0 | 984 | $1,550 | $1.58 | 45d | 1 | 1.07mi |
| 3724 Deep Creek Blvd Unit 3754 Portsmouth, VA | 2.0 | 1.0 | 900 | $995 | $1.11 | 14d | 1 | 1.08mi |
| 3724 Deep Creek Blvd Unit 3728 Portsmouth, VA | 2.0 | 1.0 | 900 | $995 | $1.11 | 25d | 1 | 1.08mi |
| 2750 Greenwood Dr Portsmouth, VA | 3.0 | 2.0 | 1200 | $1,700 | $1.42 | 25d | 1 | 1.09mi |
| 231 Edison Ave Unit 231 Portsmouth, VA | 2.0 | 1.5 | 1050 | $1,275 | $1.21 | 12d | 1 | 1.20mi |
| 231 Edison Ave Portsmouth, VA | 2.0 | 1.5 | 1100 | $1,275 | $1.16 | 21d | 1 | 1.20mi |
| 102 Francis St #98 Portsmouth, VA | 2.0 | 1.5 | 1000 | $1,395 | $1.40 | 18d | 1 | 1.20mi |
| 98 Francis St Portsmouth, VA | 2.0 | 2.0 | 984 | $1,395 | $1.42 | 16d | 1 | 1.20mi |
| 251 Independence St Portsmouth, VA | 3.0 | 2.5 | 1294 | $2,550 | $1.97 | 25d | 1 | 1.22mi |
| 1114 Woodland Terrace Dr Chesapeake, VA | 3.0 | 1.0 | 1223 | $2,000 | $1.64 | 25d | 1 | 1.34mi |
| 908 Lake Village Dr Chesapeake, VA | 2.0–3.0 | 1.0 | 972 | $1,508 | $1.55 | 4d | 7 | 1.34mi |
| 213 Beacon Rd Portsmouth, VA | 3.0 | 2.0 | 1280 | $2,300 | $1.80 | 25d | 1 | 1.36mi |
| 940 Willis St Chesapeake, VA | 3.0 | 2.0 | 1150 | $1,795 | $1.56 | 18d | 1 | 1.49mi |
| 70 Manly St Portsmouth, VA | 2.0 | 1.0 | 1000 | $1,350 | $1.35 | 45d | 1 | 1.50mi |
Listing history 23 events
-
2026-06-21days on market $234,900 Active 28 DOM
-
2026-06-18days on market $234,900 Active 25 DOM
-
2026-06-17days on market $234,900 Active 24 DOM
-
2026-06-16days on market $234,900 Active 23 DOM
-
2026-06-15days on market $234,900 Active 22 DOM
-
2026-06-13days on market $234,900 Active 20 DOM
-
2026-06-09days on market $234,900 Active 16 DOM
-
2026-06-08days on market $234,900 Active 15 DOM
-
2026-06-07days on market $234,900 Active 14 DOM
-
2026-06-03days on market $234,900 Active 10 DOM
-
2026-06-02days on market $234,900 Active 9 DOM
-
2026-06-01days on market $234,900 Active 8 DOM
-
2026-05-31days on market $234,900 Active 7 DOM
-
2026-05-25$234,900 Active
-
2026-05-19$234,900
-
2024-02-28soldstatus $212,000
-
2024-02-08status Under Contract
-
2024-01-25historical Active Under Contract
-
2023-12-29$214,000 Active
-
2022-06-27soldstatus $185,000
-
2022-05-13status Under Contract
-
2022-05-11$180,000 Active
-
2007-08-06soldstatus $167,000
ⓘ Source: listings_history table (triggers on properties + properties_extension) + one-shot
backfill from property_details.listing_events for pre-trigger history.
Tax reassessment forecast VA · Resets to sale price
- Current annual tax
- $2,458 · $205/mo
- Projected year-2 tax
- $2,458 · $205/mo
- Expected delta
- $0/yr ($0/mo · 0.0%)
ⓘ Screening estimate from a state-policy table — verify with the county assessor before closing.
Climate risk First Street
- Flood 4/10 Moderate FEMA zone X (shaded) · 22% chance over 30 yrs
- Wildfire 1/10 Low
- Heat 9/10 Extreme 7 d/yr ≥106°F today · 15 d/yr by 30 yrs out
- Wind 8/10 Severe 80% chance of damaging wind over 30 yrs
- Air quality 5/10 Major 6 unhealthy d/yr today · 7 by 30 yrs out
Nearby sold comps map
Loading sold comps map…
Walkable amenities ~0.75 mi
Loading nearby amenities…
Taxation est. · year 1
- Rental income
- $20,762
- − Mortgage interest
- −$13,158
- − Property taxes
- −$2,458
- − Insurance
- −$1,174
- − Repairs & maintenance
- −$1,661
- − Management
- −$1,661
- − Depreciation
- −$6,833
- Taxable loss
- −$6,184
- Est. tax savings @ 24.0%
- +$1,484
- After-tax cash flow
- $-529/yr
For passive investors: Depreciation is non-cash, so a rental often shows a tax loss while cash-flowing — sheltering income. Rental losses are passive: they offset passive income freely, and up to $25,000/yr can offset ordinary (W-2) income if you actively participate and your MAGI is under $100k (phasing out to $0 by $150k); unused losses carry forward. On sale, claimed depreciation is recaptured at up to 25%, and gains may owe capital-gains tax (a 1031 exchange can defer both). Figures are a year-1 estimate at your 24.0% rate — not tax advice; consult a CPA.
Schools (NCES district)
- District
- Portsmouth City Public School District
- NCES district ID
- 5103000
- Math proficiency
- 34% ▼ -40.00%
- Reading proficiency
- 58% ▼ -12.00%
- Median HH income
- $46,152
- Composite
- 39.01/100
- National rank
- #4071
- State rank
- #107 of 131 in VA
Livability — Portsmouth
- Score
- 73/100
- State rank
- #172
- US rank
- #5381
Category grades
Schools grade is shown separately in the Schools card above.
Census & demographics
- Census place
- Portsmouth, VA
- County
- Portsmouth City · 96,366 people
- City population
- 96,366
- Metro
- Virginia Beach-Norfolk-Newport News, VA-NC
- Population (ZIP)
- 12,485
- Household income
- $48,835
- Rent vs Own
- Severe rent burden
- 534.0
Population outlook (Portsmouth County) Hauer SSP2
- Today (2025)
- 96,730 people
- By 2030
- 96,760 · +0.0%
- By 2040
- 96,573 · -0.2%
- By 2050
- 95,606 · -1.2%
- By 2075
- 93,579 · -3.3%
- By 2100
- 83,756 · -13.4%
Race, ethnicity, and origin ACS 2023
- Neighborhood character
- Diverse neighborhood (Simpson 0.62)
- Race & ethnicity
- Black 50% White 35% Two or more races 9% Hispanic / Latino 8%
- Hispanic origin (detail)
- Mexican 2% Puerto Rican 3%
- Common ancestry
- Lithuanian 1% Italian 1% Slovak 1%
- Foreign-born
- 4% · Canada, South Korea
- Languages at home
- 95% English-only · Spanish 4%
Political lean MEDSL · Portsmouth
- 2024 margin
- Solid D (+38.6) · D 68.6% · R 30.0% · Other 1.4%
- 2008→2024 swing
- -0.7pp no change · 2008: 39.3pp · 2024: 38.6pp
- All cycles
- 2024: D+38.6 2020: D+40.8 2016: D+36.5 2012: D+39.6 2008: D+39.3
Not yet ingested
- Civics
- —
Market trends
- HPI YoY
- ▲ 16.70%
- Current HPI
- 340.0817
- Rent YoY
- ▲ 3.97%
- Metro
- Virginia Beach-Norfolk-Newport News, VA-NC
- State GDP YoY
- ▲ 2.40%
- F500 in state
- 50
Industry mix (Fortune 500 HQ in VA)
| Industry | F500 HQs | Revenue |
|---|---|---|
| Aerospace / Defense | 4 | $236B |
|
||
| Technology / Defense | 3 | $32B |
|
||
| Financial Services | 2 | $176B |
|
||
| Utilities | 2 | $27B |
|
||
| Insurance | 2 | $25B |
|
||
| Technology | 2 | $15B |
|
||
Price history
+40.7% since first listed10 events — show timeline
- 2026-05-25 Listed $234,900 REINMLS
- 2026-05-19 Listed $234,900 REINMLS
- 2024-02-28 Sold (Public Records) $212,000 Public Records
- 2024-02-08 Pending — REINMLS
- 2024-01-25 Contingent — REINMLS
- 2023-12-29 Listed $214,000 REINMLS
- 2022-06-27 Sold (Public Records) $185,000 Public Records
- 2022-05-13 Pending — REINMLS
- 2022-05-11 Listed $180,000 REINMLS
- 2007-08-06 Sold (Public Records) $167,000 Public Records
Property tax history
+2.7%/yrLatest (2025): $2,458 · +1.3% YoY. Source: county tax records.
Cash-flow waterfall
monthlySold comps — $/sqft
last 12 mo · ≤1 miLoading sold comps…