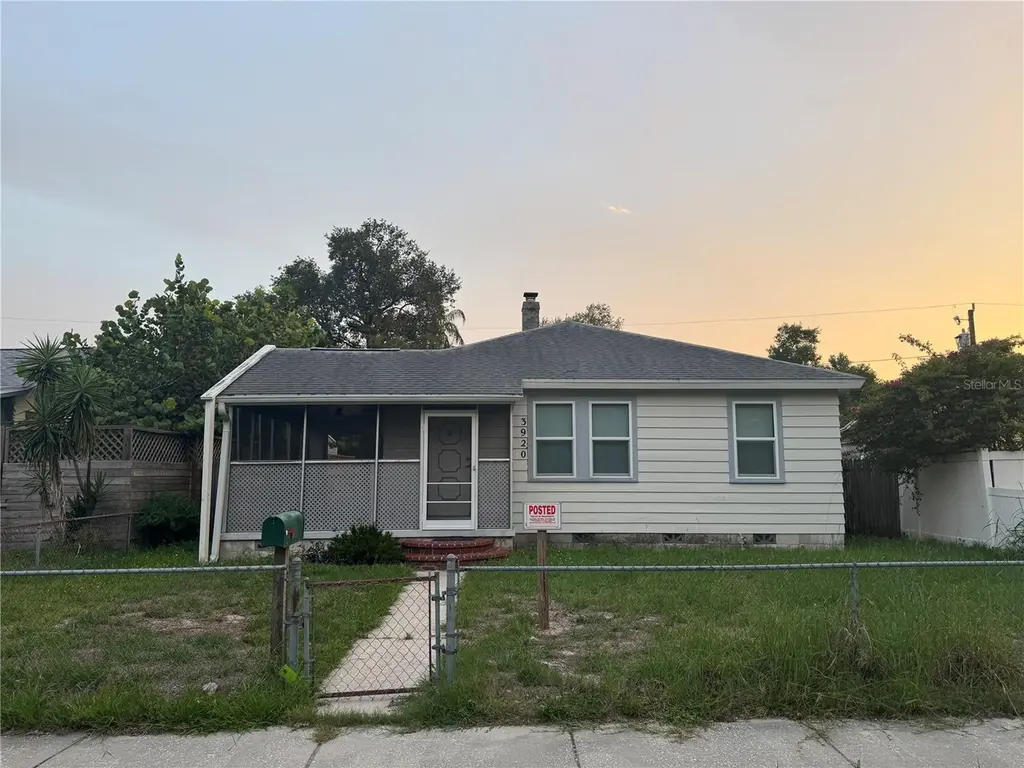
3920 Haines Rd N · St. Petersburg, FL
Flood risk 1/10 · Minimal
- FEMA flood zone
- X (unshaded)
- Chance of flooding over 30 yrs
- 0.0%
- Est. flood insurance / yr
- $507 – $1,088
Fire risk 1/10 · Minimal
- Est. fire insurance / yr
- $947 – $1,759
Heat risk 10/10 · Severe
- Hot days now (above 106°F)
- 7 days/yr
- Hot days in 30 yrs
- 24 days/yr
Wind risk 10/10 · Severe
- Chance of severe wind over 30 yrs
- 99.0%
Air-quality risk 4/10 · Minor
- Unhealthy air days now
- 4 days/yr
- Unhealthy air days in 30 yrs
- 4 days/yr
Risk factors via First Street. Map © Google.
Why this score? — see what drove the B- grade
The composite is a weighted blend of 9 inputs, each scored 0–100. Each bar is that input's sub-score; the figure is the points it added to the 100-point composite (weight × sub-score).
- Cash flow +25.7/30.0
- ARV discount +15.0/15.0
- DSCR +8.6/10.0
- 1% rule +7.0/10.0
- Schools +4.3/10.0
- Rent growth +3.1/5.0
- Livability +2.5/5.0
- Condition / age +2.5/5.0
- Appreciation +0.0/10.0
$215,000
🖨 Deal sheet 📄 Offer letter ✓ Due diligence
Listing remarks
Under contract-accepting backup offers. The possibilities are endless with this 3-bedroom, 1-bath residence nestled in one of St. Petersburg's most desirable areas. Perfectly positioned just moments from the sought-after neighborhoods of Allendale and Magnolia Heights, this home offers the ideal blend of convenience, character, and community. Step inside to discover this amazing space ready for its next chapter. Whether you're a first-time homebuyer, growing family, or investor, you'll appreciate the comfortable layout and welcoming atmosphere throughout. Outside, enjoy a fully fenced backyard with convenient alley access—perfect for pets, outdoor entertaining, gardening, or additiona
Key facts
- 4,953 sq ft lot
- Built 1947
- Listed 5 days
Tags
Property features AI
Finance
- Financial info: Lease restrictions apply
- HOA & community: No HOA association indicated
Exterior
- Parking: Alley access
- Utilities: Public water; Public sewer; Electricity connected; Sewer connected; Water connected; Cable available; Phone available
- Home design: Single family residence; Residential property; One-story; Faces northeast; Listed condition: fixer
- Construction: Frame construction; Shingle roof; Slab foundation; Approximately 2026 building area total (per public records)
- Exterior features: Porch with screened and side porch areas; Private mailbox; Sidewalk; Wood fencing; Paved, publicly maintained road
Interior
- Kitchen: No appliances included
- Bedrooms: 3 bedrooms
- Flooring: Tile flooring; Wood flooring
- Bathrooms: 1 full bathroom
- Heating & cooling: Central heating; Wall/window air conditioning units
- Interior features: Ceiling fans; Thermostat
- Laundry & utility: Washer hookup; Electric dryer hookup; Laundry closet
Neighborhood map
What this means for you Summary
Snapshot
- This is a 3-bed/1.0-bath single-family listed at $215k.
Deal economics
- At list price, monthly cash flow is $514 ($6k/yr) — positive.
- The deal already cash-flows at list — no discount required.
- Meets the 1% rule at list price ($3k rent vs $215k).
- Cap rate 9.2% vs local median 2.6% in St. Petersburg — top-decile yield for the area; either an underpriced asset or a hidden risk that comps aren't pricing in. Stress-test before assuming the spread holds.
Location & tenants
- Location reads: area grade B — affects rentability + tenant quality, not the cash-flow math above.
- Pinellas (suburban): math 51% / reading 51% proficiency, ranked #31 of 73 in FL (top 42%) — acceptable for families but not a draw, mixed tenant base, ~2y average lease.
- Market conditions: Rents rising (+2.2%/yr); 451 active listings in the ZIP; 40 comparable units currently listed for rent nearby; rentals leasing fast (median 8d on market — plan ~1-2 weeks tenant-placement turnaround); solid renter incomes; 2,676 units permitted in Pinellas County in 2024 (1,422 in 5+ unit buildings).
- This rent runs 33% of the median local income ($95k/yr) — at the standard rent-burdened threshold; future hikes will face affordability resistance.
Forward outlook
- Local home prices are declining (-3.0%/yr); year-one equity from $1k of loan paydown is wiped out by about $6k of value loss. Plan a longer hold.
- Pinellas County population projected at +14% by 2050 — modest demand growth; plan on rents tracking national, not racing it.
Negotiation context
- Only 5 days on market — expect competitive offers; lowballing is unlikely to land.
- Current owner paid $28k; list at $215k implies a 668% gain — meaningful room to come down on a strong offer.
Risks & watch-outs
- Watch-outs: built in 1947 — expect roof / HVAC / electrical / plumbing capex.
- Climate carrying-cost: severe wind risk, 99% chance of damaging wind over 30y; extreme-heat days projected 7→24/yr by 2055 (HVAC capex compounding) — expect insurance premiums to compound above CPI over the hold.
Questions for the listing agent
- Built in 1947 — when were the roof, HVAC, electrical panel, plumbing, and water heater last replaced?
- Is there a deadline driving the sale (1031 exchange, divorce, estate, relocation)? That informs how much negotiation room exists.
- What's the average days-on-market for RENTAL listings here right now (not sales)? A rising rental-DOM trend means longer vacancies and softer asking-rent achievability than the comps imply.
- What's the recent tenant-quality profile in this submarket — average credit score on applications, eviction rate, late-payment / NSF rate, and stable-employment percentage? A property-management company in the area should have these aggregated.
- How much new for-sale + rental construction is in the pipeline within 1–3 miles? Heavy new supply typically softens prices + rents 12–24 months out; constrained supply supports both.
Investment metrics
- 1% rule
- 1.20% ✓
- Cap rate
- 9.16%
- Cash-on-cash
- 10.25%
- DSCR
- 1.46
- GRM
- 6.9
CMA / ARV
- ARV (on-the-fly)
- $383,412
- Comps found
- 12
Show comp detail 12 sales within ~0.75 mi
| Address | Dist | Beds/Ba | Sqft | Sold | Price | $/sf | Match |
|---|---|---|---|---|---|---|---|
| 1030 32nd Ave N | 0.53mi | 2/1.5 (-1) | 1,074 (+1%) | 3mo | $555,000 | $517 | 65 |
| 1246 37th Ave N | 0.16mi | 2/1.0 (-1) | 916 (-14%) | 2mo | $433,000 | $473 | 62 |
| 1140 49th Ave N | 0.59mi | 3/2.0 | 1,128 (+6%) | 3mo | $405,000 | $359 | 57 |
| 3515 19th St N | 0.50mi | 2/2.0 (-1) | 1,134 (+6%) | 3mo | $461,000 | $407 | 55 |
| 3433 18th St N | 0.48mi | 2/1.0 (-1) | 1,180 (+10%) | 2mo | $375,000 | $318 | 54 |
| 3615 Haines Rd N | 0.26mi | 2/2.0 (-1) | 1,222 (+14%) | 3mo | $507,500 | $415 | 52 |
| 3126 Queen St N | 0.62mi | 2/1.0 (-1) | 979 (-8%) | 3mo | $320,000 | $327 | 50 |
| 3255 18th St N | 0.56mi | 2/1.0 (-1) | 936 (-12%) | 1mo | $225,000 | $240 | 48 |
| 710 32nd Ave N | 0.72mi | 2/1.0 (-1) | 952 (-11%) | 3mo | $525,000 | $551 | 41 |
| 1147 51st Ave N | 0.72mi | 2/2.0 (-1) | 979 (-8%) | 3mo | $330,000 | $337 | 41 |
| 3125 19th St N | 0.67mi | 2/1.0 (-1) | 910 (-15%) | 0mo | $320,000 | $352 | 39 |
| 1121 51st Ave N | 0.73mi | 3/2.0 | 1,228 (+15%) | 0mo | $425,000 | $346 | 37 |
Match score weights: distance 35% · size 25% · config 20% · recency 20%. Top-matched comps best support the ARV.
Projected returns pro-forma
-3.0% appreciation · 2.21% rent growth · sell at horizon
- IRR
- -1.8%
- Equity multiple
- 0.93×
- Total profit
- $-4,051
- Equity at exit
- $32,057
- IRR
- 7.0%
- Equity multiple
- 1.51×
- Total profit
- $30,691
- Equity at exit
- $18,589
Cash invested: $60,200 (down + closing). Projections, not guarantees.
Landlord ↔ Tenant lean methodology
- Overall (STATE)
- 87 Strongly Landlord-Friendly
- State Florida
- 87 Strongly Landlord-Friendly · R+3
- County
- — inherits STATE
- City
- — inherits STATE
ZIP-level market 33703
- Rents YoY
- 2.2%
- Active inventory
- 451
- Price-to-rent
- 6.9×
Monthly cashflow live
- Estimated rent
- $2,583 high interval (Pro) →
- Mortgage (P&I)
- −$1,127
- Tax from tax record
- −$309 /mo · $3,706/yr
- Insurance
- −$90
- HOA
- −$0
- Vacancy / Maint / Mgmt
- −$542
- Net cashflow
- $514
Break-even live
UW: 25.0% down · 7.5% · 30yr · 1.5% tax · 5.0% vac · 8.0% maint · 8.0% mgmt
Financing live
Cash to close
- Down payment
- $53,750
- Closing costs
- $6,450
- Reserves months
- —
- Total cash needed
- —
Loan-product check · same deal, 3 products live
Conventional
25% down · 7.5% · 30yr
- Down + closing
- —
- Monthly P&I
- —
- Monthly cashflow
- —
- DSCR
- —
- Eligible?
- —
Personal DTI + credit; lowest rate.
DSCR
20% down · 8.5% · 30yr
- Down + closing
- —
- Monthly P&I
- —
- Monthly cashflow
- —
- DSCR
- —
- Eligible?
- —
No personal income docs; deal must DSCR.
Hard money
10% down · 12.0% · 12mo
- Down + closing
- —
- Monthly P&I
- —
- Monthly cashflow
- —
- DSCR
- —
- Eligible?
- —
Short-term bridge; refi at stabilization.
Rent comps 40 comps
| Address | Beds | Baths | Sqft | Rent | $/sqft | DOM | Units | Dist |
|---|---|---|---|---|---|---|---|---|
| 4104 1/2 Haines Rd N Unit 1 St. Petersburg, FL | 2.0 | 1.0 | 1000 | $1,850 | $1.85 | 24d | 1 | 0.13mi |
| 3700 Haines Rd N St Petersburg, FL | 1.0–2.0 | 1.0 | 675 | $1,950 | $2.89 | 14d | 2 | 0.18mi |
| 3651 Haines Rd N Saint Petersburg, FL | 2.0 | 1.0 | 950 | $1,800 | $1.89 | 12d | 1 | 0.22mi |
| 1221 35th Ave N Saint Petersburg, FL | 3.0 | 2.0 | 1074 | $2,900 | $2.70 | 17d | 1 | 0.27mi |
| 1329 34th Ave N Saint Petersburg, FL | 4.0 | 2.0 | 1252 | $3,700 | $2.96 | 24d | 1 | 0.33mi |
| 3725 18th St N Saint Petersburg, FL | 2.0 | 1.0 | 700 | $1,795 | $2.56 | 16d | 1 | 0.40mi |
| 4481 Crestwood Dr N Saint Petersburg, FL | 2.0 | 1.0 | 720 | $1,950 | $2.71 | 4d | 1 | 0.44mi |
| 3131 16th St N Unit 4 St. Petersburg, FL | 2.0 | 1.0 | 1000 | $1,750 | $1.75 | 11d | 1 | 0.53mi |
| 4628 Dr Martin Luther King Jr St N Saint Petersburg, FL | 3.0 | 2.0 | 1421 | $2,950 | $2.08 | 24d | 1 | 0.53mi |
| 3107 16th St N St. Petersburg, FL | 2.0 | 1.0 | 700 | $2,285 | $3.26 | 4d | 1 | 0.55mi |
| 3103 16th St N Unit 3103 St. Petersburg, FL | 2.0 | 1.0 | 700 | $2,225 | $3.18 | 3d | 1 | 0.56mi |
| 3101 16th St N St. Petersburg, FL | 2.0 | 1.0 | 700 | $1,995 | $2.85 | 4d | 1 | 0.56mi |
| 3301 19th St N Saint Petersburg, FL | 3.0 | 1.0 | 866 | $2,200 | $2.54 | 4d | 1 | 0.59mi |
| 646 38th Ave N Saint Petersburg, FL | 2.0 | 1.0 | 978 | $2,400 | $2.45 | 4d | 1 | 0.60mi |
| 800 32nd Ave N Saint Petersburg, FL | 1.0–2.0 | 1.0 | 932 | $1,799 | $1.93 | 2d | 3 | 0.62mi |
| 3066 8th St N Saint Petersburg, FL | 3.0 | 2.0 | 1232 | $3,500 | $2.84 | 4d | 1 | 0.66mi |
| 1650 30th Ave N Saint Petersburg, FL | 2.0 | 1.0 | 830 | $1,850 | $2.23 | 24d | 1 | 0.67mi |
| 613 44th Ave N Saint Petersburg, FL | 2.0 | 1.0 | 1124 | $2,250 | $2.00 | 4d | 1 | 0.70mi |
| 510 34th Ave N Saint Petersburg, FL | 2.0 | 2.0 | 1334 | $3,200 | $2.40 | 4d | 1 | 0.77mi |
| 547 46th Ave N Saint Petersburg, FL | 2.0 | 1.0 | 837 | $2,000 | $2.39 | 7d | 1 | 0.77mi |
| 2758 10th St N Saint Petersburg, FL | 2.0 | 2.0 | 1090 | $3,350 | $3.07 | 4d | 1 | 0.78mi |
| 3113 Union St N Saint Petersburg, FL | 4.0 | 2.0 | 1156 | $2,261 | $1.96 | 4d | 1 | 0.79mi |
| 2901 20th St N Saint Petersburg, FL | 2.0 | 1.0 | 732 | $2,200 | $3.01 | 24d | 1 | 0.80mi |
| 5210 Doctor Martin Luther King Junior St N St. Petersburg, FL | 3.0 | 2.0 | 1318 | $3,600 | $2.73 | 14d | 1 | 0.89mi |
| 550 50th Ave N Saint Petersburg, FL | 2.0 | 1.0 | 765 | $1,700 | $2.22 | 7d | 2 | 0.91mi |
| 628 51st Ave N Saint Petersburg, FL | 3.0 | 2.5 | 1480 | $2,800 | $1.89 | 3d | 1 | 0.92mi |
| 324 42nd Ave N Saint Petersburg, FL | 2.0 | 2.0 | 1434 | $3,600 | $2.51 | 4d | 1 | 0.92mi |
| 780 27th Ave N Saint Petersburg, FL | 2.0 | 1.0 | 775 | $2,000 | $2.58 | 24d | 1 | 0.93mi |
| 1145 54th Ave N Saint Petersburg, FL | 2.0 | 1.0 | 810 | $1,850 | $2.28 | 24d | 1 | 0.93mi |
| 1416 55th Ave N St Petersburg, FL | 3.0 | 2.0 | 1300 | $4,600 | $3.54 | 24d | 1 | 0.96mi |
| 5185 6th Way N St Petersburg, FL | 3.0 | 2.5 | 1480 | $3,150 | $2.13 | 4d | 1 | 0.97mi |
| 2519 39th Ave N Saint Petersburg, FL | 3.0 | 2.0 | 1005 | $2,750 | $2.74 | 24d | 1 | 0.97mi |
| 2310 30th Ave N Saint Petersburg, FL | 2.0 | 1.0 | 824 | $2,950 | $3.58 | 4d | 1 | 0.97mi |
| 2912 23rd St N Saint Petersburg, FL | 3.0 | 1.0 | 816 | $2,180 | $2.67 | 20d | 1 | 0.99mi |
| 617 52nd Ave N Saint Petersburg, FL | 3.0 | 2.5 | 1481 | $3,250 | $2.19 | 4d | 1 | 0.99mi |
| 1412 56th Ave N Saint Petersburg, FL | 2.0 | 1.0 | 1156 | $2,195 | $1.90 | 4d | 1 | 1.02mi |
| 3036 Xenia St N Saint Petersburg, FL | 2.0 | 1.0 | 900 | $1,799 | $2.00 | 24d | 1 | 1.02mi |
| 131 41st Ave N Saint Petersburg, FL | 2.0 | 2.0 | 933 | $2,100 | $2.25 | 3d | 2 | 1.05mi |
| 1118 23rd Ave N Saint Petersburg, FL | 2.0 | 1.0 | 1116 | $2,450 | $2.20 | 4d | 1 | 1.05mi |
| 3038 25th St N Saint Petersburg, FL | 2.0 | 1.0 | 1050 | $1,999 | $1.90 | 17d | 1 | 1.07mi |
Listing history 5 events
-
2026-06-13statusdays on market $215,000 Pending 5 DOM
-
2026-06-09days on market $215,000 Active 3 DOM
-
2026-06-08days on market $215,000 Active 2 DOM
-
2026-06-07remarks 693-char remark
-
2026-06-07$215,000 Active 1 DOM
ⓘ Source: listings_history table (triggers on properties + properties_extension) + one-shot
backfill from property_details.listing_events for pre-trigger history.
Tax reassessment forecast FL · Resets to sale price
- Current annual tax
- $3,706 · $309/mo
- Projected year-2 tax
- $3,706 · $309/mo
- Expected delta
- $0/yr ($0/mo · 0.0%)
ⓘ Screening estimate from a state-policy table — verify with the county assessor before closing.
Climate risk First Street
- Flood 1/10 Low FEMA zone X (unshaded) · 0% chance over 30 yrs
- Wildfire 1/10 Low
- Heat 10/10 Extreme 7 d/yr ≥106°F today · 24 d/yr by 30 yrs out
- Wind 10/10 Extreme 99% chance of damaging wind over 30 yrs
- Air quality 4/10 Moderate 4 unhealthy d/yr today · 4 by 30 yrs out
Nearby sold comps map
Loading sold comps map…
Walkable amenities ~0.75 mi
Loading nearby amenities…
Taxation est. · year 1
- Rental income
- $30,992
- − Mortgage interest
- −$12,043
- − Property taxes
- −$3,706
- − Insurance
- −$1,075
- − Repairs & maintenance
- −$2,479
- − Management
- −$2,479
- − Depreciation
- −$6,255
- Taxable income
- $2,954
- Est. tax owed @ 24.0%
- −$709
- After-tax cash flow
- $5,464/yr
For passive investors: Depreciation is non-cash, so a rental often shows a tax loss while cash-flowing — sheltering income. Rental losses are passive: they offset passive income freely, and up to $25,000/yr can offset ordinary (W-2) income if you actively participate and your MAGI is under $100k (phasing out to $0 by $150k); unused losses carry forward. On sale, claimed depreciation is recaptured at up to 25%, and gains may owe capital-gains tax (a 1031 exchange can defer both). Figures are a year-1 estimate at your 24.0% rate — not tax advice; consult a CPA.
Schools (NCES district)
- District
- Pinellas
- NCES district ID
- 1201560
- Math proficiency
- 51% ▼ -5.00%
- Reading proficiency
- 51% ▼ -3.00%
- Median HH income
- $46,270
- Composite
- 43.27/100
- National rank
- #3046
- State rank
- #31 of 73 in FL
Livability — St. Petersburg
No livability data for this city. (Only ~50 U.S. cities are tracked.)
Census & demographics
- Census place
- St. Petersburg, FL
- County
- Pinellas County · 939,478 people
- City population
- 249,151
- Metro
- Tampa-St. Petersburg-Clearwater, FL
- Population (ZIP)
- 25,264
- Household income
- $95,224
- Rent vs Own
- Severe rent burden
- 509.0
Population outlook (Pinellas County) Hauer SSP2
- Today (2025)
- 1,027,532 people
- By 2030
- 1,063,586 · +3.5%
- By 2040
- 1,125,020 · +9.5%
- By 2050
- 1,168,637 · +13.7%
- By 2075
- 1,265,188 · +23.1%
- By 2100
- 1,260,357 · +22.7%
Race, ethnicity, and origin ACS 2023
- Neighborhood character
- Predominantly White (76%)
- Race & ethnicity
- White 76% Hispanic / Latino 10% Two or more races 10% Black 5% Asian 4%
- Hispanic origin (detail)
- Mexican 1% Puerto Rican 2% Cuban 2%
- Common ancestry
- Lithuanian 4% Romanian 3% Italian 2%
- Foreign-born
- 9% · Canada, Vietnam
- Languages at home
- 87% English-only · Spanish 6% Russian/Polish/Slavic 2% Other Indo-European 1%
Political lean MEDSL · Pinellas
- 2024 margin
- Lean R (+5.2) · D 46.9% · R 52.1%
- 2008→2024 swing
- -13.5pp toward R · 2008: 8.3pp · 2024: -5.2pp
- All cycles
- 2024: R+5.2 2020: D+0.2 2016: R+1.1 2012: D+5.6 2008: D+8.3
Not yet ingested
- Civics
- —
Market trends
- HPI YoY
- ▼ -617.95%
- Current HPI
- 352.2886
- Rent YoY
- ▲ 2.21%
- Metro
- Tampa-St. Petersburg-Clearwater, FL
- State GDP YoY
- ▲ 3.28%
- F500 in state
- 36
Industry mix (Fortune 500 HQ in FL)
| Industry | F500 HQs | Revenue |
|---|---|---|
| Industrial Technology | 2 | $29B |
|
||
| Insurance | 2 | $17B |
|
||
| Retail | 1 | $60B |
|
||
| Technology Distribution | 1 | $58B |
|
||
| Homebuilding | 1 | $35B |
|
||
| Technology Manufacturing | 1 | $35B |
|
||
Price history
+465.8% since first listed4 events — show timeline
- 2026-06-06 Listed $215,000 Stellar MLS as Distributed by MLS Grid
- 1995-12-22 Sold (Public Records) $28,000 Public Records
- 1986-06-11 Sold (Public Records) $46,100 Public Records
- 1982-04-01 Sold (Public Records) $38,000 Public Records
Property tax history
+11.3%/yrLatest (2025): $3,706 · +5.3% YoY. Source: county tax records.
Cash-flow waterfall
monthlySold comps — $/sqft
last 12 mo · ≤1 miLoading sold comps…