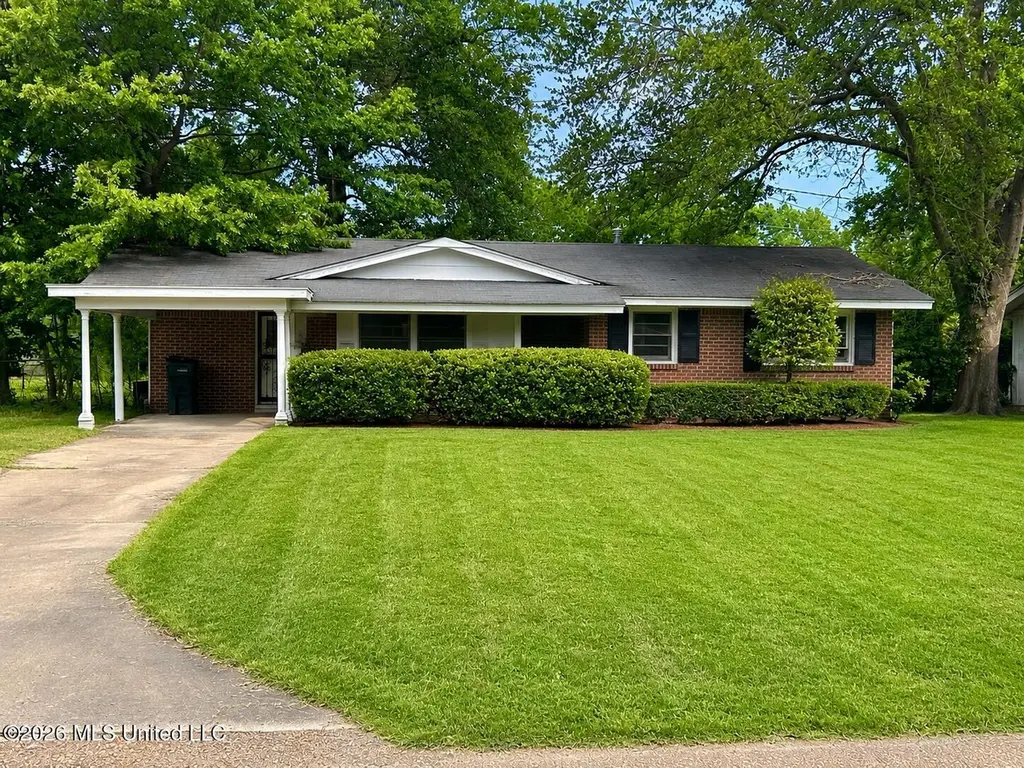
1106 W President Ave · Greenwood, MS
Flood risk 1/10 · Minimal
- FEMA flood zone
- X
- Chance of flooding over 30 yrs
- 0.0%
- Est. flood insurance / yr
- $507 – $1,088
Fire risk 1/10 · Minimal
- Est. fire insurance / yr
- $1,241 – $2,305
Heat risk 7/10 · Major
- Hot days now (above 110°F)
- 7 days/yr
- Hot days in 30 yrs
- 21 days/yr
Wind risk 6/10 · Moderate
- Chance of severe wind over 30 yrs
- 27.0%
Air-quality risk 1/10 · Minimal
- Unhealthy air days now
- 0 days/yr
- Unhealthy air days in 30 yrs
- 0 days/yr
Risk factors via First Street. Map © Google.
Why this score? — see what drove the B+ grade
The composite is a weighted blend of 9 inputs, each scored 0–100. Each bar is that input's sub-score; the figure is the points it added to the 100-point composite (weight × sub-score).
- Cash flow +30.0/30.0
- ARV discount +15.0/15.0
- 1% rule +10.0/10.0
- DSCR +10.0/10.0
- Schools +5.0/10.0
- Livability +3.6/5.0
- Rent growth +2.5/5.0
- Condition / age +2.5/5.0
- Appreciation +0.0/10.0
$40,000
🖨 Deal sheet (PDF) 📄 Offer letter ✓ Due diligence
Listing remarks
This 3-bedroom, 1-bath ranch-style home offers a great opportunity for investors or buyers looking to put their personal touch on a property. With a classic layout and solid structure, this home is full of potential but will require some TLC to bring it to its full charm. Inside, you'll find an open-concept kitchen and dining area that provides a functional space for everyday living and entertaining. The layout offers a good foundation for updates and customization to suit your style. Outside, the property features a fenced backyard—ideal for pets, children, or added privacy—along with a storage shed for tools and equipment. The home also includes a covered carport and sits bene
Key facts
- 8,712 sq ft lot
- 3 parking spots
- Built 1961
Property features AI
Finance
- Other: Building area listed as 1,080 (source: public records)
- Financial info: No investor or income/expense details provided
- HOA & community: No HOA details provided
Exterior
- Parking: Carport (1 car); Driveway; Concrete parking; 3 total parking spaces
- Security: No security features provided
- Utilities: Public water; Public sewer; Electricity available; Natural gas available; Sewer available; Water available
- Home design: Single family residence (house); One story; Fixer condition
- Construction: Built with asbestos and brick materials; Slab foundation; Year built from public records
- Exterior features: Shingle roof; Back yard fencing; City lot; Fenced yard; Few trees; Level lot
Interior
- Kitchen: No kitchen appliance details provided
- Bedrooms: One-level layout
- Flooring: Combination flooring
- Bathrooms: 1 full bathroom
- Heating & cooling: Central heating; Central air conditioning
- Interior features: Water heater; Outside fireplace; Wood frame windows
- Laundry & utility: No laundry details provided
Neighborhood map
What this means for you Summary
Snapshot
- This is a 3-bed/1.0-bath single-family listed at $40k.
Deal economics
- At list price, monthly cash flow is $176 ($2k/yr) — positive.
- The deal already cash-flows at list — no discount required.
- Meets the 1% rule at list price ($700 rent vs $40k).
- Cap rate 11.6% vs local median 4.7% in Greenwood — top-decile yield for the area; either an underpriced asset or a hidden risk that comps aren't pricing in. Stress-test before assuming the spread holds.
Location & tenants
- Location reads 71/100 on livability (#31 in MS) — a middle-class / working-renter tenant base. Strengths: cost of living A+, health & safety A+, housing A; Watch: schools D, amenities F, commute F.
- Market conditions: 101 active listings in the ZIP; 1 comparable units currently listed for rent nearby; 9 units permitted in Leflore County in 2024 (0 in 5+ unit buildings).
Forward outlook
- Local home prices are declining (-3.0%/yr); year-one equity from $277 of loan paydown is wiped out by about $1k of value loss. Plan a longer hold.
- Leflore County population projected at -29% by 2050 — secular population decline; favor cash flow + early exit over multi-decade hold.
- At projected returns (-3.0% appreciation + 3.0% rent growth), your $11k cash investment doubles in ~7 years — after that, you're playing with house money.
Negotiation context
- Only 1 days on market — expect competitive offers; lowballing is unlikely to land.
- 2 sale attempts with the ask held roughly flat each time — persistent listings suggest the price (not the market) is what's stuck; bring a comps-based counter.
Risks & watch-outs
- Watch-outs: property tax is 4.5% of price.
- Climate carrying-cost: major wind risk, 27% chance of damaging wind over 30y; extreme-heat days projected 7→21/yr by 2055 (HVAC capex compounding) — expect insurance premiums to compound above CPI over the hold.
Questions for the listing agent
- Built in 1961 — when were the roof, HVAC, electrical panel, plumbing, and water heater last replaced?
- Property tax is high relative to price — has the assessment been appealed recently, and will the sale trigger a re-assessment?
- Is there a deadline driving the sale (1031 exchange, divorce, estate, relocation)? That informs how much negotiation room exists.
- Schools are D-rated, which usually means shorter tenancies and higher turnover. Who's the typical renter profile here, and what's been the actual vacancy rate?
- What's the average days-on-market for RENTAL listings here right now (not sales)? A rising rental-DOM trend means longer vacancies and softer asking-rent achievability than the comps imply.
- What's the recent tenant-quality profile in this submarket — average credit score on applications, eviction rate, late-payment / NSF rate, and stable-employment percentage? A property-management company in the area should have these aggregated.
- How much new for-sale + rental construction is in the pipeline within 1–3 miles? Heavy new supply typically softens prices + rents 12–24 months out; constrained supply supports both.
Investment metrics
- 1% rule
- 1.75% ✓
- Cap rate
- 11.58%
- Cash-on-cash
- 18.89%
- DSCR
- 1.84
- GRM
- 4.8
CMA / ARV
- ARV (on-the-fly)
- $70,200
- Comps found
- 7
Show comp detail 7 sales within ~0.75 mi
| Address | Dist | Beds/Ba | Sqft | Sold | Price | $/sf | Match |
|---|---|---|---|---|---|---|---|
| 402 W Jefferson Ave | 0.50mi | 2/1.0 (-1) | 960 (-11%) | 2mo | $65,000 | $68 | 52 |
| 410 Cherokee Rd | 0.49mi | 3/1.0 | 1,164 (+8%) | 17mo | $87,500 | $75 | 50 |
| 604 W West President Ave | 0.43mi | 2/1.0 (-1) | 1,141 (+6%) | 23mo | $74,000 | $65 | 46 |
| 507 W Jefferson Ave | 0.40mi | 2/1.0 (-1) | 1,225 (+13%) | 10mo | $55,000 | $45 | 46 |
| 303 W Adams Ave | 0.55mi | 2/1.0 (-1) | 1,000 (-7%) | 13mo | $60,000 | $60 | 46 |
| 308 W Harding Ave | 0.61mi | 2/1.0 (-1) | 1,177 (+9%) | 11mo | $62,000 | $53 | 43 |
| 611 W President Ave | 0.42mi | 2/1.0 (-1) | 985 (-9%) | 24mo | $105,000 | $107 | 41 |
Match score weights: distance 35% · size 25% · config 20% · recency 20%. Top-matched comps best support the ARV.
Projected returns pro-forma
-3.0% appreciation · 3.0% rent growth · sell at horizon
- IRR
- 10.9%
- Equity multiple
- 1.43×
- Total profit
- $4,820
- Equity at exit
- $5,964
- IRR
- 20.0%
- Equity multiple
- 2.69×
- Total profit
- $18,951
- Equity at exit
- $3,458
Cash invested: $11,200 (down + closing). Projections, not guarantees.
Landlord ↔ Tenant lean methodology
- Overall (STATE)
- 90 Strongly Landlord-Friendly
- State Mississippi
- 90 Strongly Landlord-Friendly · R+11
- County
- — inherits STATE
- City
- — inherits STATE
ZIP-level market 38930
- Home prices YoY
- -18.6%
- Active inventory
- 101
- Price-to-rent
- 4.8×
Monthly cashflow live
- Estimated rent
- $700 medium interval (Pro) →
- Mortgage (P&I)
- −$210
- Tax from tax record
- −$150 /mo · $1,803/yr
- Insurance
- −$17
- HOA
- −$0
- Vacancy / Maint / Mgmt
- −$147
- Net cashflow
- $176
Break-even live
Sensitivity live
| Price | -10% $304 | -5% $188 | +0% $176 | +5% $165 | +10% $154 |
|---|---|---|---|---|---|
| Rent | -10% $121 | -5% $149 | +0% $176 | +5% $204 | +10% $232 |
| Rate | -1.0pp $196 | -0.5pp $186 | base $176 | +0.5pp $166 | +1.0pp $155 |
UW: 25.0% down · 7.5% · 30yr · 1.5% tax · 5.0% vac · 8.0% maint · 8.0% mgmt
Financing live
Cash to close
- Down payment
- $10,000
- Closing costs
- $1,200
- Reserves months
- —
- Total cash needed
- —
Loan-product check · same deal, 3 products live
Conventional
25% down · 7.5% · 30yr
- Down + closing
- —
- Monthly P&I
- —
- Monthly cashflow
- —
- DSCR
- —
- Eligible?
- —
Personal DTI + credit; lowest rate.
DSCR
20% down · 8.5% · 30yr
- Down + closing
- —
- Monthly P&I
- —
- Monthly cashflow
- —
- DSCR
- —
- Eligible?
- —
No personal income docs; deal must DSCR.
Hard money
10% down · 12.0% · 12mo
- Down + closing
- —
- Monthly P&I
- —
- Monthly cashflow
- —
- DSCR
- —
- Eligible?
- —
Short-term bridge; refi at stabilization.
Rent comps 1 comps
| Address | Beds | Baths | Sqft | Rent | $/sqft | DOM | Units | Dist |
|---|---|---|---|---|---|---|---|---|
| 207 Martin St Greenwood, MS | 2.0 | 1.0 | 950 | $700 | $0.74 | 45d | 1 | 0.69mi |
Listing history 5 events
-
2026-05-08historical
-
2026-05-07$40,000 Active
-
2026-05-06status Pending
-
2026-05-06$40,000 Active
-
1967-12-12soldstatus
ⓘ Source: listings_history table (triggers on properties + properties_extension) + one-shot
backfill from property_details.listing_events for pre-trigger history.
Tax reassessment forecast MS · Resets to sale price
- Current annual tax
- $1,803 · $150/mo
- Projected year-2 tax
- $1,803 · $150/mo
- Expected delta
- $0/yr ($0/mo · 0.0%)
ⓘ Screening estimate from a state-policy table — verify with the county assessor before closing.
Climate risk First Street
- Flood 1/10 Low FEMA zone X · 0% chance over 30 yrs
- Wildfire 1/10 Low
- Heat 7/10 Severe 7 d/yr ≥110°F today · 21 d/yr by 30 yrs out
- Wind 6/10 Major 27% chance of damaging wind over 30 yrs
- Air quality 1/10 Low 0 unhealthy d/yr today · 0 by 30 yrs out
Nearby sold comps map
Loading sold comps map…
Walkable amenities ~0.75 mi
Loading nearby amenities…
Taxation est. · year 1
- Rental income
- $8,400
- − Mortgage interest
- −$2,241
- − Property taxes
- −$1,803
- − Insurance
- −$200
- − Repairs & maintenance
- −$672
- − Management
- −$672
- − Depreciation
- −$1,164
- Taxable income
- $1,649
- Est. tax owed @ 24.0%
- −$396
- After-tax cash flow
- $1,720/yr
For passive investors: Depreciation is non-cash, so a rental often shows a tax loss while cash-flowing — sheltering income. Rental losses are passive: they offset passive income freely, and up to $25,000/yr can offset ordinary (W-2) income if you actively participate and your MAGI is under $100k (phasing out to $0 by $150k); unused losses carry forward. On sale, claimed depreciation is recaptured at up to 25%, and gains may owe capital-gains tax (a 1031 exchange can defer both). Figures are a year-1 estimate at your 24.0% rate — not tax advice; consult a CPA.
Schools (NCES district)
No district data.
Livability — Greenwood
- Score
- 71/100
- State rank
- #31
- US rank
- #6625
Category grades
Schools grade is shown separately in the Schools card above.
Census & demographics
- Census place
- Greenwood, MS
- Population (ZIP)
- 23,326
Population outlook (Leflore County) Hauer SSP2
- Today (2025)
- 27,008 people
- By 2030
- 25,362 · -6.1%
- By 2040
- 22,049 · -18.4%
- By 2050
- 19,188 · -29.0%
- By 2075
- 13,543 · -49.9%
- By 2100
- 8,913 · -67.0%
Race, ethnicity, and origin ACS 2023
- Neighborhood character
- Predominantly Black (70%)
- Race & ethnicity
- Black 70% White 25% Hispanic / Latino 3% Two or more races 1%
- Common ancestry
- Slovak 1% Serbian 1%
- Foreign-born
- 2% · Canada, Jamaica
- Languages at home
- 97% English-only · Spanish 2%
Political lean MEDSL · Leflore
- 2024 margin
- Solid D (+38.5) · D 68.7% · R 30.3%
- 2008→2024 swing
- +1.7pp toward D · 2008: 36.8pp · 2024: 38.5pp
- All cycles
- 2024: D+38.5 2020: D+41.5 2016: D+41.0 2012: D+45.8 2008: D+36.8
Not yet ingested
- Civics
- —
Market trends
- HPI YoY
- ▼ -34.32%
- Current HPI
- 150.2668
- Rent YoY
- —
- Metro
- —
- State GDP YoY
- —
- F500 in state
- 0
Price history
+0.0% since first listed5 events — show timeline
- 2026-05-08 Listing Removed — MLSU
- 2026-05-07 Listed $40,000 MLSU
- 2026-05-06 Pending — MLSU
- 2026-05-06 Listed $40,000 MLSU
- 1967-12-12 Sold (Public Records) — Public Records
Property tax history
+2.9%/yrLatest (2025): $1,803 · +22.0% YoY. Source: county tax records.
Cash-flow waterfall
monthlySold comps — $/sqft
last 12 mo · ≤1 miLoading sold comps…