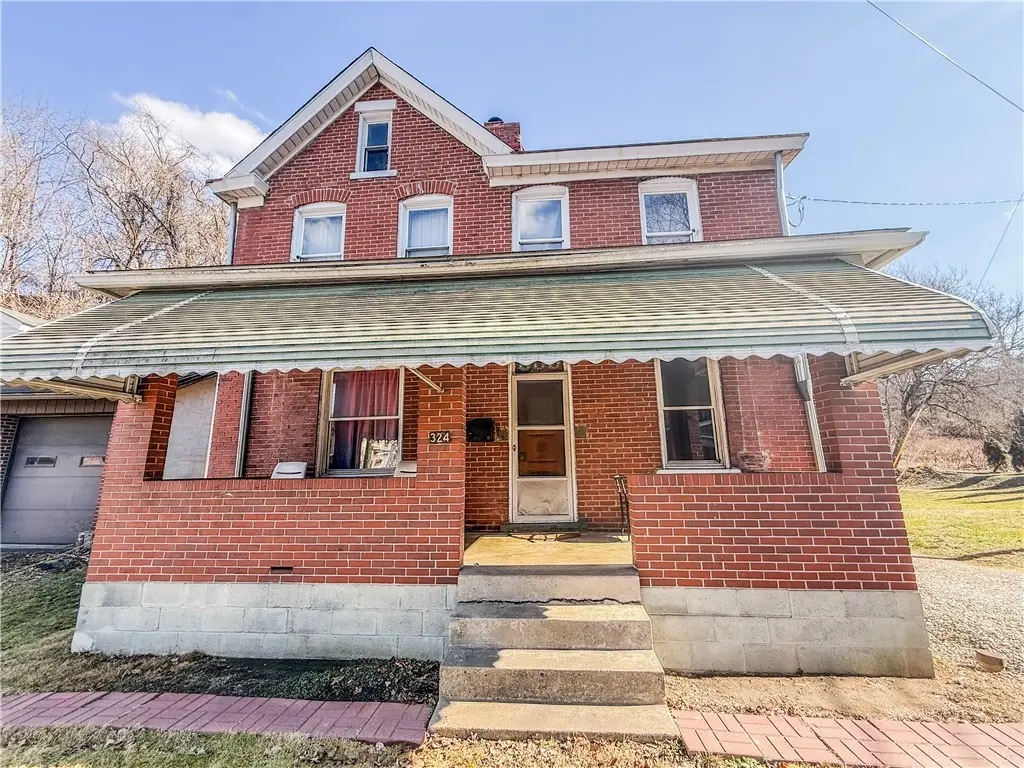
324 Center Ave · Elizabeth, PA
Flood risk 10/10 · Severe
- FEMA flood zone
- X (shaded)
- Chance of flooding over 30 yrs
- 0.99%
- Est. flood insurance / yr
- $473 – $860
Fire risk 1/10 · Minimal
- Est. fire insurance / yr
- $511 – $949
Heat risk 4/10 · Minor
- Hot days now (above 97°F)
- 7 days/yr
- Hot days in 30 yrs
- 20 days/yr
Wind risk 2/10 · Minimal
- Chance of severe wind over 30 yrs
- —
Air-quality risk 5/10 · Moderate
- Unhealthy air days now
- 8 days/yr
- Unhealthy air days in 30 yrs
- 8 days/yr
Risk factors via First Street. Map © Google.
Why this score? — see what drove the B- grade
The composite is a weighted blend of 9 inputs, each scored 0–100. Each bar is that input's sub-score; the figure is the points it added to the 100-point composite (weight × sub-score).
- Cash flow +30.0/30.0
- DSCR +10.0/10.0
- 1% rule +9.4/10.0
- ARV discount +7.5/15.0
- Schools +4.5/10.0
- Livability +3.5/5.0
- Rent growth +2.5/5.0
- Condition / age +2.5/5.0
- Appreciation +0.0/10.0
$75,000
🖨 Deal sheet 📄 Offer letter ✓ Due diligence
Listing remarks MLS
Investment opportunity in Elizabeth. This 3-bedroom, 1 full bath home includes two parcels. The additional parcel creates multiple added possibilities for investors, landlords, or renovation-focused buyers. The property features a fenced-in yard, updated bathroom, newer furnace, and central A/C. Added bonus included is an electric car charging device. Convenient location near Route 43 and Route 51 with easy access to surrounding communities, major roadways, downtown Elizabeth, and restaurants. Strong potential for rental income, resale strategy, or portfolio expansion.
Key facts
- Newer furnace
- Central a/c
- Convenient location
Tags
Neighborhood map
What this means for you Summary
Snapshot
- This is a 3-bed/1.0-bath single-family listed at $75k.
Deal economics
- At list price, monthly cash flow is $240 ($3k/yr) — positive.
- The deal already cash-flows at list — no discount required.
- Meets the 1% rule at list price ($1k rent vs $75k).
- Recommended offer: $68k (9.0% below list) — sets the bar for market timing.
- Cap rate 11.0% vs local median 2.9% in Elizabeth — top-decile yield for the area; either an underpriced asset or a hidden risk that comps aren't pricing in. Stress-test before assuming the spread holds.
Location & tenants
- Location reads 69/100 on livability (#818 in PA) — a middle-class / working-renter tenant base. Strengths: crime A+, cost of living A+, housing B+; Watch: amenities F, commute F, employment D-.
- Elizabeth Forward SD (suburban): math 41% / reading 65% proficiency, ranked #136 of 539 in PA (top 25%) — acceptable for families but not a draw, mixed tenant base, ~2y average lease.
- Market conditions: 29 active listings in the ZIP; 13 comparable units currently listed for rent nearby; rentals lingering (median 44d on market — plan ~5-8 weeks vacancy on turnover, expect pricing pressure); 62% of comp listings sitting > 30 days — soft ceiling on asking rent; 2,996 units permitted in Allegheny County in 2024 (1,588 in 5+ unit buildings).
Forward outlook
- Local home prices are declining (-3.0%/yr); year-one equity from $519 of loan paydown is wiped out by about $2k of value loss. Plan a longer hold.
- At projected returns (-3.0% appreciation + 3.0% rent growth), your $21k cash investment doubles in ~9 years — after that, you're playing with house money.
Negotiation context
- It's been on market 106 days — a 9% lower offer ($68k) is reasonable based on typical stale-listing flexibility.
- 2 sale attempts since 7y ago with the ask held roughly flat each time — persistent listings suggest the price (not the market) is what's stuck; bring a comps-based counter.
- Current owner paid $40k; list at $75k implies a 85% gain — meaningful room to come down on a strong offer.
Risks & watch-outs
- Watch-outs: flood insurance adds $56/mo; built in 1910 — expect roof / HVAC / electrical / plumbing capex.
- Climate carrying-cost: severe flood risk — expect insurance premiums to compound above CPI over the hold.
Questions for the listing agent
- It's been on market 106 days. Have you received any prior offers? Is the seller open to a 9% concession, seller financing, or rate buy-down credit?
- Built in 1910 — when were the roof, HVAC, electrical panel, plumbing, and water heater last replaced?
- What's the actual annual flood-insurance premium (NFIP or private), and is the property in a SFHA with mandatory coverage?
- Why hasn't it sold? Are there any deal-killer items the seller is aware of (foundation, flood, title, zoning, code violations)?
- Is there a deadline driving the sale (1031 exchange, divorce, estate, relocation)? That informs how much negotiation room exists.
- Schools are B-rated — typically a magnet for longer-tenancy family renters. What's the average tenant stay here, and is there a school-zone premium baked into asking?
- What's the average days-on-market for RENTAL listings here right now (not sales)? A rising rental-DOM trend means longer vacancies and softer asking-rent achievability than the comps imply.
- What's the recent tenant-quality profile in this submarket — average credit score on applications, eviction rate, late-payment / NSF rate, and stable-employment percentage? A property-management company in the area should have these aggregated.
- How much new for-sale + rental construction is in the pipeline within 1–3 miles? Heavy new supply typically softens prices + rents 12–24 months out; constrained supply supports both.
Investment metrics
- 1% rule
- 1.44% ✓
- Cap rate
- 11.03%
- Cash-on-cash
- 16.91%
- DSCR
- 1.75
- GRM
- 5.8
CMA / ARV
- ARV (median comp)
- $159,120
- List price
- $75,000
- Delta
- -52.87%
- Verdict
- UNDERPRICED
- Comps
- 20 within 1.0 mi
Show comp detail 12 sales within ~0.75 mi
| Address | Dist | Beds/Ba | Sqft | Sold | Price | $/sf | Match |
|---|---|---|---|---|---|---|---|
| 709 12th St | 0.27mi | 3/1.0 | 1,334 (-9%) | 6mo | $90,404 | $68 | 67 |
| 923 7th Ave | 0.20mi | 3/1.5 | 1,300 (-11%) | 9mo | $38,000 | $29 | 63 |
| 723 9th Ave | 0.18mi | 3/1.0 | 1,554 (+6%) | 22mo | $185,000 | $119 | 62 |
| 302 1st St | 0.46mi | 3/1.0 | 1,460 (0%) | 22mo | $28,505 | $20 | 61 |
| 118 7th Ave | 0.18mi | 3/2.5 | 1,280 (-12%) | 6mo | $106,500 | $83 | 60 |
| 306 Chicago Ave | 0.66mi | 2/1.0 (-1) | 1,360 (-7%) | 4mo | $97,500 | $72 | 50 |
| 742 Bunola River Rd | 0.54mi | 3/2.5 | 1,425 (-2%) | 20mo | $325,000 | $228 | 48 |
| 503 Elmview Dr | 0.50mi | 3/2.0 | 1,252 (-14%) | 2mo | $260,000 | $208 | 47 |
| 5124 Dorris Dr | 0.68mi | 3/1.0 | 1,276 (-13%) | 5mo | $85,000 | $67 | 43 |
| 407 Rothey Dr | 0.49mi | 4/1.0 (+1) | 1,300 (-11%) | 17mo | $70,000 | $54 | 40 |
| 101 Church St | 0.59mi | 4/1.0 (+1) | 1,264 (-13%) | 10mo | $60,000 | $47 | 37 |
| 304 Wylie Ave | 0.70mi | 4/2.0 (+1) | 1,578 (+8%) | 11mo | $225,000 | $143 | 36 |
Match score weights: distance 35% · size 25% · config 20% · recency 20%. Top-matched comps best support the ARV.
Projected returns pro-forma
-3.0% appreciation · 3.0% rent growth · sell at horizon
- IRR
- 4.0%
- Equity multiple
- 1.15×
- Total profit
- $3,232
- Equity at exit
- $11,183
- IRR
- 13.6%
- Equity multiple
- 2.09×
- Total profit
- $22,836
- Equity at exit
- $6,485
Cash invested: $21,000 (down + closing). Projections, not guarantees.
Landlord ↔ Tenant lean methodology
- Overall (STATE)
- 62 Landlord-Friendly
- State Pennsylvania
- 62 Landlord-Friendly · EVEN
- County
- — inherits STATE
- City
- — inherits STATE
ZIP-level market 15037
- Home prices YoY
- -11.8%
- Active inventory
- 29
- Price-to-rent
- 5.8×
Monthly cashflow live
- Estimated rent
- $1,083 high interval (Pro) →
- Mortgage (P&I)
- −$393
- Tax from tax record
- −$135 /mo · $1,617/yr
- Insurance
- −$31
- Flood insurance flood zone
- −$56 /mo · $666/yr
- HOA
- −$0
- Vacancy / Maint / Mgmt
- −$227
- Net cashflow
- $240
Break-even live
UW: 25.0% down · 7.5% · 30yr · 1.5% tax · 5.0% vac · 8.0% maint · 8.0% mgmt
Financing live
Cash to close
- Down payment
- $18,750
- Closing costs
- $2,250
- Reserves months
- —
- Total cash needed
- —
Loan-product check · same deal, 3 products live
Conventional
25% down · 7.5% · 30yr
- Down + closing
- —
- Monthly P&I
- —
- Monthly cashflow
- —
- DSCR
- —
- Eligible?
- —
Personal DTI + credit; lowest rate.
DSCR
20% down · 8.5% · 30yr
- Down + closing
- —
- Monthly P&I
- —
- Monthly cashflow
- —
- DSCR
- —
- Eligible?
- —
No personal income docs; deal must DSCR.
Hard money
10% down · 12.0% · 12mo
- Down + closing
- —
- Monthly P&I
- —
- Monthly cashflow
- —
- DSCR
- —
- Eligible?
- —
Short-term bridge; refi at stabilization.
Rent comps 13 comps
| Address | Beds | Baths | Sqft | Rent | $/sqft | DOM | Units | Dist |
|---|---|---|---|---|---|---|---|---|
| 513 S 2nd Ave Elizabeth, PA | 3.0 | 1.5 | 1625 | $1,195 | $0.74 | 1d | 1 | 0.10mi |
| 168 Center Ave Unit 1 left) Elizabeth, PA | 2.0 | 1.0 | 950 | $895 | $0.94 | 23d | 1 | 0.11mi |
| 618 Farnsworth Ave Clairton, PA | 2.0 | 1.0 | 896 | $1,050 | $1.17 | 43d | 1 | 1.05mi |
| 601 Farnsworth Ave Clairton, PA | 2.0 | 1.0 | 1004 | $995 | $0.99 | 4d | 1 | 1.08mi |
| 874 Vankirk St Clairton, PA | 3.0 | 1.5 | 1296 | $1,150 | $0.89 | 43d | 1 | 1.15mi |
| 866 Vankirk St Unit 1 Clairton, PA | 2.0 | 1.5 | 1440 | $1,200 | $0.83 | 43d | 1 | 1.17mi |
| 127 Constitution Cir Clairton, PA | 2.0 | 1.0 | 1063 | $1,275 | $1.20 | 10d | 1 | 1.29mi |
| 127 Constitution Cir Clairton, PA | 2.0 | 1.0 | 972 | $1,275 | $1.31 | 1d | 1 | 1.29mi |
| 753 East Dr Clairton, PA | 3.0 | 1.0 | 1000 | $1,100 | $1.10 | 43d | 1 | 1.33mi |
| 809 3rd St Unit 624 Clairton, PA | 2.0 | 1.5 | 1240 | $1,008 | $0.81 | 43d | 1 | 1.36mi |
| 809 3rd St Unit 194 Clairton, PA | 2.0 | 1.5 | 1244 | $1,081 | $0.87 | 43d | 1 | 1.36mi |
| 2140 Lincoln Blvd Elizabeth, PA | 2.0 | 1.0 | 968 | $790 | $0.82 | 43d | 1 | 1.41mi |
| 350 Wylie Ave Unit 1 Clairton, PA | 2.0 | 1.0 | 1152 | $1,050 | $0.91 | 43d | 1 | 1.46mi |
Listing history 18 events
-
2026-06-18days on market $75,000 Active 106 DOM
-
2026-06-17days on market $75,000 Active 105 DOM
-
2026-06-16days on market $75,000 Active 104 DOM
-
2026-06-15days on market $75,000 Active 103 DOM
-
2026-06-13days on market $75,000 Active 101 DOM
-
2026-06-09days on market $75,000 Active 97 DOM
-
2026-06-08days on market $75,000 Active 96 DOM
-
2026-06-07days on market $75,000 Active 95 DOM
-
2026-06-05days on market $75,000 Active 92 DOM
-
2026-06-03days on market $75,000 Active 91 DOM
-
2026-06-02days on market $75,000 Active 90 DOM
-
2026-06-01days on market $75,000 Active 89 DOM
-
2026-05-31days on market $75,000 Active 88 DOM
-
2026-03-04$75,000 Active 575-char remark
Show marketing remark (575 chars)
Investment opportunity in Elizabeth. This 3-bedroom, 1 full bath home includes two parcels. The additional parcel creates multiple added possibilities for investors, landlords, or renovation-focused buyers. The property features a fenced-in yard, updated bathroom, newer furnace, and central A/C. Added bonus included is an electric car charging device. Convenient location near Route 43 and Route 51 with easy access to surrounding communities, major roadways, downtown Elizabeth, and restaurants. Strong potential for rental income, resale strategy, or portfolio expansion.
-
2020-01-02historical Withdrawn 406-char remark
Show marketing remark (406 chars)
* * * UPDATE * * * The sellers have put in a new hot water heater, new gutters and down spouts. This large brick home sits on a double lot with an additional lot, all nice size, part of the yard is fully fenced in and located in Elizabeth forward school district. Home is in need of some updates and repairs which will give you the opportunity to fix it up the way you like. HOME IS BEING SOLD AS IS.
-
2019-07-08$45,000 Active 406-char remark
Show marketing remark (406 chars)
* * * UPDATE * * * The sellers have put in a new hot water heater, new gutters and down spouts. This large brick home sits on a double lot with an additional lot, all nice size, part of the yard is fully fenced in and located in Elizabeth forward school district. Home is in need of some updates and repairs which will give you the opportunity to fix it up the way you like. HOME IS BEING SOLD AS IS.
-
2000-07-12soldstatus $40,500
-
1988-12-14soldstatus $25,000
ⓘ Source: listings_history table (triggers on properties + properties_extension) + one-shot
backfill from property_details.listing_events for pre-trigger history.
Tax reassessment forecast PA · Partial reset (capped growth)
- Current annual tax
- $1,617 · $135/mo
- Projected year-2 tax
- $1,617 · $135/mo
- Expected delta
- $0/yr ($0/mo · 0.0%)
ⓘ Screening estimate from a state-policy table — verify with the county assessor before closing.
Climate risk First Street
- Flood 10/10 Extreme FEMA zone X (shaded) · 99% chance over 30 yrs
- Wildfire 1/10 Low
- Heat 4/10 Moderate 7 d/yr ≥97°F today · 20 d/yr by 30 yrs out
- Wind 2/10 Low
- Air quality 5/10 Major 8 unhealthy d/yr today · 8 by 30 yrs out
Nearby sold comps map
Loading sold comps map…
Walkable amenities ~0.75 mi
Loading nearby amenities…
Taxation est. · year 1
- Rental income
- $12,990
- − Mortgage interest
- −$4,201
- − Property taxes
- −$1,617
- − Insurance
- −$1,042
- − Repairs & maintenance
- −$1,039
- − Management
- −$1,039
- − Depreciation
- −$2,182
- Taxable income
- $1,871
- Est. tax owed @ 24.0%
- −$449
- After-tax cash flow
- $2,436/yr
For passive investors: Depreciation is non-cash, so a rental often shows a tax loss while cash-flowing — sheltering income. Rental losses are passive: they offset passive income freely, and up to $25,000/yr can offset ordinary (W-2) income if you actively participate and your MAGI is under $100k (phasing out to $0 by $150k); unused losses carry forward. On sale, claimed depreciation is recaptured at up to 25%, and gains may owe capital-gains tax (a 1031 exchange can defer both). Figures are a year-1 estimate at your 24.0% rate — not tax advice; consult a CPA.
Schools (NCES district)
- District
- Elizabeth Forward SD
- NCES district ID
- 4209090
- Math proficiency
- 41% ▼ -16.00%
- Reading proficiency
- 65% ▼ -8.00%
- Median HH income
- $53,344
- Composite
- 45.5/100
- National rank
- #2611
- State rank
- #136 of 539 in PA
Livability — Elizabeth
- Score
- 69/100
- State rank
- #818
- US rank
- #8377
Category grades
Schools grade is shown separately in the Schools card above.
Census & demographics
- Census place
- Elizabeth, PA
- Population (ZIP)
- 10,412
Population outlook (Allegheny County) Hauer SSP2
- Today (2025)
- 1,250,282 people
- By 2030
- 1,256,482 · +0.5%
- By 2040
- 1,256,318 · +0.5%
- By 2050
- 1,244,169 · -0.5%
- By 2075
- 1,197,693 · -4.2%
- By 2100
- 1,093,187 · -12.6%
Race, ethnicity, and origin ACS 2023
- Neighborhood character
- Predominantly White (91%)
- Race & ethnicity
- White 91% Two or more races 4% Hispanic / Latino 4% Asian 2%
- Common ancestry
- Romanian 10% Slovak 6% Serbian 1%
- Foreign-born
- 2% · Canada, India
- Languages at home
- 96% English-only · Other Indo-European 2% Spanish 1%
Political lean MEDSL · Allegheny
- 2024 margin
- Strong D (+20.3) · D 59.7% · R 39.4%
- 2008→2024 swing
- +4.8pp toward D · 2008: 15.5pp · 2024: 20.3pp
- All cycles
- 2024: D+20.3 2020: D+20.4 2016: D+16.4 2012: D+14.4 2008: D+15.5
Not yet ingested
- Civics
- —
Market trends
- HPI YoY
- ▼ -35.61%
- Current HPI
- 266.2418
- Rent YoY
- —
- Metro
- —
- State GDP YoY
- ▲ 1.68%
- F500 in state
- 34
Industry mix (Fortune 500 HQ in PA)
| Industry | F500 HQs | Revenue |
|---|---|---|
| Healthcare | 2 | $309B |
|
||
| Insurance | 2 | $27B |
|
||
| Telecommunications / Media | 1 | $124B |
|
||
| Industrial Distribution | 1 | $22B |
|
||
| Financial Services | 1 | $20B |
|
||
| Chemicals / Materials | 1 | $18B |
|
||
Price history
+200.0% since first listed5 events — show timeline
- 2026-03-04 Listed $75,000 West Penn MLS
- 2020-01-02 Delisted — West Penn MLS
- 2019-07-08 Listed $45,000 West Penn MLS
- 2000-07-12 Sold (Public Records) $40,500 Public Records
- 1988-12-14 Sold (Public Records) $25,000 Public Records
Property tax history
+1.7%/yrLatest (2026): $1,617 · +3.5% YoY. Source: county tax records.
Cash-flow waterfall
monthlySold comps — $/sqft
last 12 mo · ≤1 miLoading sold comps…