1002 Dodge St · Stephenville, TX
Flood risk 1/10 · Minimal
- FEMA flood zone
- X (unshaded)
- Chance of flooding over 30 yrs
- 0.0%
- Est. flood insurance / yr
- $507 – $1,088
Fire risk 7/10 · Major
- Est. fire insurance / yr
- $1,222 – $2,270
Heat risk 6/10 · Moderate
- Hot days now (above 105°F)
- 7 days/yr
- Hot days in 30 yrs
- 22 days/yr
Wind risk 6/10 · Moderate
- Chance of severe wind over 30 yrs
- 27.0%
Air-quality risk 1/10 · Minimal
- Unhealthy air days now
- 0 days/yr
- Unhealthy air days in 30 yrs
- 0 days/yr
Risk factors via First Street. Map © Google.
Why this score? — see what drove the C grade
The composite is a weighted blend of 9 inputs, each scored 0–100. Each bar is that input's sub-score; the figure is the points it added to the 100-point composite (weight × sub-score).
- Cash flow +20.5/30.0
- ARV discount +11.5/15.0
- DSCR +6.5/10.0
- 1% rule +5.2/10.0
- Schools +4.2/10.0
- Livability +3.8/5.0
- Rent growth +2.5/5.0
- Condition / age +2.5/5.0
- Appreciation +0.0/10.0
$140,000
🖨 Deal sheet 📄 Offer letter ✓ Due diligence
Listing remarks MLS
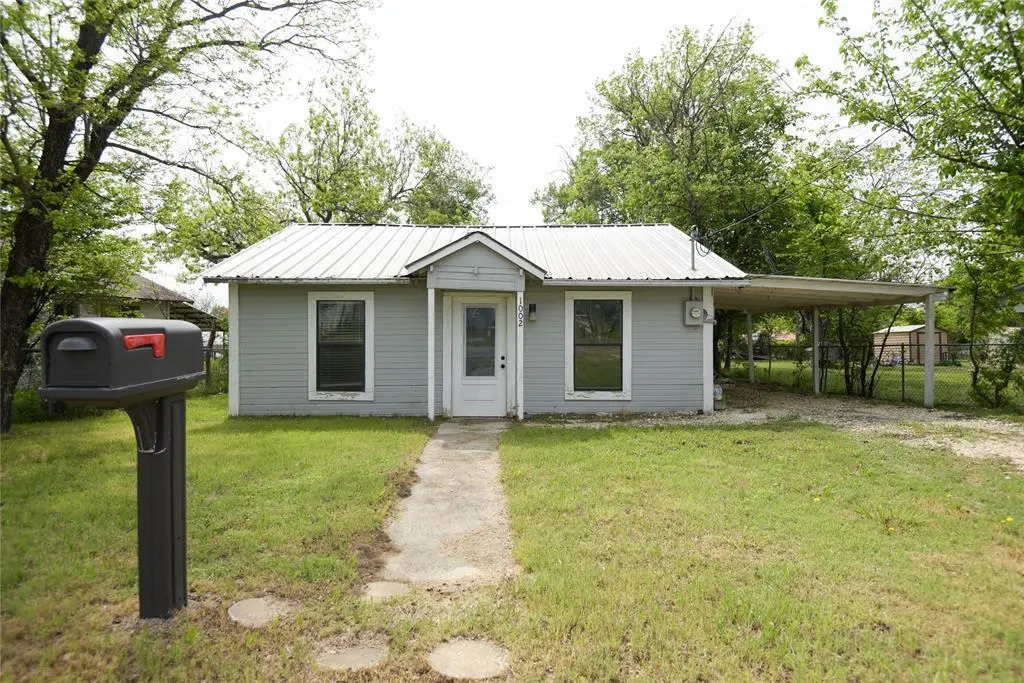
Located near Tarleton State University, this 2-bedroom, 2-bath home offers strong potential for rental or value-add opportunity. Built in 1945, the property includes approximately 1,030 square feet of living space on a 7,492 square foot lot. The home features a functional layout, covered carport, and is situated in an established area with convenient access to shopping, dining, and campus amenities. Ideal for investors seeking a property with upside potential in a high-demand rental market. Property will be sold as is.
Key facts
- Covered carport
- Functional layout
- 7,492 sq ft lot
Tags
Neighborhood map
What this means for you Summary
Snapshot
- This is a 2-bed/2.0-bath single-family listed at $140k.
Deal economics
- At list price, monthly cash flow is $185 ($2k/yr) — positive.
- The deal already cash-flows at list — no discount required.
- Meets the 1% rule at list price ($1k rent vs $140k).
- Recommended offer: $132k (6.0% below list) — sets the bar for market timing.
- Cap rate 7.9% vs local median 2.1% in Stephenville — top-decile yield for the area; either an underpriced asset or a hidden risk that comps aren't pricing in. Stress-test before assuming the spread holds.
Location & tenants
- Location reads 75/100 on livability (#124 in TX, #3,840 nationally) — a middle-class / working-renter tenant base. Strengths: cost of living A+, housing A+, health & safety A+; Watch: schools C-, commute F, employment D-.
- Stephenville ISD (town): math 53% / reading 48% proficiency, ranked #191 of 826 in TX (top 23%) — acceptable for families but not a draw, mixed tenant base, ~2y average lease.
- Market conditions: Rents flat; 383 active listings in the ZIP; 9 comparable units currently listed for rent nearby; rentals lingering (median 44d on market — plan ~5-8 weeks vacancy on turnover, expect pricing pressure); 100% of comp listings sitting > 30 days — soft ceiling on asking rent; 110 units permitted in Erath County in 2024 (61 in 5+ unit buildings).
Forward outlook
- Local home prices are declining (-3.0%/yr); year-one equity from $968 of loan paydown is wiped out by about $4k of value loss. Plan a longer hold.
- Erath County population projected at +55% by 2050 — long-run rental-demand tailwind backs the buy-and-hold thesis.
Negotiation context
- It's been on market 70 days — a 6% lower offer ($132k) is reasonable based on typical stale-listing flexibility.
- 15 sale attempts since 20y ago with the ask held roughly flat each time — persistent listings suggest the price (not the market) is what's stuck; bring a comps-based counter.
Risks & watch-outs
- Watch-outs: built in 1945 — expect roof / HVAC / electrical / plumbing capex.
- Climate carrying-cost: major wind risk, 27% chance of damaging wind over 30y; major wildfire risk; extreme-heat days projected 7→22/yr by 2055 (HVAC capex compounding) — expect insurance premiums to compound above CPI over the hold.
Questions for the listing agent
- It's been on market 70 days. Have you received any prior offers? Is the seller open to a 6% concession, seller financing, or rate buy-down credit?
- Built in 1945 — when were the roof, HVAC, electrical panel, plumbing, and water heater last replaced?
- Why hasn't it sold? Are there any deal-killer items the seller is aware of (foundation, flood, title, zoning, code violations)?
- Is there a deadline driving the sale (1031 exchange, divorce, estate, relocation)? That informs how much negotiation room exists.
- What's the average days-on-market for RENTAL listings here right now (not sales)? A rising rental-DOM trend means longer vacancies and softer asking-rent achievability than the comps imply.
- What's the recent tenant-quality profile in this submarket — average credit score on applications, eviction rate, late-payment / NSF rate, and stable-employment percentage? A property-management company in the area should have these aggregated.
- How much new for-sale + rental construction is in the pipeline within 1–3 miles? Heavy new supply typically softens prices + rents 12–24 months out; constrained supply supports both.
Investment metrics
- 1% rule
- 1.02% ✓
- Cap rate
- 7.88%
- Cash-on-cash
- 5.67%
- DSCR
- 1.25
- GRM
- 8.1
CMA / ARV
- ARV (median comp)
- $153,767
- List price
- $140,000
- Delta
- -8.95%
- Verdict
- FAIR
- Comps
- 20 within 1.0 mi
Show comp detail 6 sales within ~0.75 mi
| Address | Dist | Beds/Ba | Sqft | Sold | Price | $/sf | Match |
|---|---|---|---|---|---|---|---|
| 500 East Rd | 0.16mi | 2/1.0 | 1,091 (+6%) | 21mo | $219,000 | $201 | 61 |
| 310 E Clifton St | 0.66mi | 2/2.0 | 1,000 (-3%) | 6mo | $249,000 | $249 | 60 |
| 1000 E Pearl St | 0.06mi | 2/1.0 | 898 (-13%) | 18mo | $150,000 | $167 | 57 |
| 609 E Clifton St | 0.54mi | 3/1.0 (+1) | 1,022 (-1%) | 14mo | $179,000 | $175 | 53 |
| 658 E Long | 0.37mi | 2/1.0 | 892 (-13%) | 20mo | $175,000 | $196 | 40 |
| 945 S Jackson St | 0.71mi | 2/1.0 | 884 (-14%) | 24mo | $189,500 | $214 | 20 |
Match score weights: distance 35% · size 25% · config 20% · recency 20%. Top-matched comps best support the ARV.
Projected returns pro-forma
-3.0% appreciation · 0.07% rent growth · sell at horizon
- IRR
- -10.8%
- Equity multiple
- 0.62×
- Total profit
- $-14,982
- Equity at exit
- $20,874
- IRR
- -6.2%
- Equity multiple
- 0.65×
- Total profit
- $-13,710
- Equity at exit
- $12,105
Cash invested: $39,200 (down + closing). Projections, not guarantees.
Landlord ↔ Tenant lean methodology
- Overall (STATE)
- 87 Strongly Landlord-Friendly
- State Texas
- 87 Strongly Landlord-Friendly · R+5
- County
- — inherits STATE
- City
- — inherits STATE
ZIP-level market 76401
- Rents YoY
- 0.1%
- Active inventory
- 383
- Price-to-rent
- 8.1×
Monthly cashflow live
- Estimated rent
- $1,435 high interval (Pro) →
- Mortgage (P&I)
- −$734
- Tax from tax record
- −$155 /mo · $1,866/yr
- Insurance
- −$58
- HOA
- −$0
- Vacancy / Maint / Mgmt
- −$301
- Net cashflow
- $185
Break-even live
UW: 25.0% down · 7.5% · 30yr · 1.5% tax · 5.0% vac · 8.0% maint · 8.0% mgmt
Financing live
Cash to close
- Down payment
- $35,000
- Closing costs
- $4,200
- Reserves months
- —
- Total cash needed
- —
Loan-product check · same deal, 3 products live
Conventional
25% down · 7.5% · 30yr
- Down + closing
- —
- Monthly P&I
- —
- Monthly cashflow
- —
- DSCR
- —
- Eligible?
- —
Personal DTI + credit; lowest rate.
DSCR
20% down · 8.5% · 30yr
- Down + closing
- —
- Monthly P&I
- —
- Monthly cashflow
- —
- DSCR
- —
- Eligible?
- —
No personal income docs; deal must DSCR.
Hard money
10% down · 12.0% · 12mo
- Down + closing
- —
- Monthly P&I
- —
- Monthly cashflow
- —
- DSCR
- —
- Eligible?
- —
Short-term bridge; refi at stabilization.
Rent comps 9 comps
| Address | Beds | Baths | Sqft | Rent | $/sqft | DOM | Units | Dist |
|---|---|---|---|---|---|---|---|---|
| 1000 E Lingleville Rd Stephenville, TX | 1.0–2.0 | 1.0–1.5 | 776 | $1,378 | $1.77 | 43d | 1 | 0.96mi |
| 1391 N Race Unit C Stephenville, TX | 2.0 | 2.0 | 800 | $1,000 | $1.25 | 43d | 1 | 1.16mi |
| 1026 W Tarleton St Apt 102 Stephenville, TX | 2.0 | 2.0 | 1000 | $1,500 | $1.50 | 43d | 1 | 1.24mi |
| 731 W Walnut St Stephenville, TX | 2.0 | 1.0 | 828 | $1,100 | $1.33 | 43d | 1 | 1.25mi |
| 791 N Clinton St Stephenville, TX | 2.0 | 1.5 | 1160 | $1,800 | $1.55 | 43d | 1 | 1.27mi |
| 504 S 1st Ave Unit 1 Stephenville, TX | 3.0 | 1.5 | 1100 | $1,250 | $1.14 | 43d | 1 | 1.41mi |
| 290 S McIlhaney St Unit 1102 Stephenville, TX | 3.0 | 3.0 | 1223 | $775 | $0.63 | 43d | 1 | 1.41mi |
| 561 S Second Ave Stephenville, TX | 3.0 | 3.0 | 1500 | $750 | $0.50 | 43d | 1 | 1.46mi |
| 1713 Bingham St Stephenville, TX | 3.0 | 1.0 | 1218 | $1,750 | $1.44 | 43d | 1 | 1.49mi |
Listing history 50 events
-
2026-06-19days on market $140,000 Active 70 DOM
-
2026-06-18days on market $140,000 Active 69 DOM
-
2026-06-17days on market $140,000 Active 68 DOM
-
2026-06-16days on market $140,000 Active 67 DOM
-
2026-06-15days on market $140,000 Active 66 DOM
-
2026-06-14pricedays on market $140,000 Active 64 DOM
-
2026-06-12days on market $145,000 Active 63 DOM
-
2026-06-09days on market $145,000 Active 60 DOM
-
2026-06-08days on market $145,000 Active 59 DOM
-
2026-06-07days on market $145,000 Active 58 DOM
-
2026-06-03days on market $145,000 Active 54 DOM
-
2026-06-02days on market $145,000 Active 53 DOM
-
2026-06-01days on market $145,000 Active 52 DOM
-
2026-05-31days on market $145,000 Active 51 DOM
-
2026-05-30days on market $145,000 Active 50 DOM
-
2026-04-08$145,000 Active 526-char remark
Show marketing remark (526 chars)
Located near Tarleton State University, this 2-bedroom, 2-bath home offers strong potential for rental or value-add opportunity. Built in 1945, the property includes approximately 1,030 square feet of living space on a 7,492 square foot lot. The home features a functional layout, covered carport, and is situated in an established area with convenient access to shopping, dining, and campus amenities. Ideal for investors seeking a property with upside potential in a high-demand rental market. Property will be sold as is.
-
2025-07-02$180,000 Active
-
2025-03-01historical
-
2024-09-23price $180,000
-
2024-08-13price $182,500
-
2024-05-28$190,000 Active
-
2023-06-08soldstatus
-
2019-07-02historical
-
2019-06-03status Active
-
2019-05-20historical Active Option Contract
-
2019-05-16status Active
-
2019-05-10historical Active Option Contract
-
2019-04-24$99,500 Active
-
2019-04-05historical Active Option Contract
-
2019-04-05historical
-
2019-03-13status Active
-
2019-03-09historical Active Option Contract
-
2019-03-04$99,500 Active
-
2018-06-03historical
-
2018-04-02$54,900 Active
-
2018-04-01historical
-
2018-02-20price $59,900
-
2017-12-08$69,900 Active
-
2017-11-30historical
-
2017-10-02price $69,900
-
2017-05-31$74,900 Active
-
2014-02-11historical
-
2013-01-08$45,000
-
2012-12-31historical
-
2012-04-02$50,000
-
2008-09-29soldstatus
-
2008-09-19historical
-
2008-08-29$29,900
-
2008-02-29soldstatus
-
2006-05-22soldstatus
ⓘ Source: listings_history table (triggers on properties + properties_extension) + one-shot
backfill from property_details.listing_events for pre-trigger history.
Tax reassessment forecast TX · Resets to sale price
- Current annual tax
- $1,866 · $155/mo
- Projected year-2 tax
- $2,562 · $214/mo
- Expected delta
- +$696/yr (+$58/mo · 37.3%)
ⓘ Screening estimate from a state-policy table — verify with the county assessor before closing.
Climate risk First Street
- Flood 1/10 Low FEMA zone X (unshaded) · 0% chance over 30 yrs
- Wildfire 7/10 Severe
- Heat 6/10 Major 7 d/yr ≥105°F today · 22 d/yr by 30 yrs out
- Wind 6/10 Major 27% chance of damaging wind over 30 yrs
- Air quality 1/10 Low 0 unhealthy d/yr today · 0 by 30 yrs out
Nearby sold comps map
Loading sold comps map…
Walkable amenities ~0.75 mi
Loading nearby amenities…
Taxation est. · year 1
- Rental income
- $17,215
- − Mortgage interest
- −$7,842
- − Property taxes
- −$1,866
- − Insurance
- −$700
- − Repairs & maintenance
- −$1,377
- − Management
- −$1,377
- − Depreciation
- −$4,073
- Taxable loss
- −$20
- Est. tax savings @ 24.0%
- +$5
- After-tax cash flow
- $2,229/yr
For passive investors: Depreciation is non-cash, so a rental often shows a tax loss while cash-flowing — sheltering income. Rental losses are passive: they offset passive income freely, and up to $25,000/yr can offset ordinary (W-2) income if you actively participate and your MAGI is under $100k (phasing out to $0 by $150k); unused losses carry forward. On sale, claimed depreciation is recaptured at up to 25%, and gains may owe capital-gains tax (a 1031 exchange can defer both). Figures are a year-1 estimate at your 24.0% rate — not tax advice; consult a CPA.
Schools (NCES district)
- District
- Stephenville ISD
- NCES district ID
- 4841520
- Math proficiency
- 53% ▼ -1.00%
- Reading proficiency
- 48% ▼ -4.00%
- Median HH income
- $39,565
- Composite
- 42.23/100
- National rank
- #3283
- State rank
- #191 of 826 in TX
Livability — Stephenville
- Score
- 75/100
- State rank
- #124
- US rank
- #3840
Category grades
Schools grade is shown separately in the Schools card above.
Census & demographics
- Census place
- Stephenville, TX
- County
- Erath County · 31,375 people
- City population
- 31,375
- Metro
- Stephenville, TX
- Population (ZIP)
- 31,375
- Household income
- $61,210
- Rent vs Own
- Severe rent burden
- 1758.0
Population outlook (Erath County) Hauer SSP2
- Today (2025)
- 50,437 people
- By 2030
- 55,510 · +10.1%
- By 2040
- 66,379 · +31.6%
- By 2050
- 77,981 · +54.6%
- By 2075
- 109,727 · +117.6%
- By 2100
- 132,574 · +162.9%
Race, ethnicity, and origin ACS 2023
- Neighborhood character
- Predominantly White (76%)
- Race & ethnicity
- White 76% Hispanic / Latino 18% Two or more races 8% Black 2% Asian 1%
- Hispanic origin (detail)
- Mexican 15%
- Common ancestry
- Slovak 2% Italian 1% Serbian 1%
- Foreign-born
- 5% · Canada, China
- Languages at home
- 88% English-only · Spanish 10% Chinese 1%
Political lean MEDSL · Erath
- 2024 margin
- Solid R (+68.0) · D 15.7% · R 83.7%
- 2008→2024 swing
- -13.5pp toward R · 2008: -54.5pp · 2024: -68.0pp
- All cycles
- 2024: R+68.0 2020: R+63.9 2016: R+65.5 2012: R+67.1 2008: R+54.5
Not yet ingested
- Civics
- —
Market trends
- HPI YoY
- ▼ -133.71%
- Current HPI
- 234.4986
- Rent YoY
- ▲ 0.07%
- Metro
- Stephenville, TX
- State GDP YoY
- ▲ 3.95%
- F500 in state
- 110
Industry mix (Fortune 500 HQ in TX)
| Industry | F500 HQs | Revenue |
|---|---|---|
| Energy | 16 | $1,198B |
|
||
| Technology | 5 | $198B |
|
||
| Engineering / Construction | 4 | $72B |
|
||
| Energy Services | 3 | $60B |
|
||
| Utilities | 3 | $41B |
|
||
| Healthcare | 2 | $330B |
|
||
Price history
+238.0% since first listed39 events — show timeline
- 2026-04-08 Listed $145,000 NTREIS
- 2025-07-02 Listed $180,000 NTREIS
- 2025-03-01 Listing Removed — NTREIS
- 2024-09-23 Price Changed $180,000 NTREIS
- 2024-08-13 Price Changed $182,500 NTREIS
- 2024-05-28 Listed $190,000 NTREIS
- 2023-06-08 Sold (Public Records) — Public Records
- 2019-07-02 Listing Removed — NTREIS
- 2019-06-03 Relisted — NTREIS
- 2019-05-20 Contingent — NTREIS
- 2019-05-16 Relisted — NTREIS
- 2019-05-10 Contingent — NTREIS
- 2019-04-24 Listed $99,500 NTREIS
- 2019-04-05 Contingent — NTREIS
- 2019-04-05 Listing Removed — NTREIS
- 2019-03-13 Relisted — NTREIS
- 2019-03-09 Contingent — NTREIS
- 2019-03-04 Listed $99,500 NTREIS
- 2018-06-03 Listing Removed — NTREIS
- 2018-04-02 Listed $54,900 NTREIS
- 2018-04-01 Listing Removed — NTREIS
- 2018-02-20 Price Changed $59,900 NTREIS
- 2017-12-08 Listed $69,900 NTREIS
- 2017-11-30 Listing Removed — NTREIS
- 2017-10-02 Price Changed $69,900 NTREIS
- 2017-05-31 Listed $74,900 NTREIS
- 2014-02-11 Listing Removed — NTREIS
- 2013-01-08 Listed $45,000 NTREIS
- 2012-12-31 Listing Removed — NTREIS
- 2012-04-02 Listed $50,000 NTREIS
- 2008-09-29 Sold (MLS) — NTREIS
- 2008-09-19 Listing Removed — NTREIS
- 2008-08-29 Listed $29,900 NTREIS
- 2008-02-29 Sold (Public Records) — Public Records
- 2006-05-22 Sold (MLS) — NTREIS
- 2006-05-19 Sold (Public Records) — Public Records
- 2006-04-28 Listing Removed — NTREIS
- 2006-03-29 Listed $42,900 NTREIS
- 1989-06-03 Sold (Public Records) — Public Records
Property tax history
+8.3%/yrLatest (2025): $1,866 · -3.8% YoY. Source: county tax records.
Cash-flow waterfall
monthlySold comps — $/sqft
last 12 mo · ≤1 miLoading sold comps…