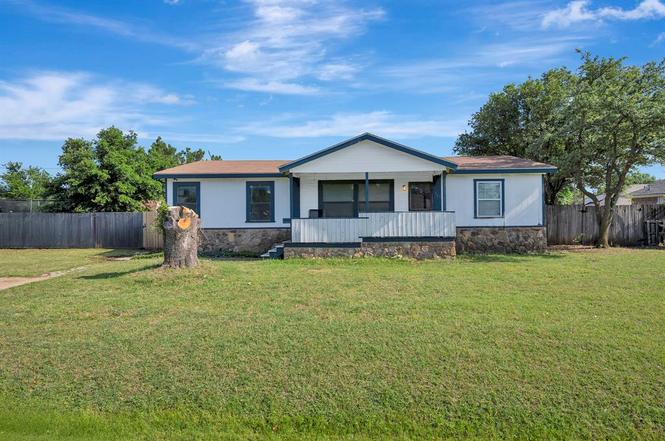
305 Branson Rd · Roanoke, TX
Flood risk 1/10 · Minimal
- FEMA flood zone
- X (unshaded)
- Chance of flooding over 30 yrs
- 0.0%
- Est. flood insurance / yr
- $507 – $1,088
Fire risk 4/10 · Minor
- Est. fire insurance / yr
- $1,222 – $2,270
Heat risk 7/10 · Major
- Hot days now (above 109°F)
- 7 days/yr
- Hot days in 30 yrs
- 23 days/yr
Wind risk 4/10 · Minor
- Chance of severe wind over 30 yrs
- 24.0%
Air-quality risk 3/10 · Minor
- Unhealthy air days now
- 3 days/yr
- Unhealthy air days in 30 yrs
- 4 days/yr
Risk factors via First Street. Map © Google.
Why this score? — see what drove the C+ grade
The composite is a weighted blend of 9 inputs, each scored 0–100. Each bar is that input's sub-score; the figure is the points it added to the 100-point composite (weight × sub-score).
- Cash flow +23.2/30.0
- ARV discount +15.0/15.0
- DSCR +7.5/10.0
- 1% rule +5.2/10.0
- Schools +4.6/10.0
- Livability +4.0/5.0
- Rent growth +2.6/5.0
- Condition / age +2.5/5.0
- Appreciation +0.0/10.0
$235,000
🖨 Deal sheet 📄 Offer letter ✓ Due diligence
Listing remarks
Come build in Roanoke! Almost a quarter acre in Country Acres Estates neighborhood. Fantastic location that attends great schools: Beck Elementary, Medlin Middle School, and Byron Nelson High School. Super close to Wal-Mart, Home Depot, and Roanoke Dining and Entertainment. Transitioning neighborhood - great investor opportunity. Mobile home on property could be rented with some work, or demo and build right away! Limited lot opportunities in this growing area with Charles Schwab, Fidelity, and soon to be built MP Materials 10X Campus.
Key facts
- Quarter acre
- Beck elementary
- Medlin middle school
Tags
Property features AI
Finance
- HOA & community: No association
Exterior
- Parking: Concrete parking area
- Utilities: City water; City sewer; Not in a municipal utility district
- Home design: Single family residence; One story; Residential property
- Construction: Built in 1989; Siding exterior; Composition roof; No listed foundation
- Exterior features: Covered patio/porch; Wood fencing; Interior lot; Will subdivide
Interior
- Kitchen: Dishwasher; Electric range; Eat-in kitchen with breakfast bar and built-in cabinets
- Bedrooms: 3 bedrooms (all on main level); Primary bedroom with ensuite bathroom (main level)
- Flooring: Carpet
- Bathrooms: 2 full bathrooms
- Heating & cooling: Central heating (electric); Central air conditioning (electric); Ceiling fans
- Interior features: Eat-in kitchen; Breakfast bar; Built-in cabinets; One living area; One dining area; 6 rooms total
- Laundry & utility: Washer hookup; Electric dryer hookup
Neighborhood map
What this means for you Summary
Snapshot
- This is a 3-bed/2.0-bath manufactured listed at $235k.
Deal economics
- At list price, monthly cash flow is $427 ($5k/yr) — positive.
- The deal already cash-flows at list — no discount required.
- Meets the 1% rule at list price ($2k rent vs $235k).
- Cap rate 8.5% vs local median 2.6% in Roanoke — top-decile yield for the area; either an underpriced asset or a hidden risk that comps aren't pricing in. Stress-test before assuming the spread holds.
Location & tenants
- Location reads 80/100 on livability (#40 in TX, #1,783 nationally) — a professional / high-income tenant draw. Strengths: employment A+, housing A+, crime A; Watch: cost of living C-, commute F.
- Northwest ISD (rural): math 48% / reading 52% proficiency, ranked #120 of 826 in TX (top 14%) — acceptable for families but not a draw, mixed tenant base, ~2y average lease.
- Zoned schools: Samuel Beck El (math 71% / reading 75%, grade A, #101 of 4,322 statewide, top 2%, 725 students, 7% FRL) — zoned schools average 7% FRL vs 22% district-wide (15 pts lower); this property's tenant base skews higher-income than the district average.
- Zoned-school proficiency averages 73% at this address vs 50% district-wide (+23 pts) — the actual schools serving this property are materially stronger than the Northwest ISD average implies; a family-tenant draw the district grade alone would hide.
- Market conditions: Rents flat; 374 active listings in the ZIP; 15 comparable units currently listed for rent nearby; rentals at typical pace (median 24d on market — plan ~3-4 weeks tenant-placement turnaround); 47% of comp listings sitting > 30 days — soft ceiling on asking rent; high-income renter base; 10,531 units permitted in Denton County in 2024 (2,713 in 5+ unit buildings).
Forward outlook
- Local home prices are declining (-3.0%/yr); year-one equity from $2k of loan paydown is wiped out by about $7k of value loss. Plan a longer hold.
- Denton County population projected at +66% by 2050 — long-run rental-demand tailwind backs the buy-and-hold thesis.
Negotiation context
- Only 8 days on market — expect competitive offers; lowballing is unlikely to land.
- 2 sale attempts with the ask held roughly flat each time — persistent listings suggest the price (not the market) is what's stuck; bring a comps-based counter.
Risks & watch-outs
- Climate carrying-cost: extreme-heat days projected 7→23/yr by 2055 (HVAC capex compounding) — expect insurance premiums to compound above CPI over the hold.
Questions for the listing agent
- Is there a deadline driving the sale (1031 exchange, divorce, estate, relocation)? That informs how much negotiation room exists.
- Schools are B-rated — typically a magnet for longer-tenancy family renters. What's the average tenant stay here, and is there a school-zone premium baked into asking?
- What's the average days-on-market for RENTAL listings here right now (not sales)? A rising rental-DOM trend means longer vacancies and softer asking-rent achievability than the comps imply.
- What's the recent tenant-quality profile in this submarket — average credit score on applications, eviction rate, late-payment / NSF rate, and stable-employment percentage? A property-management company in the area should have these aggregated.
- How much new for-sale + rental construction is in the pipeline within 1–3 miles? Heavy new supply typically softens prices + rents 12–24 months out; constrained supply supports both.
Investment metrics
- 1% rule
- 1.02% ✓
- Cap rate
- 8.47%
- Cash-on-cash
- 7.78%
- DSCR
- 1.35
- GRM
- 8.1
CMA / ARV
- ARV (on-the-fly)
- $315,168
- Comps found
- 2
Show comp detail 2 sales within ~0.75 mi
| Address | Dist | Beds/Ba | Sqft | Sold | Price | $/sf | Match |
|---|---|---|---|---|---|---|---|
| 405 Ashley Ln | 0.48mi | 3/2.0 | 1,364 (-13%) | 6mo | $274,000 | $201 | 51 |
| 429 Ashley Ln | 0.40mi | 3/2.0 | 1,400 (-11%) | 18mo | $240,000 | $171 | 48 |
Match score weights: distance 35% · size 25% · config 20% · recency 20%. Top-matched comps best support the ARV.
Projected returns pro-forma
-3.0% appreciation · 0.29% rent growth · sell at horizon
- IRR
- -7.3%
- Equity multiple
- 0.74×
- Total profit
- $-17,339
- Equity at exit
- $35,039
- IRR
- -1.3%
- Equity multiple
- 0.92×
- Total profit
- $-5,133
- Equity at exit
- $20,319
Cash invested: $65,800 (down + closing). Projections, not guarantees.
Landlord ↔ Tenant lean methodology
- Overall (STATE)
- 87 Strongly Landlord-Friendly
- State Texas
- 87 Strongly Landlord-Friendly · R+5
- County
- — inherits STATE
- City
- — inherits STATE
ZIP-level market 76262
- Home prices YoY
- -30.5%
- Rents YoY
- 0.3%
- Active inventory
- 374
- Price-to-rent
- 8.1×
Monthly cashflow live
- Estimated rent
- $2,403 high interval (Pro) →
- Mortgage (P&I)
- −$1,232
- Tax from tax record
- −$142 /mo · $1,698/yr
- Insurance
- −$98
- HOA
- −$0
- Vacancy / Maint / Mgmt
- −$505
- Net cashflow
- $427
Break-even live
UW: 25.0% down · 7.5% · 30yr · 1.5% tax · 5.0% vac · 8.0% maint · 8.0% mgmt
Financing live
Cash to close
- Down payment
- $58,750
- Closing costs
- $7,050
- Reserves months
- —
- Total cash needed
- —
Loan-product check · same deal, 3 products live
Conventional
25% down · 7.5% · 30yr
- Down + closing
- —
- Monthly P&I
- —
- Monthly cashflow
- —
- DSCR
- —
- Eligible?
- —
Personal DTI + credit; lowest rate.
DSCR
20% down · 8.5% · 30yr
- Down + closing
- —
- Monthly P&I
- —
- Monthly cashflow
- —
- DSCR
- —
- Eligible?
- —
No personal income docs; deal must DSCR.
Hard money
10% down · 12.0% · 12mo
- Down + closing
- —
- Monthly P&I
- —
- Monthly cashflow
- —
- DSCR
- —
- Eligible?
- —
Short-term bridge; refi at stabilization.
Rent comps 15 comps
| Address | Beds | Baths | Sqft | Rent | $/sqft | DOM | Units | Dist |
|---|---|---|---|---|---|---|---|---|
| 116 Willow Ln Roanoke, TX | 3.0 | 3.0 | 1185 | $2,500 | $2.11 | 43d | 1 | 0.51mi |
| 145 Lakeview Rd Roanoke, TX | 3.0 | 2.0 | 1529 | $1,800 | $1.18 | 43d | 1 | 0.57mi |
| 21 Durango Dr Roanoke, TX | 3.0 | 2.0 | 1878 | $2,650 | $1.41 | 24d | 1 | 0.62mi |
| 300 Dorset Ct Roanoke, TX | 4.0 | 2.0 | 2163 | $3,100 | $1.43 | 43d | 1 | 0.63mi |
| 305 Lois St Roanoke, TX | 3.0 | 2.0 | 1501 | $2,600 | $1.73 | 3d | 1 | 0.76mi |
| 1515 Cannon Pkwy Roanoke, TX | 1.0–3.0 | 1.0–2.0 | 945 | $2,318 | $2.45 | 1d | 45 | 0.77mi |
| 2001 Holley Pkwy Roanoke, TX | 1.0–3.0 | 1.0–2.0 | 999 | $2,388 | $2.39 | 1d | 29 | 0.89mi |
| 1412 Pine Ridge Rd Roanoke, TX | 4.0 | 2.5 | 2199 | $2,656 | $1.21 | 4d | 1 | 0.98mi |
| 1305 Pine Ridge Rd Roanoke, TX | 4.0 | 2.0 | 1725 | $2,600 | $1.51 | 43d | 1 | 0.99mi |
| 17 Cimarron Dr Roanoke, TX | 3.0 | 2.0 | 1521 | $2,300 | $1.51 | 43d | 1 | 1.04mi |
| 108 U.S. 377 Unit 410 Roanoke, TX | 2.0 | 2.0 | 1344 | $2,699 | $2.01 | 43d | 1 | 1.32mi |
| 108 U.S. 377 Unit 321 Roanoke, TX | 2.0 | 2.0 | 1180 | $2,653 | $2.25 | 43d | 1 | 1.32mi |
| 108 U.S. 377 Unit 301 Roanoke, TX | 2.0 | 2.0 | 1087 | $1,999 | $1.84 | 11d | 1 | 1.32mi |
| 108 U.S. 377 Unit 420 Roanoke, TX | 2.0 | 2.0 | 1291 | $2,499 | $1.94 | 24d | 1 | 1.32mi |
| 108 N Highway 377 Roanoke, TX | 2.0 | 1.0–2.0 | 942 | $2,997 | $3.18 | 1d | 15 | 1.32mi |
Listing history 6 events
-
2026-06-18days on market $235,000 Active 8 DOM
-
2026-06-17days on market $235,000 Active 7 DOM
-
2026-06-16days on market $235,000 Active 6 DOM
-
2026-06-15days on market $235,000 Active 5 DOM
-
2026-06-13remarks 541-char remark
-
2026-06-13$235,000 Active 3 DOM
ⓘ Source: listings_history table (triggers on properties + properties_extension) + one-shot
backfill from property_details.listing_events for pre-trigger history.
Tax reassessment forecast TX · Resets to sale price
- Current annual tax
- $1,698 · $142/mo
- Projected year-2 tax
- $4,300 · $358/mo
- Expected delta
- +$2,602/yr (+$217/mo · 153.2%)
ⓘ Screening estimate from a state-policy table — verify with the county assessor before closing.
Climate risk First Street
- Flood 1/10 Low FEMA zone X (unshaded) · 0% chance over 30 yrs
- Wildfire 4/10 Moderate
- Heat 7/10 Severe 7 d/yr ≥109°F today · 23 d/yr by 30 yrs out
- Wind 4/10 Moderate 24% chance of damaging wind over 30 yrs
- Air quality 3/10 Moderate 3 unhealthy d/yr today · 4 by 30 yrs out
Nearby sold comps map
Loading sold comps map…
Walkable amenities ~0.75 mi
Loading nearby amenities…
Taxation est. · year 1
- Rental income
- $28,839
- − Mortgage interest
- −$13,164
- − Property taxes
- −$1,698
- − Insurance
- −$1,175
- − Repairs & maintenance
- −$2,307
- − Management
- −$2,307
- − Depreciation
- −$6,836
- Taxable income
- $1,351
- Est. tax owed @ 24.0%
- −$324
- After-tax cash flow
- $4,796/yr
For passive investors: Depreciation is non-cash, so a rental often shows a tax loss while cash-flowing — sheltering income. Rental losses are passive: they offset passive income freely, and up to $25,000/yr can offset ordinary (W-2) income if you actively participate and your MAGI is under $100k (phasing out to $0 by $150k); unused losses carry forward. On sale, claimed depreciation is recaptured at up to 25%, and gains may owe capital-gains tax (a 1031 exchange can defer both). Figures are a year-1 estimate at your 24.0% rate — not tax advice; consult a CPA.
Schools (NCES district)
- District
- Northwest ISD
- NCES district ID
- 4833180
- Math proficiency
- 48% ▼ -15.00%
- Reading proficiency
- 52% ▼ -8.00%
- Median HH income
- $85,315
- Composite
- 46.15/100
- National rank
- #2504
- State rank
- #120 of 826 in TX
Livability — Roanoke
- Score
- 80/100
- State rank
- #40
- US rank
- #1783
Category grades
Schools grade is shown separately in the Schools card above.
Census & demographics
- Census place
- Roanoke, TX
- County
- Denton County · 901,654 people
- City population
- 43,620
- Metro
- Dallas-Fort Worth-Arlington, TX
- Population (ZIP)
- 43,620
- Household income
- $151,250
- Rent vs Own
- Severe rent burden
- 704.0
Population outlook (Denton County) Hauer SSP2
- Today (2025)
- 1,053,010 people
- By 2030
- 1,192,269 · +13.2%
- By 2040
- 1,472,920 · +39.9%
- By 2050
- 1,746,506 · +65.9%
- By 2075
- 2,358,497 · +124.0%
- By 2100
- 2,779,183 · +163.9%
Race, ethnicity, and origin ACS 2023
- Neighborhood character
- Predominantly White (67%)
- Race & ethnicity
- White 67% Hispanic / Latino 15% Two or more races 12% Asian 7% Black 5%
- Hispanic origin (detail)
- Mexican 11%
- Common ancestry
- Slovak 3% Italian 3% Romanian 2%
- Foreign-born
- 12% · Canada, South Korea, Vietnam
- Languages at home
- 83% English-only · Spanish 8% Other Indo-European 3% Other Asian/Pacific 1%
Political lean MEDSL · Denton
- 2024 margin
- R (+13.2) · D 42.7% · R 55.8% · Other 1.5%
- 2008→2024 swing
- +11.0pp toward D · 2008: -24.2pp · 2024: -13.2pp
- All cycles
- 2024: R+13.2 2020: R+8.1 2016: R+20.2 2012: R+31.7 2008: R+24.2
Not yet ingested
- Civics
- —
Market trends
- HPI YoY
- ▼ -119.49%
- Current HPI
- 272.8582
- Rent YoY
- ▲ 0.29%
- Metro
- Dallas-Fort Worth-Arlington, TX
- State GDP YoY
- ▲ 3.95%
- F500 in state
- 110
Industry mix (Fortune 500 HQ in TX)
| Industry | F500 HQs | Revenue |
|---|---|---|
| Energy | 16 | $1,198B |
|
||
| Technology | 5 | $198B |
|
||
| Engineering / Construction | 4 | $72B |
|
||
| Energy Services | 3 | $60B |
|
||
| Utilities | 3 | $41B |
|
||
| Healthcare | 2 | $330B |
|
||
Price history
+0.0% since first listed4 events — show timeline
- 2026-06-10 Listed $235,000 NTREIS
- 2026-06-10 Listed $235,000 NTREIS
- 1994-08-04 Sold (Public Records) — Public Records
- 1994-08-04 Sold (Public Records) — Public Records
Property tax history
+3.6%/yrLatest (2025): $1,698 · +8.8% YoY. Source: county tax records.
Cash-flow waterfall
monthlySold comps — $/sqft
last 12 mo · ≤1 miLoading sold comps…