 🌊 Lakefront
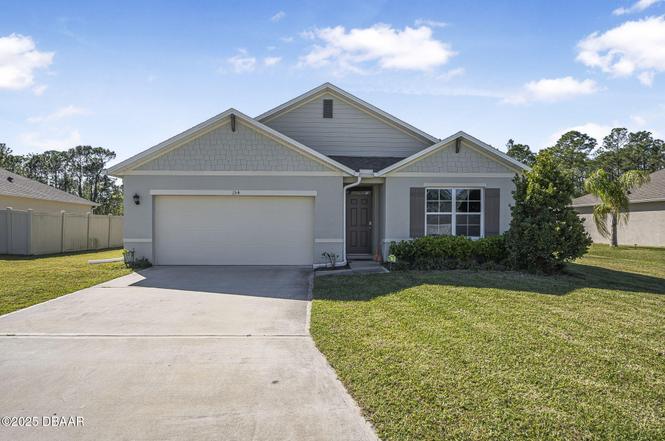
154 Sunset Point Dr · Ormond Beach, FL
Flood risk 3/10 · Minor
- FEMA flood zone
- X (unshaded)
- Chance of flooding over 30 yrs
- 0.2%
- Est. flood insurance / yr
- $507 – $1,088
Fire risk 6/10 · Moderate
- Est. fire insurance / yr
- $947 – $1,759
Heat risk 9/10 · Severe
- Hot days now (above 106°F)
- 7 days/yr
- Hot days in 30 yrs
- 20 days/yr
Wind risk 10/10 · Severe
- Chance of severe wind over 30 yrs
- 99.0%
Air-quality risk 3/10 · Minor
- Unhealthy air days now
- 3 days/yr
- Unhealthy air days in 30 yrs
- 3 days/yr
Risk factors via First Street. Map © Google.
Why this score? — see what drove the D- grade
The composite is a weighted blend of 9 inputs, each scored 0–100. Each bar is that input's sub-score; the figure is the points it added to the 100-point composite (weight × sub-score).
- Cash flow +11.8/30.0
- ARV discount +7.5/15.0
- Livability +4.2/5.0
- Schools +3.9/10.0
- DSCR +3.5/10.0
- 1% rule +3.4/10.0
- Rent growth +2.9/5.0
- Condition / age +2.5/5.0
- Appreciation +0.0/10.0
$334,900
🖨 Deal sheet (PDF) 📄 Offer letter ✓ Due diligence
Listing remarks
SELLER MOTIVATED. Seller offering 5,000 in seller concessions towards buyers closing cost. Welcome to your lakefront dream home in the sought-after Pineland subdivision of Ormond Beach! This spacious 4-bedroom, 2-bathroom home offers the perfect blend of comfort and modern living, open floor plan and stylish finishes throughout. Step inside to find a bright and airy living space, perfect for entertaining. The gourmet kitchen boasts stainless steel appliances, granite countertops, a large island, large walk in pantry, and ample cabinet space. The primary suite is a true retreat with a his and hers walk-in closets and a luxurious en-suite bath featuring dual vanities and a walk-in shower. Thr
Key facts
- Gourmet kitchen
- Lakefront dream home
- Granite countertops
Tags
Property features AI
Finance
- Other: Located in the Pineland subdivision
- HOA & community: Homeowners association with community pool; HOA fee $306 quarterly (about $102/month); HOA fee includes grounds maintenance
Exterior
- Parking: Attached garage with 2 spaces
- Security: Smoke detectors
- Utilities: Public water; Public sewer; Electricity connected; Water connected
- Home design: Single-family residence; One story; Updated / remodeled; Residential use
- Construction: Block and stucco construction; Shingle roof; Slab foundation; Built as single-family home
- Exterior features: Patio with screened area; Lakefront waterfront; Waterfront view; Asphalt road access
Interior
- Kitchen: Refrigerator; Microwave; Convection oven; Dishwasher; Disposal
- Bedrooms: Bedrooms with walk-in closets
- Flooring: Carpet; Tile
- Bathrooms: 2 full bathrooms
- Heating & cooling: Central heating; Central air; Ceiling fans
- Interior features: Ceiling fans; Kitchen island; Smart thermostat; Walk-in closets; 6 total rooms
- Laundry & utility: In-unit laundry (washer and dryer included)
Neighborhood map
What this means for you Summary
Snapshot
- This is a 4-bed/2.0-bath single-family listed at $335k.
Deal economics
- At list price, monthly cash flow is $-94 ($-1k/yr) — negative.
- To cash-flow at today's rent, offer at most $318k (5.0% below list).
- To meet the 1% rule (rent ≥ 1% of price), the offer needs to be $280k (16.5% below list).
- Recommended offer: $280k (16.5% below list) — sets the bar for 1% rule.
- Cap rate 6.0% vs local median 3.8% in Ormond Beach — top-decile yield for the area; either an underpriced asset or a hidden risk that comps aren't pricing in. Stress-test before assuming the spread holds.
Location & tenants
- Location reads 83/100 on livability (#55 in FL, #965 nationally) — a professional / high-income tenant draw. Strengths: amenities A+, housing A+, health & safety A+; Watch: commute F.
- Volusia (suburban): math 44% / reading 49% proficiency, ranked #47 of 73 in FL (top 64%) — families likely to look elsewhere, expect single-tenant / working-renter base with shorter leases.
- Zoned schools: Pine Trail Elementary School (math 77% / reading 72%, grade A, #230 of 2,144 statewide, top 12%, 688 students, 45% FRL); Ormond Beach Middle School (math 57% / reading 55%, grade B-, #175 of 571 statewide, top 31%, 990 students, 48% FRL); Seabreeze High School (math 31% / reading 56%, grade F, #248 of 667 statewide, top 38%, 1,654 students, 41% FRL).
- Market conditions: Rents rising (+1.6%/yr); 989 active listings in the ZIP; 4 comparable units currently listed for rent nearby; rentals at typical pace (median 26d on market — plan ~3-4 weeks tenant-placement turnaround); 3,402 units permitted in Volusia County in 2024 (681 in 5+ unit buildings).
- At $2,797/mo this rent would consume 47% of the median local household income ($71k/yr) (locally 1158% of renters already pay >50% of income on rent) — very limited rent-growth headroom before tenants either downsize or default.
Forward outlook
- Local home prices are declining (-3.0%/yr); year-one equity from $2k of loan paydown is wiped out by about $10k of value loss. Plan a longer hold.
- Volusia County population projected at +19% by 2050 — long-run rental-demand tailwind backs the buy-and-hold thesis.
Negotiation context
- It's been on market 426 days — a 12% lower offer ($295k) is reasonable based on typical stale-listing flexibility.
- 3 sale attempts; this cycle's ask is 13569% above the opening price — seller raised mid-cycle; expect resistance to lowballs.
Risks & watch-outs
- Climate carrying-cost: severe wind risk, 99% chance of damaging wind over 30y; major wildfire risk; extreme-heat days projected 7→20/yr by 2055 (HVAC capex compounding) — expect insurance premiums to compound above CPI over the hold.
Questions for the listing agent
- What do current leases actually rent for vs. the listed asking? Can we see a recent rent roll and the last 12 months of T-12 income?
- It's been on market 426 days. Have you received any prior offers? Is the seller open to a 16% concession, seller financing, or rate buy-down credit?
- What does the HOA fee cover, when was the last increase, and are there any pending special assessments or reserve-fund shortfalls?
- Why hasn't it sold? Are there any deal-killer items the seller is aware of (foundation, flood, title, zoning, code violations)?
- Is there a deadline driving the sale (1031 exchange, divorce, estate, relocation)? That informs how much negotiation room exists.
- Schools are B-rated — typically a magnet for longer-tenancy family renters. What's the average tenant stay here, and is there a school-zone premium baked into asking?
- The area grade is low — what's the realistic commute time and amenity access for the typical tenant pool here? Any planned neighborhood developments (good or bad) we should know about?
- This sits on a lake — are riparian / water-frontage rights deeded with the parcel? Any dock permits, shoreline easements, or HOA water-use restrictions?
- What's the documented flood / surge / shoreline-erosion history here (FEMA AND non-FEMA — e.g., storm surge, creek backup, septic-field saturation)?
- Any water-quality or seasonal algae-bloom issues that affect tenant satisfaction or short-term-rental demand?
- What's the average days-on-market for RENTAL listings here right now (not sales)? A rising rental-DOM trend means longer vacancies and softer asking-rent achievability than the comps imply.
- What's the recent tenant-quality profile in this submarket — average credit score on applications, eviction rate, late-payment / NSF rate, and stable-employment percentage? A property-management company in the area should have these aggregated.
- How much new for-sale + rental construction is in the pipeline within 1–3 miles? Heavy new supply typically softens prices + rents 12–24 months out; constrained supply supports both.
Investment metrics
- 1% rule
- 0.84% ✗
- Cap rate
- 5.96%
- Cash-on-cash
- -1.21%
- DSCR
- 0.95
- GRM
- 10.0
CMA / ARV
No comps found within radius.
Projected returns pro-forma
-3.0% appreciation · 1.64% rent growth · sell at horizon
- IRR
- -19.8%
- Equity multiple
- 0.32×
- Total profit
- $-64,009
- Equity at exit
- $49,935
- IRR
- -15.8%
- Equity multiple
- 0.16×
- Total profit
- $-78,396
- Equity at exit
- $28,956
Cash invested: $93,772 (down + closing). Projections, not guarantees.
Landlord ↔ Tenant lean methodology
- Overall (STATE)
- 87 Strongly Landlord-Friendly
- State Florida
- 87 Strongly Landlord-Friendly · R+3
- County
- — inherits STATE
- City
- — inherits STATE
ZIP-level market 32174
- Rents YoY
- 1.6%
- Active inventory
- 989
- Price-to-rent
- 10.0×
Monthly cashflow live
- Estimated rent
- $2,797 medium interval (Pro) →
- Mortgage (P&I)
- −$1,756
- Tax from tax record
- −$306 /mo · $3,673/yr
- Insurance
- −$140
- HOA
- −$102
- Vacancy / Maint / Mgmt
- −$587
- Net cashflow
- $-94
Break-even live
Sensitivity live
| Price | -10% $95 | -5% $1 | +0% $-94 | +5% $-189 | +10% $-284 |
|---|---|---|---|---|---|
| Rent | -10% $-315 | -5% $-205 | +0% $-94 | +5% $16 | +10% $127 |
| Rate | -1.0pp $74 | -0.5pp $-9 | base $-94 | +0.5pp $-181 | +1.0pp $-269 |
UW: 25.0% down · 7.5% · 30yr · 1.5% tax · 5.0% vac · 8.0% maint · 8.0% mgmt
Financing live
Cash to close
- Down payment
- $83,725
- Closing costs
- $10,047
- Reserves months
- —
- Total cash needed
- —
Loan-product check · same deal, 3 products live
Conventional
25% down · 7.5% · 30yr
- Down + closing
- —
- Monthly P&I
- —
- Monthly cashflow
- —
- DSCR
- —
- Eligible?
- —
Personal DTI + credit; lowest rate.
DSCR
20% down · 8.5% · 30yr
- Down + closing
- —
- Monthly P&I
- —
- Monthly cashflow
- —
- DSCR
- —
- Eligible?
- —
No personal income docs; deal must DSCR.
Hard money
10% down · 12.0% · 12mo
- Down + closing
- —
- Monthly P&I
- —
- Monthly cashflow
- —
- DSCR
- —
- Eligible?
- —
Short-term bridge; refi at stabilization.
Rent comps 4 comps
| Address | Beds | Baths | Sqft | Rent | $/sqft | DOM | Units | Dist |
|---|---|---|---|---|---|---|---|---|
| 298 Sunset Point Dr Ormond Beach, FL | 4.0 | 2.0 | 1846 | $2,495 | $1.35 | 25d | 1 | 0.32mi |
| 356 Seminole Dr Ormond Beach, FL | 4.0 | 3.0 | 1604 | $3,295 | $2.05 | 16d | 1 | 1.26mi |
| 322 Oak Fern Cir Ormond Beach, FL | 3.0 | 2.0 | 2268 | $2,750 | $1.21 | 25d | 1 | 1.28mi |
| 21 Pergola Pl Ormond Beach, FL | 3.0 | 2.5 | 2529 | $3,395 | $1.34 | 4d | 1 | 1.31mi |
HOA detail
- Monthly dues
- $102 · $1,224/yr
Listing history 13 events
-
2026-05-10historical $2,450
-
2026-05-08status Pending
-
2026-05-05$2,450
-
2026-05-01historical $2,450
-
2026-04-02price $334,900
-
2026-03-06price $339,900
-
2026-02-24$2,450
-
2025-11-06price $360,000
-
2025-08-04price $370,000
-
2025-06-17price $375,000
-
2025-05-06price $385,000
-
2025-03-07$415,000 Active
-
2020-09-21soldstatus $638,133
ⓘ Source: listings_history table (triggers on properties + properties_extension) + one-shot
backfill from property_details.listing_events for pre-trigger history.
Tax reassessment forecast FL · Resets to sale price
- Current annual tax
- $3,673 · $306/mo
- Projected year-2 tax
- $3,673 · $306/mo
- Expected delta
- $0/yr ($0/mo · 0.0%)
ⓘ Screening estimate from a state-policy table — verify with the county assessor before closing.
Climate risk First Street
- Flood 3/10 Moderate FEMA zone X (unshaded) · 20% chance over 30 yrs
- Wildfire 6/10 Major
- Heat 9/10 Extreme 7 d/yr ≥106°F today · 20 d/yr by 30 yrs out
- Wind 10/10 Extreme 99% chance of damaging wind over 30 yrs
- Air quality 3/10 Moderate 3 unhealthy d/yr today · 3 by 30 yrs out
Nearby sold comps map
Loading sold comps map…
Walkable amenities ~0.75 mi
Loading nearby amenities…
Taxation est. · year 1
- Rental income
- $33,565
- − Mortgage interest
- −$18,760
- − Property taxes
- −$3,673
- − Insurance
- −$1,674
- − Repairs & maintenance
- −$2,685
- − Management
- −$2,685
- − HOA
- −$1,224
- − Depreciation
- −$9,743
- Taxable loss
- −$6,879
- Est. tax savings @ 24.0%
- +$1,651
- After-tax cash flow
- $521/yr
For passive investors: Depreciation is non-cash, so a rental often shows a tax loss while cash-flowing — sheltering income. Rental losses are passive: they offset passive income freely, and up to $25,000/yr can offset ordinary (W-2) income if you actively participate and your MAGI is under $100k (phasing out to $0 by $150k); unused losses carry forward. On sale, claimed depreciation is recaptured at up to 25%, and gains may owe capital-gains tax (a 1031 exchange can defer both). Figures are a year-1 estimate at your 24.0% rate — not tax advice; consult a CPA.
Schools (NCES district)
- District
- Volusia
- NCES district ID
- 1201920
- Math proficiency
- 44% ▼ -9.00%
- Reading proficiency
- 49% ▼ -3.00%
- Median HH income
- $42,946
- Composite
- 39.2/100
- National rank
- #4019
- State rank
- #47 of 73 in FL
Livability — Ormond Beach
- Score
- 83/100
- State rank
- #55
- US rank
- #965
Category grades
Schools grade is shown separately in the Schools card above.
Census & demographics
- Census place
- Ormond Beach, FL
- County
- Volusia County · 556,871 people
- City population
- 69,624
- Metro
- Deltona-Daytona Beach-Ormond Beach, FL
- Population (ZIP)
- 54,783
- Household income
- $71,011
- Rent vs Own
- Severe rent burden
- 1158.0
Population outlook (Volusia County) Hauer SSP2
- Today (2025)
- 572,749 people
- By 2030
- 598,695 · +4.5%
- By 2040
- 644,880 · +12.6%
- By 2050
- 681,451 · +19.0%
- By 2075
- 759,957 · +32.7%
- By 2100
- 778,902 · +36.0%
Race, ethnicity, and origin ACS 2023
- Neighborhood character
- Predominantly White (82%)
- Race & ethnicity
- White 82% Black 6% Hispanic / Latino 5% Two or more races 5% Asian 3%
- Hispanic origin (detail)
- Puerto Rican 2%
- Common ancestry
- Romanian 4% Lithuanian 3% Slovak 3%
- Foreign-born
- 7% · Canada, China
- Languages at home
- 91% English-only · Spanish 3% Other Indo-European 1% German/W. Germanic 1%
Political lean MEDSL · Volusia
- 2024 margin
- Strong R (+21.8) · D 38.7% · R 60.5%
- 2008→2024 swing
- -27.4pp toward R · 2008: 5.7pp · 2024: -21.8pp
- All cycles
- 2024: R+21.8 2020: R+14.1 2016: R+13.1 2012: R+1.2 2008: D+5.7
Not yet ingested
- Civics
- —
Market trends
- HPI YoY
- ▼ -327.97%
- Current HPI
- 271.92
- Rent YoY
- ▲ 1.64%
- Metro
- Deltona-Daytona Beach-Ormond Beach, FL
- State GDP YoY
- ▲ 3.28%
- F500 in state
- 36
Industry mix (Fortune 500 HQ in FL)
| Industry | F500 HQs | Revenue |
|---|---|---|
| Industrial Technology | 2 | $29B |
|
||
| Insurance | 2 | $17B |
|
||
| Retail | 1 | $60B |
|
||
| Technology Distribution | 1 | $58B |
|
||
| Homebuilding | 1 | $35B |
|
||
| Technology Manufacturing | 1 | $35B |
|
||
Price history
-99.6% since first listed13 events — show timeline
- 2026-05-10 Rental Removed $2,450 TENANTTURNER2
- 2026-05-08 Pending — Daytona MLS
- 2026-05-05 Listed for Rent $2,450 TENANTTURNER2
- 2026-05-01 Rental Removed $2,450 DMLS
- 2026-04-02 Price Changed $334,900 Daytona MLS
- 2026-03-06 Price Changed $339,900 Daytona MLS
- 2026-02-24 Listed for Rent $2,450 DMLS
- 2025-11-06 Price Changed $360,000 Daytona MLS
- 2025-08-04 Price Changed $370,000 Daytona MLS
- 2025-06-17 Price Changed $375,000 Daytona MLS
- 2025-05-06 Price Changed $385,000 Daytona MLS
- 2025-03-07 Listed $415,000 Daytona MLS
- 2020-09-21 Sold (Public Records) $638,133 Public Records
Property tax history
+59.3%/yrLatest (2025): $3,673 · +4.2% YoY. Source: county tax records.
Cash-flow waterfall
monthlySold comps — $/sqft
last 12 mo · ≤1 miLoading sold comps…