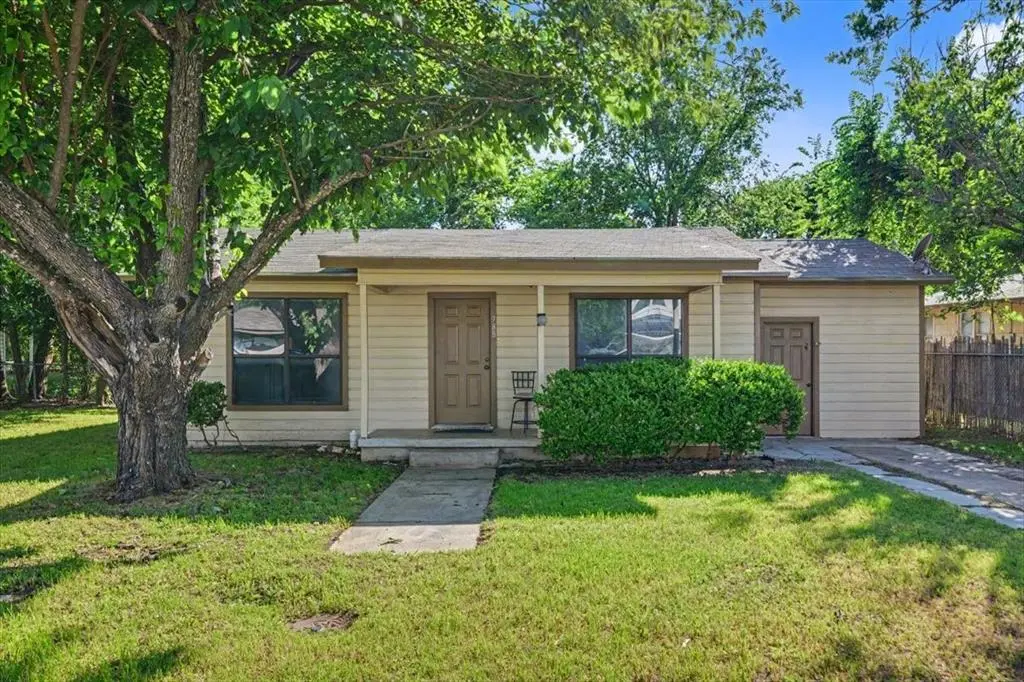
988 N Clinton St · Stephenville, TX
Flood risk 1/10 · Minimal
- FEMA flood zone
- X (unshaded)
- Chance of flooding over 30 yrs
- 0.0%
- Est. flood insurance / yr
- $507 – $1,088
Fire risk 7/10 · Major
- Est. fire insurance / yr
- $1,222 – $2,270
Heat risk 6/10 · Moderate
- Hot days now (above 105°F)
- 7 days/yr
- Hot days in 30 yrs
- 20 days/yr
Wind risk 6/10 · Moderate
- Chance of severe wind over 30 yrs
- 27.0%
Air-quality risk 1/10 · Minimal
- Unhealthy air days now
- 0 days/yr
- Unhealthy air days in 30 yrs
- 0 days/yr
Risk factors via First Street. Map © Google.
Why this score? — see what drove the B grade
The composite is a weighted blend of 9 inputs, each scored 0–100. Each bar is that input's sub-score; the figure is the points it added to the 100-point composite (weight × sub-score).
- Cash flow +26.6/30.0
- ARV discount +15.0/15.0
- DSCR +9.1/10.0
- 1% rule +7.9/10.0
- Schools +4.2/10.0
- Livability +3.8/5.0
- Rent growth +2.5/5.0
- Condition / age +2.5/5.0
- Appreciation +0.0/10.0
$145,000
🖨 Deal sheet (PDF) 📄 Offer letter ✓ Due diligence
Listing remarks
Looking for your next project? Look no further! This spacious fixer upper offers incredible potential with its generous square footage, large lot and unbeatable location close to Tarleton State University, schools and local amenities. The property has two large living areas, leaving plenty of room to reconfigure the layout to maximize this value-add opportunity or meet the needs of a new owner. With a prime location in a high demand rental market, the possibilities are limitless. This fixer-upper is ready for its makeover moment. Property sold as is, no survey available. MOTIVATED SELLER. Schedule your showing today!
Key facts
- Large lot
- Prime location
- 8,973 sq ft lot
Tags
Property features AI
Finance
- Other: Lot less than 0.5 acre (approx. 0.206 acres); Fenced backyard with chain link; Does not subdivide; Directions: From Harbin, travel east on Frey St. Turn left on N Clinton; property on left
- Financial info: Listing terms: Cash; Treat as clear loan type
- HOA & community: No association
Exterior
- Parking: Driveway (no garage or covered/carport spaces)
- Utilities: City water; City sewer; Electricity connected; Cable available
- Home design: Single family residence (attached); One story; Built in 1950
- Construction: Wood construction; Composition roof; Pillar/post/pier foundation
- Exterior features: Covered porch(es); Front porch; Patio; Covered patio/porch
Interior
- Kitchen: Disposal; Electric range; Refrigerator; Electric water heater
- Bedrooms: 3 bedrooms (primary bedroom on main level)
- Flooring: Carpet; Linoleum; Other
- Bathrooms: 1 full bathroom
- Heating & cooling: Central heating (electric); Central air (electric)
- Interior features: Cable TV available; Two living areas; One dining area; Single-level (one story)
- Laundry & utility: Full-size washer/dryer area; Washer hookup; Electric dryer hookup; Utility room
Neighborhood map
What this means for you Summary
Snapshot
- This is a 3-bed/1.0-bath single-family listed at $145k.
Deal economics
- At list price, monthly cash flow is $389 ($5k/yr) — positive.
- The deal already cash-flows at list — no discount required.
- Meets the 1% rule at list price ($2k rent vs $145k).
- Recommended offer: $143k (1.5% below list) — sets the bar for market timing.
- Cap rate 9.5% vs local median 2.1% in Stephenville — top-decile yield for the area; either an underpriced asset or a hidden risk that comps aren't pricing in. Stress-test before assuming the spread holds.
Location & tenants
- Location reads 75/100 on livability (#124 in TX, #3,840 nationally) — a middle-class / working-renter tenant base. Strengths: cost of living A+, housing A+, health & safety A+; Watch: commute F, employment D-.
- Stephenville ISD (town): math 53% / reading 48% proficiency, ranked #191 of 826 in TX (top 23%) — acceptable for families but not a draw, mixed tenant base, ~2y average lease.
- Zoned schools: Chamberlin El (514 students, 50% FRL).
- Market conditions: Rents flat; 383 active listings in the ZIP; 12 comparable units currently listed for rent nearby; rentals lingering (median 45d on market — plan ~5-8 weeks vacancy on turnover, expect pricing pressure); 100% of comp listings sitting > 30 days — soft ceiling on asking rent; 110 units permitted in Erath County in 2024 (61 in 5+ unit buildings).
- This rent runs 37% of the median local income ($61k/yr) — at the standard rent-burdened threshold; future hikes will face affordability resistance.
Forward outlook
- Local home prices are declining (-3.0%/yr); year-one equity from $1k of loan paydown is wiped out by about $4k of value loss. Plan a longer hold.
- Erath County population projected at +55% by 2050 — long-run rental-demand tailwind backs the buy-and-hold thesis.
Negotiation context
- It's been on market 22 days — a 2% lower offer ($143k) is reasonable based on typical stale-listing flexibility.
Risks & watch-outs
- Watch-outs: built in 1950 — expect roof / HVAC / electrical / plumbing capex.
- Climate carrying-cost: major wind risk, 27% chance of damaging wind over 30y; major wildfire risk; extreme-heat days projected 7→20/yr by 2055 (HVAC capex compounding) — expect insurance premiums to compound above CPI over the hold.
Questions for the listing agent
- Built in 1950 — when were the roof, HVAC, electrical panel, plumbing, and water heater last replaced?
- Is there a deadline driving the sale (1031 exchange, divorce, estate, relocation)? That informs how much negotiation room exists.
- What's the average days-on-market for RENTAL listings here right now (not sales)? A rising rental-DOM trend means longer vacancies and softer asking-rent achievability than the comps imply.
- What's the recent tenant-quality profile in this submarket — average credit score on applications, eviction rate, late-payment / NSF rate, and stable-employment percentage? A property-management company in the area should have these aggregated.
- How much new for-sale + rental construction is in the pipeline within 1–3 miles? Heavy new supply typically softens prices + rents 12–24 months out; constrained supply supports both.
Investment metrics
- 1% rule
- 1.29% ✓
- Cap rate
- 9.51%
- Cash-on-cash
- 11.49%
- DSCR
- 1.51
- GRM
- 6.5
CMA / ARV
- ARV (median comp)
- $213,894
- List price
- $145,000
- Delta
- -32.21%
- Verdict
- UNDERPRICED
- Comps
- 20 within 1.0 mi
Show comp detail 12 sales within ~0.75 mi
| Address | Dist | Beds/Ba | Sqft | Sold | Price | $/sf | Match |
|---|---|---|---|---|---|---|---|
| 988 N Clinton St | 0.00mi | 3/1.0 | 1,642 (0%) | 1mo | $145,000 | $88 | 100 |
| 1808 N Cypress Ave | 0.58mi | 3/2.0 | 1,612 (-2%) | 1mo | $329,900 | $205 | 65 |
| 898 N Neblett St | 0.28mi | 3/2.0 | 1,480 (-10%) | 2mo | $260,000 | $176 | 65 |
| 1101 N Mccart St | 0.17mi | 2/2.0 (-1) | 1,472 (-10%) | 1mo | $310,000 | $211 | 65 |
| 1560 Sheila | 0.67mi | 3/2.0 | 1,653 (+1%) | 0mo | $343,500 | $208 | 64 |
| 1065 W Pecan St | 0.08mi | 4/2.0 (+1) | 1,871 (+14%) | 2mo | $329,000 | $176 | 63 |
| 525 W Tarleton St | 0.55mi | 3/2.0 | 1,724 (+5%) | 2mo | $195,000 | $113 | 61 |
| 521 N Columbia St | 0.55mi | 4/2.5 (+1) | 1,658 (+1%) | 2mo | $258,000 | $156 | 60 |
| 1425 W Lingleville Rd | 0.52mi | 3/2.0 | 1,826 (+11%) | 2mo | $299,000 | $164 | 51 |
| 1430 N Bates St | 0.74mi | 3/3.5 | 1,704 (+4%) | 1mo | $325,000 | $191 | 49 |
| 1490 Sheila St | 0.56mi | 3/2.0 | 1,432 (-13%) | 2mo | $225,000 | $157 | 47 |
| 1310 N Cleveland Ave | 0.70mi | 3/2.0 | 1,809 (+10%) | 1mo | $340,000 | $188 | 46 |
Match score weights: distance 35% · size 25% · config 20% · recency 20%. Top-matched comps best support the ARV.
Projected returns pro-forma
-3.0% appreciation · 0.07% rent growth · sell at horizon
- IRR
- -2.7%
- Equity multiple
- 0.90×
- Total profit
- $-3,994
- Equity at exit
- $21,620
- IRR
- 3.2%
- Equity multiple
- 1.20×
- Total profit
- $8,070
- Equity at exit
- $12,537
Cash invested: $40,600 (down + closing). Projections, not guarantees.
Landlord ↔ Tenant lean methodology
- Overall (STATE)
- 87 Strongly Landlord-Friendly
- State Texas
- 87 Strongly Landlord-Friendly · R+5
- County
- — inherits STATE
- City
- — inherits STATE
ZIP-level market 76401
- Rents YoY
- 0.1%
- Active inventory
- 383
- Price-to-rent
- 6.5×
Monthly cashflow live
- Estimated rent
- $1,863 high interval (Pro) →
- Mortgage (P&I)
- −$760
- Tax from tax record
- −$262 /mo · $3,149/yr
- Insurance
- −$60
- HOA
- −$0
- Vacancy / Maint / Mgmt
- −$391
- Net cashflow
- $389
Break-even live
Sensitivity live
| Price | -10% $471 | -5% $430 | +0% $389 | +5% $348 | +10% $307 |
|---|---|---|---|---|---|
| Rent | -10% $242 | -5% $315 | +0% $389 | +5% $462 | +10% $536 |
| Rate | -1.0pp $462 | -0.5pp $426 | base $389 | +0.5pp $351 | +1.0pp $313 |
UW: 25.0% down · 7.5% · 30yr · 1.5% tax · 5.0% vac · 8.0% maint · 8.0% mgmt
Financing live
Cash to close
- Down payment
- $36,250
- Closing costs
- $4,350
- Reserves months
- —
- Total cash needed
- —
Loan-product check · same deal, 3 products live
Conventional
25% down · 7.5% · 30yr
- Down + closing
- —
- Monthly P&I
- —
- Monthly cashflow
- —
- DSCR
- —
- Eligible?
- —
Personal DTI + credit; lowest rate.
DSCR
20% down · 8.5% · 30yr
- Down + closing
- —
- Monthly P&I
- —
- Monthly cashflow
- —
- DSCR
- —
- Eligible?
- —
No personal income docs; deal must DSCR.
Hard money
10% down · 12.0% · 12mo
- Down + closing
- —
- Monthly P&I
- —
- Monthly cashflow
- —
- DSCR
- —
- Eligible?
- —
Short-term bridge; refi at stabilization.
Rent comps 12 comps
| Address | Beds | Baths | Sqft | Rent | $/sqft | DOM | Units | Dist |
|---|---|---|---|---|---|---|---|---|
| 791 N Clinton St Stephenville, TX | 2.0 | 1.5 | 1160 | $1,800 | $1.55 | 44d | 1 | 0.13mi |
| 794 W Pecan St Unit 101 Stephenville, TX | 3.0 | 2.5 | 1540 | $2,200 | $1.43 | 44d | 1 | 0.16mi |
| 525 W Collins Stephenville, TX | 3.0 | 3.5 | 1938 | $800 | $0.41 | 44d | 1 | 0.37mi |
| 1713 Bingham St Stephenville, TX | 3.0 | 1.0 | 1218 | $1,750 | $1.44 | 44d | 1 | 0.38mi |
| 290 S McIlhaney St Unit 1102 Stephenville, TX | 3.0 | 3.0 | 1223 | $775 | $0.63 | 44d | 1 | 0.70mi |
| 1361 W McNeill St Stephenville, TX | 3.0 | 1.0 | 1200 | $1,495 | $1.25 | 44d | 1 | 0.73mi |
| 1435 W McNeill St Stephenville, TX | 2.0 | 1.0 | 1120 | $1,500 | $1.34 | 44d | 1 | 0.76mi |
| 504 S 1st Ave Unit 1 Stephenville, TX | 3.0 | 1.5 | 1100 | $1,250 | $1.14 | 44d | 1 | 0.85mi |
| 561 S Second Ave Stephenville, TX | 3.0 | 3.0 | 1500 | $750 | $0.50 | 44d | 1 | 0.90mi |
| 402 Garrett Ct Stephenville, TX | 3.0 | 3.0 | 1300 | $750 | $0.58 | 44d | 1 | 0.96mi |
| 701 S Lillian St Stephenville, TX | 3.0 | 3.0 | 1375 | $695 | $0.51 | 44d | 1 | 1.10mi |
| 508 Galt Dr Stephenville, TX | 3.0 | 2.5 | 1544 | $2,200 | $1.42 | 44d | 1 | 1.11mi |
Listing history 8 events
-
2026-06-03statusdays on market $145,000 Pending 22 DOM
-
2026-06-02days on market $145,000 Active Option Contract 21 DOM
-
2026-06-01days on market $145,000 Active Option Contract 20 DOM
-
2026-05-31days on market $145,000 Active Option Contract 19 DOM
-
2026-05-30days on market $145,000 Active Option Contract 18 DOM
-
2026-05-12$165,000 Active 606-char remark
-
1996-07-23soldstatus
-
1996-07-23soldstatus
ⓘ Source: listings_history table (triggers on properties + properties_extension) + one-shot
backfill from property_details.listing_events for pre-trigger history.
Tax reassessment forecast TX · Resets to sale price
- Current annual tax
- $3,149 · $262/mo
- Projected year-2 tax
- $3,149 · $262/mo
- Expected delta
- $0/yr ($0/mo · 0.0%)
ⓘ Screening estimate from a state-policy table — verify with the county assessor before closing.
Climate risk First Street
- Flood 1/10 Low FEMA zone X (unshaded) · 0% chance over 30 yrs
- Wildfire 7/10 Severe
- Heat 6/10 Major 7 d/yr ≥105°F today · 20 d/yr by 30 yrs out
- Wind 6/10 Major 27% chance of damaging wind over 30 yrs
- Air quality 1/10 Low 0 unhealthy d/yr today · 0 by 30 yrs out
Nearby sold comps map
Loading sold comps map…
Walkable amenities ~0.75 mi
Loading nearby amenities…
Taxation est. · year 1
- Rental income
- $22,359
- − Mortgage interest
- −$8,122
- − Property taxes
- −$3,149
- − Insurance
- −$725
- − Repairs & maintenance
- −$1,789
- − Management
- −$1,789
- − Depreciation
- −$4,218
- Taxable income
- $2,568
- Est. tax owed @ 24.0%
- −$616
- After-tax cash flow
- $4,049/yr
For passive investors: Depreciation is non-cash, so a rental often shows a tax loss while cash-flowing — sheltering income. Rental losses are passive: they offset passive income freely, and up to $25,000/yr can offset ordinary (W-2) income if you actively participate and your MAGI is under $100k (phasing out to $0 by $150k); unused losses carry forward. On sale, claimed depreciation is recaptured at up to 25%, and gains may owe capital-gains tax (a 1031 exchange can defer both). Figures are a year-1 estimate at your 24.0% rate — not tax advice; consult a CPA.
Schools (NCES district)
- District
- Stephenville ISD
- NCES district ID
- 4841520
- Math proficiency
- 53% ▼ -1.00%
- Reading proficiency
- 48% ▼ -4.00%
- Median HH income
- $39,565
- Composite
- 42.23/100
- National rank
- #3283
- State rank
- #191 of 826 in TX
Livability — Stephenville
- Score
- 75/100
- State rank
- #124
- US rank
- #3840
Category grades
Schools grade is shown separately in the Schools card above.
Census & demographics
- Census place
- Stephenville, TX
- County
- Erath County · 31,375 people
- City population
- 31,375
- Metro
- Stephenville, TX
- Population (ZIP)
- 31,375
- Household income
- $61,210
- Rent vs Own
- Severe rent burden
- 1758.0
Population outlook (Erath County) Hauer SSP2
- Today (2025)
- 50,437 people
- By 2030
- 55,510 · +10.1%
- By 2040
- 66,379 · +31.6%
- By 2050
- 77,981 · +54.6%
- By 2075
- 109,727 · +117.6%
- By 2100
- 132,574 · +162.9%
Race, ethnicity, and origin ACS 2023
- Neighborhood character
- Predominantly White (76%)
- Race & ethnicity
- White 76% Hispanic / Latino 18% Two or more races 8% Black 2% Asian 1%
- Hispanic origin (detail)
- Mexican 15%
- Common ancestry
- Slovak 2% Italian 1% Serbian 1%
- Foreign-born
- 5% · Canada, China
- Languages at home
- 88% English-only · Spanish 10% Chinese 1%
Political lean MEDSL · Erath
- 2024 margin
- Solid R (+68.0) · D 15.7% · R 83.7%
- 2008→2024 swing
- -13.5pp toward R · 2008: -54.5pp · 2024: -68.0pp
- All cycles
- 2024: R+68.0 2020: R+63.9 2016: R+65.5 2012: R+67.1 2008: R+54.5
Not yet ingested
- Civics
- —
Market trends
- HPI YoY
- ▼ -133.71%
- Current HPI
- 234.4986
- Rent YoY
- ▲ 0.07%
- Metro
- Stephenville, TX
- State GDP YoY
- ▲ 3.95%
- F500 in state
- 110
Industry mix (Fortune 500 HQ in TX)
| Industry | F500 HQs | Revenue |
|---|---|---|
| Energy | 16 | $1,198B |
|
||
| Technology | 5 | $198B |
|
||
| Engineering / Construction | 4 | $72B |
|
||
| Energy Services | 3 | $60B |
|
||
| Utilities | 3 | $41B |
|
||
| Healthcare | 2 | $330B |
|
||
Price history
-12.1% since first listed7 events — show timeline
- 2026-06-04 Sold (MLS) — NTREIS
- 2026-06-03 Pending — NTREIS
- 2026-05-28 Contingent — NTREIS
- 2026-05-23 Price Changed $145,000 NTREIS
- 2026-05-12 Listed $165,000 NTREIS
- 1996-07-23 Sold (Public Records) — Public Records
- 1996-07-23 Sold (Public Records) — Public Records
Property tax history
+7.8%/yrLatest (2025): $3,149 · -2.0% YoY. Source: county tax records.
Cash-flow waterfall
monthlySold comps — $/sqft
last 12 mo · ≤1 miLoading sold comps…