184 Ivy Rd · Yogaville, VA
Flood risk 1/10 · Minimal
- FEMA flood zone
- X (unshaded)
- Chance of flooding over 30 yrs
- 0.0%
- Est. flood insurance / yr
- $507 – $1,088
Fire risk 4/10 · Minor
- Est. fire insurance / yr
- $666 – $1,236
Heat risk 5/10 · Moderate
- Hot days now (above 104°F)
- 7 days/yr
- Hot days in 30 yrs
- 16 days/yr
Wind risk 3/10 · Minor
- Chance of severe wind over 30 yrs
- 4.0%
Air-quality risk 2/10 · Minimal
- Unhealthy air days now
- 0 days/yr
- Unhealthy air days in 30 yrs
- 1 days/yr
Risk factors via First Street. Map © Google.
Why this score? — see what drove the D grade
The composite is a weighted blend of 9 inputs, each scored 0–100. Each bar is that input's sub-score; the figure is the points it added to the 100-point composite (weight × sub-score).
- ARV discount +10.7/15.0
- Cash flow +9.1/30.0
- Appreciation +6.4/10.0
- Schools +3.6/10.0
- Livability +2.9/5.0
- DSCR +2.5/10.0
- Rent growth +2.5/5.0
- Condition / age +2.5/5.0
- 1% rule +1.8/10.0
$209,900
🖨 Deal sheet 📄 Offer letter ✓ Due diligence
Listing remarks MLS
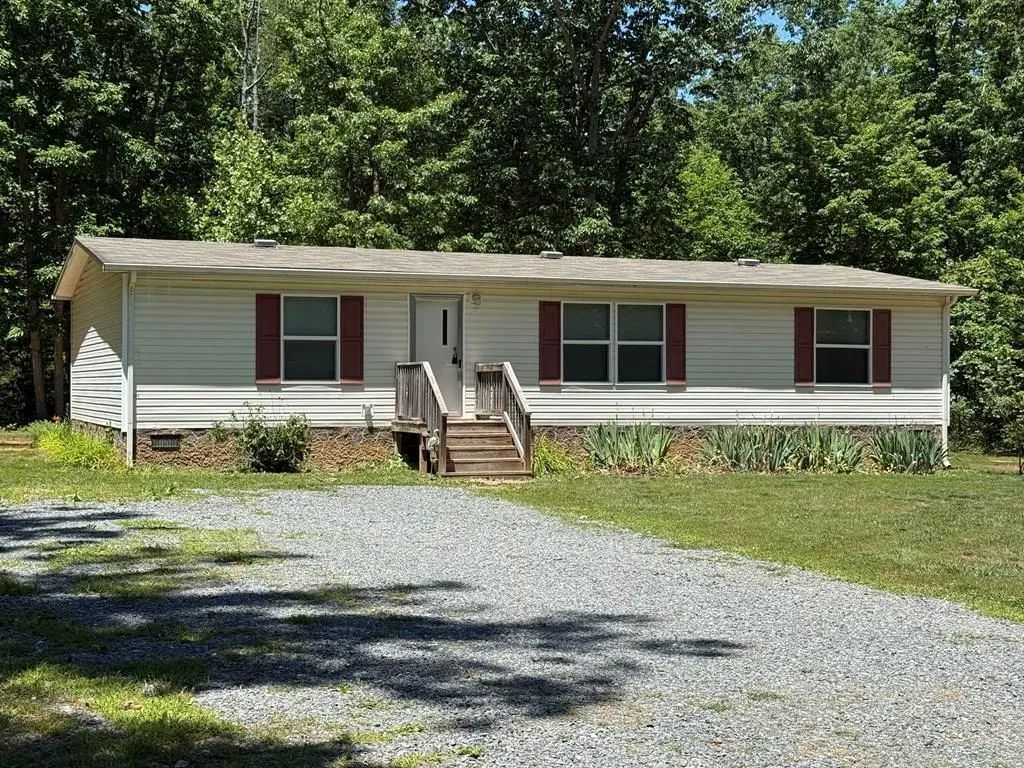
Don't miss this beautifully maintained 3-bedroom, 2-bath home situated on a spacious and private lot. This well-kept property offers comfortable living with plenty of room to relax and entertain. Enjoy the peace and privacy of the surrounding outdoor space while still being conveniently located to local amenities. Features include: 3 spacious bedrooms 2 full bathrooms Private lot Well-maintained interior and exterior Spacious living areas Move-in ready condition Whether you're looking for your first home, a place to grow, or a peaceful retreat, this property has plenty to offer. Schedule a showing today and see all that this wonderful home has to offer!
Key facts
- Private lot
- Built 2016
- Listed 5 days
Tags
Property features AI
Exterior
- Utilities: Private well water; Septic tank sewer
- Home design: Single-story home
- Construction: Built with block and vinyl siding; Composition roof
- Exterior features: Above-grade finished and unfinished area reported
Interior
- Kitchen: Kitchen on the first floor with vinyl flooring
- Bedrooms: Three bedrooms on the first floor (carpeted)
- Flooring: Carpet in living areas and bedrooms; Vinyl in kitchen, dining area, and laundry
- Bathrooms: Two full bathrooms (one with tub & shower)
- Heating & cooling: Heat pump for heating and cooling; Electric heating
- Interior features: 8 total rooms; Resale condition
- Laundry & utility: First-floor laundry room with vinyl flooring
Neighborhood map
What this means for you Summary
Snapshot
- This is a 3-bed/2.0-bath single-family listed at $210k.
Deal economics
- At list price, monthly cash flow is $-163 ($-2k/yr) — negative.
- To cash-flow at today's rent, offer at most $181k (13.7% below list).
- To meet the 1% rule (rent ≥ 1% of price), the offer needs to be $142k (32.1% below list).
- Recommended offer: $142k (32.1% below list) — sets the bar for 1% rule.
Location & tenants
- Location reads 57/100 on livability (#495 in VA) — a working-class tenant base; expect higher turnover. Strengths: cost of living A+, crime A; Watch: schools C-, amenities F, commute F.
- Buckingham County Public School District (rural): math 36% / reading 49% proficiency, ranked #117 of 131 in VA (top 89%) — families likely to look elsewhere, expect single-tenant / working-renter base with shorter leases; 60% free/reduced lunch — lower-income household profile, screen leases tightly.
- Market conditions: 16 active listings in the ZIP; 96 units permitted in Buckingham County in 2024 (0 in 5+ unit buildings).
Forward outlook
- In year one you build about $7k of equity ($1k loan paydown + $6k appreciation (2.8% local appreciation)).
- Buckingham County population projected to shrink 8% by 2050 — rents likely to lag national; underwrite the cash flow, not the appreciation.
- By year 5, paydown + projected appreciation supports a ~$32k cash-out refi (75% LTV) — recoverable capital for the next deal without selling this one.
Negotiation context
- Only 5 days on market — expect competitive offers; lowballing is unlikely to land.
- 3 sale attempts with the ask held roughly flat each time — persistent listings suggest the price (not the market) is what's stuck; bring a comps-based counter.
Risks & watch-outs
- Climate carrying-cost: extreme-heat days projected 7→16/yr by 2055 (HVAC capex compounding) — expect insurance premiums to compound above CPI over the hold.
Questions for the listing agent
- What do current leases actually rent for vs. the listed asking? Can we see a recent rent roll and the last 12 months of T-12 income?
- Is there a deadline driving the sale (1031 exchange, divorce, estate, relocation)? That informs how much negotiation room exists.
- The area grade is low — what's the realistic commute time and amenity access for the typical tenant pool here? Any planned neighborhood developments (good or bad) we should know about?
- What's the average days-on-market for RENTAL listings here right now (not sales)? A rising rental-DOM trend means longer vacancies and softer asking-rent achievability than the comps imply.
- What's the recent tenant-quality profile in this submarket — average credit score on applications, eviction rate, late-payment / NSF rate, and stable-employment percentage? A property-management company in the area should have these aggregated.
- How much new for-sale + rental construction is in the pipeline within 1–3 miles? Heavy new supply typically softens prices + rents 12–24 months out; constrained supply supports both.
Investment metrics
- 1% rule
- 0.68% ✗
- Cap rate
- 5.36%
- Cash-on-cash
- -3.33%
- DSCR
- 0.85
- GRM
- 12.3
CMA / ARV
- ARV (on-the-fly)
- $225,792
- Comps found
- 6
Show comp detail 6 sales within ~0.75 mi
| Address | Dist | Beds/Ba | Sqft | Sold | Price | $/sf | Match |
|---|---|---|---|---|---|---|---|
| 184 Ivy | 0.00mi | 3/2.0 | 1,344 (0%) | 15mo | $175,000 | $130 | 88 |
| 579 Glenmore Rd | 0.22mi | 3/2.0 | 1,260 (-6%) | 9mo | $230,000 | $183 | 72 |
| 373 Ivy Rd | 0.14mi | 3/2.0 | 1,188 (-12%) | 10mo | $239,900 | $202 | 66 |
| 430 Glenmore Rd | 0.25mi | 2/2.0 (-1) | 1,313 (-2%) | 19mo | $220,000 | $168 | 64 |
| 319 Ivy Rd | 0.15mi | 3/2.0 | 1,188 (-12%) | 15mo | $175,000 | $147 | 61 |
| 373 Ivy | 0.16mi | 3/2.0 | 1,188 (-12%) | 15mo | $175,000 | $147 | 61 |
Match score weights: distance 35% · size 25% · config 20% · recency 20%. Top-matched comps best support the ARV.
Projected returns pro-forma
2.82% appreciation · 3.0% rent growth · sell at horizon
- IRR
- 3.8%
- Equity multiple
- 1.22×
- Total profit
- $12,827
- Equity at exit
- $92,254
- IRR
- 7.2%
- Equity multiple
- 2.07×
- Total profit
- $62,640
- Equity at exit
- $140,544
Cash invested: $58,772 (down + closing). Projections, not guarantees.
Landlord ↔ Tenant lean methodology
- Overall (STATE)
- 55 Moderately Landlord-Leaning
- State Virginia
- 55 Moderately Landlord-Leaning · D+2
- County
- — inherits STATE
- City
- — inherits STATE
ZIP-level market 24562
- Home prices YoY
- 1.5%
- Active inventory
- 16
- Price-to-rent
- 12.3×
Monthly cashflow live
- Estimated rent
- $1,425 medium interval (Pro) →
- Mortgage (P&I)
- −$1,101
- Tax from tax record
- −$100 /mo · $1,203/yr
- Insurance
- −$87
- HOA
- −$0
- Vacancy / Maint / Mgmt
- −$299
- Net cashflow
- $-163
Break-even live
UW: 25.0% down · 7.5% · 30yr · 1.5% tax · 5.0% vac · 8.0% maint · 8.0% mgmt
Financing live
Cash to close
- Down payment
- $52,475
- Closing costs
- $6,297
- Reserves months
- —
- Total cash needed
- —
Loan-product check · same deal, 3 products live
Conventional
25% down · 7.5% · 30yr
- Down + closing
- —
- Monthly P&I
- —
- Monthly cashflow
- —
- DSCR
- —
- Eligible?
- —
Personal DTI + credit; lowest rate.
DSCR
20% down · 8.5% · 30yr
- Down + closing
- —
- Monthly P&I
- —
- Monthly cashflow
- —
- DSCR
- —
- Eligible?
- —
No personal income docs; deal must DSCR.
Hard money
10% down · 12.0% · 12mo
- Down + closing
- —
- Monthly P&I
- —
- Monthly cashflow
- —
- DSCR
- —
- Eligible?
- —
Short-term bridge; refi at stabilization.
Listing history 6 events
-
2026-06-13status $209,900 Pending 5 DOM
-
2026-06-10days on market $209,900 Active 5 DOM
-
2026-06-09days on market $209,900 Active 4 DOM
-
2026-06-08days on market $209,900 Active 3 DOM
-
2026-06-07remarks 669-char remark
-
2026-06-07$209,900 Active 2 DOM
ⓘ Source: listings_history table (triggers on properties + properties_extension) + one-shot
backfill from property_details.listing_events for pre-trigger history.
Tax reassessment forecast VA · Resets to sale price
- Current annual tax
- $1,203 · $100/mo
- Projected year-2 tax
- $1,721 · $143/mo
- Expected delta
- +$518/yr (+$43/mo · 43.1%)
ⓘ Screening estimate from a state-policy table — verify with the county assessor before closing.
Climate risk First Street
- Flood 1/10 Low FEMA zone X (unshaded) · 0% chance over 30 yrs
- Wildfire 4/10 Moderate
- Heat 5/10 Major 7 d/yr ≥104°F today · 16 d/yr by 30 yrs out
- Wind 3/10 Moderate 4% chance of damaging wind over 30 yrs
- Air quality 2/10 Low 0 unhealthy d/yr today · 1 by 30 yrs out
Nearby sold comps map
Loading sold comps map…
Walkable amenities ~0.75 mi
Loading nearby amenities…
Taxation est. · year 1
- Rental income
- $17,095
- − Mortgage interest
- −$11,758
- − Property taxes
- −$1,203
- − Insurance
- −$1,050
- − Repairs & maintenance
- −$1,368
- − Management
- −$1,368
- − Depreciation
- −$6,106
- Taxable loss
- −$5,756
- Est. tax savings @ 24.0%
- +$1,382
- After-tax cash flow
- $-575/yr
For passive investors: Depreciation is non-cash, so a rental often shows a tax loss while cash-flowing — sheltering income. Rental losses are passive: they offset passive income freely, and up to $25,000/yr can offset ordinary (W-2) income if you actively participate and your MAGI is under $100k (phasing out to $0 by $150k); unused losses carry forward. On sale, claimed depreciation is recaptured at up to 25%, and gains may owe capital-gains tax (a 1031 exchange can defer both). Figures are a year-1 estimate at your 24.0% rate — not tax advice; consult a CPA.
Schools (NCES district)
- District
- Buckingham County Public School District
- NCES district ID
- 5100540
- Math proficiency
- 36% ▼ -38.00%
- Reading proficiency
- 49% ▼ -12.00%
- Median HH income
- $40,158
- Composite
- 35.58/100
- National rank
- #4897
- State rank
- #117 of 131 in VA
Livability — Yogaville
- Score
- 57/100
- State rank
- #495
- US rank
- #21897
Category grades
Schools grade is shown separately in the Schools card above.
Census & demographics
- Population (ZIP)
- 619
Population outlook (Buckingham County) Hauer SSP2
- Today (2025)
- 16,866 people
- By 2030
- 16,625 · -1.4%
- By 2040
- 16,108 · -4.5%
- By 2050
- 15,588 · -7.6%
- By 2075
- 14,125 · -16.3%
- By 2100
- 11,701 · -30.6%
Race, ethnicity, and origin ACS 2023
- Neighborhood character
- Predominantly White (85%)
- Race & ethnicity
- White 85% Black 9% Two or more races 5%
- Common ancestry
- Slovak 8% Italian 7% Iranian 5%
- Foreign-born
- 6%
Political lean MEDSL · Buckingham
- 2024 margin
- Strong R (+23.5) · D 37.8% · R 61.2% · Other 1.0%
- 2008→2024 swing
- -24.4pp toward R · 2008: 0.9pp · 2024: -23.5pp
- All cycles
- 2024: R+23.5 2020: R+13.2 2016: R+11.6 2012: D+2.4 2008: D+0.9
Not yet ingested
- Civics
- —
Market trends
- HPI YoY
- ▲ 2.82%
- Current HPI
- 189.4192
- Rent YoY
- —
- Metro
- —
- State GDP YoY
- ▲ 2.40%
- F500 in state
- 50
Industry mix (Fortune 500 HQ in VA)
| Industry | F500 HQs | Revenue |
|---|---|---|
| Aerospace / Defense | 4 | $236B |
|
||
| Technology / Defense | 3 | $32B |
|
||
| Financial Services | 2 | $176B |
|
||
| Utilities | 2 | $27B |
|
||
| Insurance | 2 | $25B |
|
||
| Technology | 2 | $15B |
|
||
Price history
+0.0% since first listed3 events — show timeline
- 2026-06-05 Listed $209,900 CAAR
- 2026-06-05 Listed $209,900 SCAR
- 2026-06-05 Listed $209,900 CVRMLS
Property tax history
+30.6%/yrLatest (2026): $1,203 · +94.8% YoY. Source: county tax records.
Cash-flow waterfall
monthlySold comps — $/sqft
last 12 mo · ≤1 miLoading sold comps…