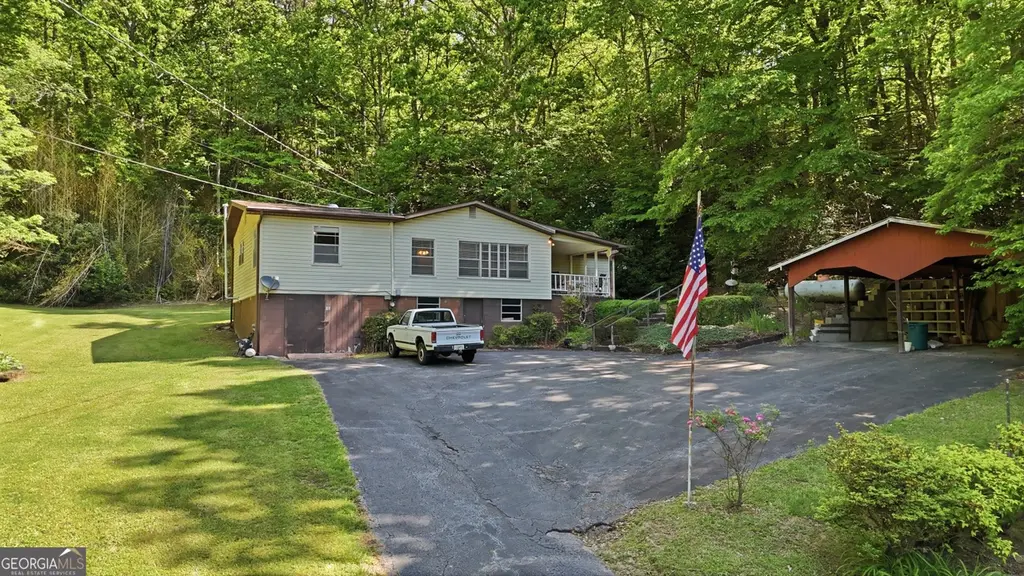
96 Bray Ln · Clayton, GA
Flood risk 1/10 · Minimal
- FEMA flood zone
- X (unshaded)
- Chance of flooding over 30 yrs
- 0.0%
- Est. flood insurance / yr
- $507 – $1,088
Fire risk 3/10 · Minor
- Est. fire insurance / yr
- $963 – $1,789
Heat risk 4/10 · Minor
- Hot days now (above 99°F)
- 7 days/yr
- Hot days in 30 yrs
- 19 days/yr
Wind risk 2/10 · Minimal
- Chance of severe wind over 30 yrs
- —
Air-quality risk 4/10 · Minor
- Unhealthy air days now
- 6 days/yr
- Unhealthy air days in 30 yrs
- 6 days/yr
Risk factors via First Street. Map © Google.
Why this score? — see what drove the D+ grade
The composite is a weighted blend of 9 inputs, each scored 0–100. Each bar is that input's sub-score; the figure is the points it added to the 100-point composite (weight × sub-score).
- ARV discount +15.0/15.0
- Cash flow +11.3/30.0
- Appreciation +5.3/10.0
- Schools +3.6/10.0
- DSCR +3.3/10.0
- Livability +3.3/5.0
- Rent growth +2.5/5.0
- Condition / age +2.5/5.0
- 1% rule +2.0/10.0
$249,000
🖨 Deal sheet (PDF) 📄 Offer letter ✓ Due diligence
Listing remarks
Sold AS-IS and priced accordingly for its current condition, this estate offers an opportunity to build instant equity in a prime location. GPS Friendly
Key facts
- 2.8 acre lot
- 4 parking spots
- Built 1952
Property features AI
Finance
- Other: Lot size approximately 2.8 acres
- Financial info: Listing sold as-is; Cash offers only
- HOA & community: No HOA
Exterior
- Parking: Carport; Open parking with parking pad; Basement access related to parking; Total parking for 4 vehicles
- Utilities: Public water; Public sewer; Electric service (220 Volts); Electricity available; Sewer connected; Water available
- Home design: Single-family house; Residential property; One story; Built in 1952
- Construction: Vinyl siding; Tar/gravel roof; Block and pillar/post/pier foundation
- Exterior features: Porch; Grassed yard; Sloped lot; City lot
Interior
- Kitchen: Dishwasher; Refrigerator; Gas water heater
- Bedrooms: Three bedrooms on the main level
- Flooring: Carpet; Vinyl
- Bathrooms: One full bathroom (main level)
- Heating & cooling: Propane heating; Ceiling fans; Electric cooling; Window AC units
- Interior features: One-level layout; Den; Exterior-entry, unfinished basement
- Laundry & utility: Washer included; Laundry closet
Neighborhood map
What this means for you Summary
Snapshot
- This is a 2-bed/1.0-bath single-family listed at $249k.
Deal economics
- At list price, monthly cash flow is $-91 ($-1k/yr) — negative.
- To cash-flow at today's rent, offer at most $233k (6.5% below list).
- To meet the 1% rule (rent ≥ 1% of price), the offer needs to be $174k (30.1% below list).
- Recommended offer: $174k (30.1% below list) — sets the bar for 1% rule.
- Cap rate 5.9% vs local median 3.7% in Clayton — top-decile yield for the area; either an underpriced asset or a hidden risk that comps aren't pricing in. Stress-test before assuming the spread holds.
Location & tenants
- Location reads 66/100 on livability (#197 in GA) — a middle-class / working-renter tenant base. Strengths: cost of living A+, health & safety A+, housing B+; Watch: crime D, schools F, amenities F.
- Rabun County (rural): math 42% / reading 44% proficiency, ranked #37 of 174 in GA (top 21%) — families likely to look elsewhere, expect single-tenant / working-renter base with shorter leases.
- Market conditions: 260 active listings in the ZIP; 2 comparable units currently listed for rent nearby; 147 units permitted in Rabun County in 2024 (0 in 5+ unit buildings).
Forward outlook
- In year one you build about $3k of equity ($2k loan paydown + $2k appreciation (0.7% local appreciation)).
- Rabun County population projected at -14% by 2050 — secular population decline; favor cash flow + early exit over multi-decade hold.
- By year 9, paydown + projected appreciation supports a ~$33k cash-out refi (75% LTV) — recoverable capital for the next deal without selling this one.
Negotiation context
- Only 3 days on market — expect competitive offers; lowballing is unlikely to land.
Risks & watch-outs
- Watch-outs: built in 1952 — expect roof / HVAC / electrical / plumbing capex.
Questions for the listing agent
- What do current leases actually rent for vs. the listed asking? Can we see a recent rent roll and the last 12 months of T-12 income?
- Built in 1952 — when were the roof, HVAC, electrical panel, plumbing, and water heater last replaced?
- Is there a deadline driving the sale (1031 exchange, divorce, estate, relocation)? That informs how much negotiation room exists.
- Schools are F-rated, which usually means shorter tenancies and higher turnover. Who's the typical renter profile here, and what's been the actual vacancy rate?
- Crime grade is D in this area — have there been break-ins, vandalism, or insurance claims at this property in the last 3 years? What carrier currently insures it and at what premium?
- The area grade is low — what's the realistic commute time and amenity access for the typical tenant pool here? Any planned neighborhood developments (good or bad) we should know about?
- What's the average days-on-market for RENTAL listings here right now (not sales)? A rising rental-DOM trend means longer vacancies and softer asking-rent achievability than the comps imply.
- What's the recent tenant-quality profile in this submarket — average credit score on applications, eviction rate, late-payment / NSF rate, and stable-employment percentage? A property-management company in the area should have these aggregated.
- How much new for-sale + rental construction is in the pipeline within 1–3 miles? Heavy new supply typically softens prices + rents 12–24 months out; constrained supply supports both.
Investment metrics
- 1% rule
- 0.70% ✗
- Cap rate
- 5.85%
- Cash-on-cash
- -1.57%
- DSCR
- 0.93
- GRM
- 11.9
CMA / ARV
- ARV (on-the-fly)
- $300,564
- Comps found
- 6
Show comp detail 6 sales within ~0.75 mi
| Address | Dist | Beds/Ba | Sqft | Sold | Price | $/sf | Match |
|---|---|---|---|---|---|---|---|
| 43 Norman Cir | 0.38mi | 1/1.0 (-1) | 1,156 (-3%) | 2mo | $305,000 | $264 | 71 |
| 42 Broker Ln | 0.55mi | 3/2.0 (+1) | 1,120 (-6%) | 16mo | $289,000 | $258 | 43 |
| 241 S Main St | 0.74mi | 2/1.0 | 1,256 (+6%) | 18mo | $210,000 | $167 | 41 |
| 152 Toole St | 0.54mi | 3/2.0 (+1) | 1,296 (+9%) | 15mo | $135,000 | $104 | 39 |
| 172 Toole St | 0.54mi | 3/2.0 (+1) | 1,293 (+9%) | 17mo | $327,000 | $253 | 37 |
| 36 Jericho Ln | 0.56mi | 3/2.0 (+1) | 1,040 (-12%) | 22mo | $215,000 | $207 | 26 |
Match score weights: distance 35% · size 25% · config 20% · recency 20%. Top-matched comps best support the ARV.
Projected returns pro-forma
0.68% appreciation · 3.0% rent growth · sell at horizon
- IRR
- -1.5%
- Equity multiple
- 0.93×
- Total profit
- $-5,198
- Equity at exit
- $80,852
- IRR
- 3.6%
- Equity multiple
- 1.42×
- Total profit
- $29,467
- Equity at exit
- $104,304
Cash invested: $69,720 (down + closing). Projections, not guarantees.
Landlord ↔ Tenant lean methodology
- Overall (STATE)
- 90 Strongly Landlord-Friendly
- State Georgia
- 90 Strongly Landlord-Friendly · R+3
- County
- — inherits STATE
- City
- — inherits STATE
ZIP-level market 30525
- Home prices YoY
- 0.2%
- Active inventory
- 260
- Price-to-rent
- 11.9×
Monthly cashflow live
- Estimated rent
- $1,740 medium interval (Pro) →
- Mortgage (P&I)
- −$1,306
- Tax from tax record
- −$57 /mo · $679/yr
- Insurance
- −$104
- HOA
- −$0
- Vacancy / Maint / Mgmt
- −$365
- Net cashflow
- $-91
Break-even live
Sensitivity live
| Price | -10% $50 | -5% $-21 | +0% $-91 | +5% $-162 | +10% $-232 |
|---|---|---|---|---|---|
| Rent | -10% $-229 | -5% $-160 | +0% $-91 | +5% $-23 | +10% $46 |
| Rate | -1.0pp $34 | -0.5pp $-28 | base $-91 | +0.5pp $-156 | +1.0pp $-222 |
UW: 25.0% down · 7.5% · 30yr · 1.5% tax · 5.0% vac · 8.0% maint · 8.0% mgmt
Financing live
Cash to close
- Down payment
- $62,250
- Closing costs
- $7,470
- Reserves months
- —
- Total cash needed
- —
Loan-product check · same deal, 3 products live
Conventional
25% down · 7.5% · 30yr
- Down + closing
- —
- Monthly P&I
- —
- Monthly cashflow
- —
- DSCR
- —
- Eligible?
- —
Personal DTI + credit; lowest rate.
DSCR
20% down · 8.5% · 30yr
- Down + closing
- —
- Monthly P&I
- —
- Monthly cashflow
- —
- DSCR
- —
- Eligible?
- —
No personal income docs; deal must DSCR.
Hard money
10% down · 12.0% · 12mo
- Down + closing
- —
- Monthly P&I
- —
- Monthly cashflow
- —
- DSCR
- —
- Eligible?
- —
Short-term bridge; refi at stabilization.
Rent comps 2 comps
| Address | Beds | Baths | Sqft | Rent | $/sqft | DOM | Units | Dist |
|---|---|---|---|---|---|---|---|---|
| 37 Bynum St Clayton, GA | 1.0–2.0 | 1.0–2.0 | 890 | $1,800 | $2.02 | 4d | 6 | 0.47mi |
| 92 Bleckley Dr Clayton, GA | 2.0 | 2.0 | 1081 | $1,600 | $1.48 | 22d | 1 | 1.34mi |
Listing history 4 events
-
2026-06-07statusdays on market $249,000 Under Contract 3 DOM
-
2026-06-04days on market $249,000 New 2 DOM
-
2026-06-01remarks 152-char remark
-
2026-06-01$249,000 New 1 DOM
ⓘ Source: listings_history table (triggers on properties + properties_extension) + one-shot
backfill from property_details.listing_events for pre-trigger history.
Tax reassessment forecast GA · Resets to sale price
- Current annual tax
- $679 · $57/mo
- Projected year-2 tax
- $2,291 · $191/mo
- Expected delta
- +$1,612/yr (+$134/mo · 237.4%)
ⓘ Screening estimate from a state-policy table — verify with the county assessor before closing.
Climate risk First Street
- Flood 1/10 Low FEMA zone X (unshaded) · 0% chance over 30 yrs
- Wildfire 3/10 Moderate
- Heat 4/10 Moderate 7 d/yr ≥99°F today · 19 d/yr by 30 yrs out
- Wind 2/10 Low
- Air quality 4/10 Moderate 6 unhealthy d/yr today · 6 by 30 yrs out
Nearby sold comps map
Loading sold comps map…
Walkable amenities ~0.75 mi
Loading nearby amenities…
Taxation est. · year 1
- Rental income
- $20,882
- − Mortgage interest
- −$13,948
- − Property taxes
- −$679
- − Insurance
- −$1,245
- − Repairs & maintenance
- −$1,671
- − Management
- −$1,671
- − Depreciation
- −$7,244
- Taxable loss
- −$5,575
- Est. tax savings @ 24.0%
- +$1,338
- After-tax cash flow
- $241/yr
For passive investors: Depreciation is non-cash, so a rental often shows a tax loss while cash-flowing — sheltering income. Rental losses are passive: they offset passive income freely, and up to $25,000/yr can offset ordinary (W-2) income if you actively participate and your MAGI is under $100k (phasing out to $0 by $150k); unused losses carry forward. On sale, claimed depreciation is recaptured at up to 25%, and gains may owe capital-gains tax (a 1031 exchange can defer both). Figures are a year-1 estimate at your 24.0% rate — not tax advice; consult a CPA.
Schools (NCES district)
- District
- Rabun County
- NCES district ID
- 1304320
- Math proficiency
- 42% ▼ -17.00%
- Reading proficiency
- 44% ▼ -4.00%
- Median HH income
- $35,980
- Composite
- 35.64/100
- National rank
- #4882
- State rank
- #37 of 174 in GA
Livability — Clayton
- Score
- 66/100
- State rank
- #197
- US rank
- #12208
Category grades
Schools grade is shown separately in the Schools card above.
Census & demographics
- Census place
- Clayton, GA
- Population (ZIP)
- 7,265
Population outlook (Rabun County) Hauer SSP2
- Today (2025)
- 16,227 people
- By 2030
- 16,000 · -1.4%
- By 2040
- 15,213 · -6.2%
- By 2050
- 13,974 · -13.9%
- By 2075
- 10,717 · -34.0%
- By 2100
- 7,824 · -51.8%
Race, ethnicity, and origin ACS 2023
- Neighborhood character
- Predominantly White (88%)
- Race & ethnicity
- White 88% Hispanic / Latino 8% Two or more races 8%
- Hispanic origin (detail)
- Mexican 7%
- Common ancestry
- Serbian 4% Slovak 3% Romanian 2%
- Foreign-born
- 5% · Canada
- Languages at home
- 91% English-only · Spanish 8% Other Indo-European 1%
Political lean MEDSL · Rabun
- 2024 margin
- Solid R (+56.9) · D 21.3% · R 78.2%
- 2008→2024 swing
- -11.0pp toward R · 2008: -45.9pp · 2024: -56.9pp
- All cycles
- 2024: R+56.9 2020: R+57.4 2016: R+60.9 2012: R+56.4 2008: R+45.9
Not yet ingested
- Civics
- —
Market trends
- HPI YoY
- ▲ 0.68%
- Current HPI
- 310.5456
- Rent YoY
- —
- Metro
- —
- State GDP YoY
- ▲ 2.66%
- F500 in state
- 28
Industry mix (Fortune 500 HQ in GA)
| Industry | F500 HQs | Revenue |
|---|---|---|
| Paper / Packaging | 2 | $29B |
|
||
| Retail | 1 | $160B |
|
||
| Transportation / Logistics | 1 | $91B |
|
||
| Airlines | 1 | $62B |
|
||
| Consumer Goods | 1 | $47B |
|
||
| Utilities | 1 | $25B |
|
||
Price history
1 event — show timeline
- 2026-06-01 Listed $249,000 GAMLS
Property tax history
+5.3%/yrLatest (2025): $679 · +46.0% YoY. Source: county tax records.
Cash-flow waterfall
monthlySold comps — $/sqft
last 12 mo · ≤1 miLoading sold comps…