17890 W Dixie Hwy #307 · Ojus, FL
Flood risk 7/10 · Major
- FEMA flood zone
- X
- Chance of flooding over 30 yrs
- 0.76%
- Est. flood insurance / yr
- $507 – $1,088
Fire risk 1/10 · Minimal
- Est. fire insurance / yr
- $947 – $1,759
Heat risk 10/10 · Severe
- Hot days now (above 104°F)
- 7 days/yr
- Hot days in 30 yrs
- 24 days/yr
Wind risk 10/10 · Severe
- Chance of severe wind over 30 yrs
- 99.0%
Air-quality risk 2/10 · Minimal
- Unhealthy air days now
- 1 days/yr
- Unhealthy air days in 30 yrs
- 2 days/yr
Risk factors via First Street. Map © Google.
Why this score? — see what drove the B+ grade
The composite is a weighted blend of 9 inputs, each scored 0–100. Each bar is that input's sub-score; the figure is the points it added to the 100-point composite (weight × sub-score).
- Cash flow +29.6/30.0
- 1% rule +10.0/10.0
- DSCR +10.0/10.0
- ARV discount +7.5/15.0
- Appreciation +5.3/10.0
- Schools +4.2/10.0
- Livability +4.2/5.0
- Rent growth +2.7/5.0
- Condition / age +2.5/5.0
$305,000
🖨 Deal sheet 📄 Offer letter ✓ Due diligence
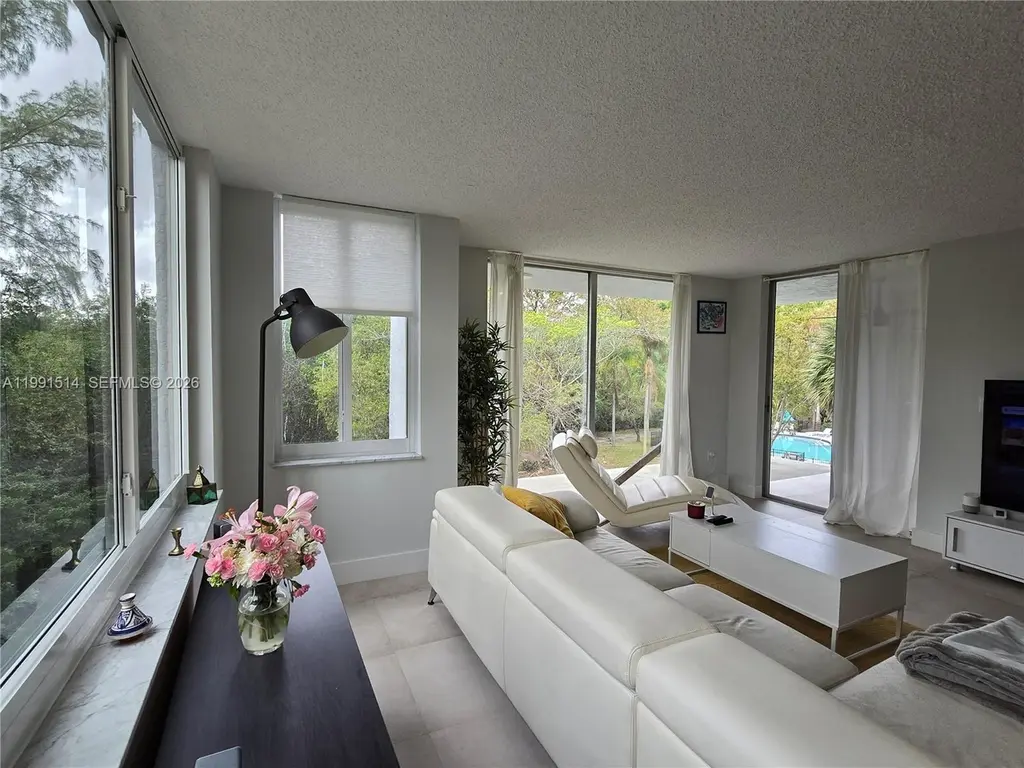
Listing remarks
Welcome! It is a pleasure to present to you this elegant, bright 1652 sq ft 3/2 condo in Greynolds Park Club, offering one of the most stunning views in the building with trees, pool and open sky as your backdrop. FEAUTURES: Updated corner unit plenty of windows and light. Beautiful and contemporary floor; new impact windows. Large kitchen overlooking nature, stainless steel appliances, custom-made cabinets. Big master bedroom with two walking closets and bathroom. Plenty of closets and laundry room(hook up). Oversized balcony. Two parking spaces. BUILDING UPDATES: The building has undergone significant updates, including a new roof(finished) and impact windows, concrete and restoration wit
Key facts
- Oversized balcony
- Large kitchen
- Updated corner unit
Tags
Property features AI
Finance
- Other: Community of 138 units; Pets allowed (yes) with maximum 20 lb size limit
- Financial info: Association fee covers management, common areas, insurance, laundry, legal/accounting, grounds maintenance, structural maintenance, parking, pool(s), recreation facilities, reserve fund, roof, sewer, security, trash, and water
- HOA & community: Monthly association fee; Association amenities: bike storage, clubhouse, fitness center, laundry, barbecue/picnic area, pool, elevators
Exterior
- Parking: Detached covered garage; Assigned parking; Two covered spaces (garage)
- Security: Security system; Closed-circuit cameras; Complex fenced; Doorman; Fire alarm; Key card entry; Phone entry; Security guard; Intercom
- Utilities: Water service included in association; Sewer included in association; Electric water heater; Central HVAC
- Home design: Attached property; 7-story building; Entry on 3rd level; Updated/remodeled
- Construction: Block construction; Resale building
- Exterior features: Balcony (open and screened); Barbecue area; Fence; Association pool; Riverfront view; Exterior lighting; Has view; East-facing
Interior
- Kitchen: Dishwasher; Electric range; Microwave; Refrigerator; Garbage disposal; Electric water heater
- Bedrooms: Bedroom on main level
- Bathrooms: 2 full bathrooms
- Heating & cooling: Central heating; Central air conditioning
- Interior features: Impact glass windows; First-floor entry; Living/dining room; Main living area on entry level; Walk-in closets; Unfurnished; Intercom
- Laundry & utility: Washer hookup in common area; Dryer hookup in common area; Laundry facilities
Neighborhood map
What this means for you Summary
Snapshot
- This is a 3-bed/2.0-bath condo listed at $305k.
Deal economics
- At list price, monthly cash flow is $1k ($12k/yr) — positive.
- The deal already cash-flows at list — no discount required.
- Meets the 1% rule at list price ($5k rent vs $305k).
- Recommended offer: $287k (6.0% below list) — sets the bar for market timing.
- Cap rate 10.6% vs local median 8.7% in Ojus — meaningfully above typical; check what's discounted (condition, days-on-market, listing class) to confirm the premium yield is real.
Location & tenants
- Location reads 83/100 on livability (#58 in FL, #1,031 nationally) — a professional / high-income tenant draw. Strengths: commute A+, housing A+, health & safety A+; Watch: schools D+, amenities F.
- Miami-Dade (suburban): math 45% / reading 54% proficiency, ranked #40 of 73 in FL (top 55%) — families likely to look elsewhere, expect single-tenant / working-renter base with shorter leases; 64% free/reduced lunch — lower-income household profile, screen leases tightly.
- Market conditions: Rents flat; 1870 active listings in the ZIP; 10,051 units permitted in Miami-Dade County in 2024 (7,758 in 5+ unit buildings).
Forward outlook
- In year one you build about $4k of equity ($2k loan paydown + $2k appreciation (0.5% local appreciation)).
- Miami-Dade County population projected at +28% by 2050 — long-run rental-demand tailwind backs the buy-and-hold thesis.
- At projected returns (0.5% appreciation + 0.9% rent growth), your $85k cash investment doubles in ~6 years — after that, you're playing with house money.
- By year 8, paydown + projected appreciation supports a ~$32k cash-out refi (75% LTV) — recoverable capital for the next deal without selling this one.
Negotiation context
- It's been on market 79 days — a 6% lower offer ($287k) is reasonable based on typical stale-listing flexibility.
- 6 sale attempts since 6y ago; this cycle's ask has dropped $35k (10%) from the opening price — seller is motivated, your offer sets the floor, not the list.
- Current owner paid $190k; list at $305k implies a 61% gain — meaningful room to come down on a strong offer.
Risks & watch-outs
- Watch-outs: flood insurance adds $66/mo.
- Climate carrying-cost: major flood risk; severe wind risk, 99% chance of damaging wind over 30y; extreme-heat days projected 7→24/yr by 2055 (HVAC capex compounding) — expect insurance premiums to compound above CPI over the hold.
Questions for the listing agent
- It's been on market 79 days. Have you received any prior offers? Is the seller open to a 6% concession, seller financing, or rate buy-down credit?
- What's the actual annual flood-insurance premium (NFIP or private), and is the property in a SFHA with mandatory coverage?
- What does the HOA fee cover, when was the last increase, and are there any pending special assessments or reserve-fund shortfalls?
- Any open or pending special assessments — roof, HVAC, plumbing, elevator, façade? What's the per-unit balance and payoff schedule, and is the seller paying it off at close or rolling it to the buyer?
- Why hasn't it sold? Are there any deal-killer items the seller is aware of (foundation, flood, title, zoning, code violations)?
- Is there a deadline driving the sale (1031 exchange, divorce, estate, relocation)? That informs how much negotiation room exists.
- Schools are D-rated, which usually means shorter tenancies and higher turnover. Who's the typical renter profile here, and what's been the actual vacancy rate?
- What's the average days-on-market for RENTAL listings here right now (not sales)? A rising rental-DOM trend means longer vacancies and softer asking-rent achievability than the comps imply.
- What's the recent tenant-quality profile in this submarket — average credit score on applications, eviction rate, late-payment / NSF rate, and stable-employment percentage? A property-management company in the area should have these aggregated.
- How much new apartment / multifamily construction is in the pipeline within 1–3 miles? Heavy new supply (>2% of stock underway) typically softens rents 12–24 months out; light construction supports rent growth.
Investment metrics
- 1% rule
- 1.69% ✓
- Cap rate
- 10.63%
- Cash-on-cash
- 15.50%
- DSCR
- 1.69
- GRM
- 4.9
CMA / ARV
No comps found within radius.
Projected returns pro-forma
0.53% appreciation · 0.94% rent growth · sell at horizon
- IRR
- 13.3%
- Equity multiple
- 1.64×
- Total profit
- $54,882
- Equity at exit
- $96,683
- IRR
- 15.6%
- Equity multiple
- 2.67×
- Total profit
- $142,994
- Equity at exit
- $122,913
Cash invested: $85,400 (down + closing). Projections, not guarantees.
Landlord ↔ Tenant lean methodology
- Overall (STATE)
- 87 Strongly Landlord-Friendly
- State Florida
- 87 Strongly Landlord-Friendly · R+3
- County
- — inherits STATE
- City
- — inherits STATE
ZIP-level market 33160
- Home prices YoY
- 0.2%
- Rents YoY
- 0.9%
- Active inventory
- 1870
- Price-to-rent
- 4.9×
Monthly cashflow live
- Estimated rent
- $5,160 medium interval (Pro) →
- Mortgage (P&I)
- −$1,599
- Tax from tax record
- −$296 /mo · $3,553/yr
- Insurance
- −$127
- Flood insurance flood zone
- −$66 /mo · $798/yr
- HOA
- −$951
- Vacancy / Maint / Mgmt
- −$1,084
- Net cashflow
- $1,036
Break-even live
UW: 25.0% down · 7.5% · 30yr · 1.5% tax · 5.0% vac · 8.0% maint · 8.0% mgmt
Financing live
Cash to close
- Down payment
- $76,250
- Closing costs
- $9,150
- Reserves months
- —
- Total cash needed
- —
Loan-product check · same deal, 3 products live
Conventional
25% down · 7.5% · 30yr
- Down + closing
- —
- Monthly P&I
- —
- Monthly cashflow
- —
- DSCR
- —
- Eligible?
- —
Personal DTI + credit; lowest rate.
DSCR
20% down · 8.5% · 30yr
- Down + closing
- —
- Monthly P&I
- —
- Monthly cashflow
- —
- DSCR
- —
- Eligible?
- —
No personal income docs; deal must DSCR.
Hard money
10% down · 12.0% · 12mo
- Down + closing
- —
- Monthly P&I
- —
- Monthly cashflow
- —
- DSCR
- —
- Eligible?
- —
Short-term bridge; refi at stabilization.
HOA detail condo
- Monthly dues
- $951 · $11,412/yr
- Likely covers
- pool
- Assessments
- None detected in remarks — confirm with the listing agent.
Listing history 28 events
-
2026-06-18days on market $305,000 Active 79 DOM
-
2026-06-17pricedays on market $305,000 Active 78 DOM
-
2026-06-16days on market $340,000 Active 77 DOM
-
2026-06-15days on market $340,000 Active 76 DOM
-
2026-06-13days on market $340,000 Active 74 DOM
-
2026-06-09days on market $340,000 Active 70 DOM
-
2026-06-08days on market $340,000 Active 69 DOM
-
2026-06-07days on market $340,000 Active 68 DOM
-
2026-06-04days on market $340,000 Active 65 DOM
-
2026-06-03days on market $340,000 Active 64 DOM
-
2026-06-02days on market $340,000 Active 63 DOM
-
2026-06-01days on market $340,000 Active 62 DOM
-
2026-05-31days on market $340,000 Active 61 DOM
-
2026-03-30$340,000 Active
-
2026-01-31historical
-
2025-08-04$369,900 Active
-
2025-07-31historical
-
2025-06-18price $374,900
-
2025-01-31$379,900 Active
-
2025-01-27historical
-
2025-01-14$380,000 Active
-
2024-12-31historical
-
2024-08-01$415,000 Active
-
2020-05-20soldstatus $190,000 Closed
-
2020-04-29status Pending
-
2020-04-16price $214,900
-
2020-03-02$219,000 Active
-
1994-10-25soldstatus $70,000
ⓘ Source: listings_history table (triggers on properties + properties_extension) + one-shot
backfill from property_details.listing_events for pre-trigger history.
Tax reassessment forecast FL · Resets to sale price
- Current annual tax
- $3,553 · $296/mo
- Projected year-2 tax
- $3,553 · $296/mo
- Expected delta
- $0/yr ($0/mo · 0.0%)
ⓘ Screening estimate from a state-policy table — verify with the county assessor before closing.
Climate risk First Street
- Flood 7/10 Severe FEMA zone X · 76% chance over 30 yrs
- Wildfire 1/10 Low
- Heat 10/10 Extreme 7 d/yr ≥104°F today · 24 d/yr by 30 yrs out
- Wind 10/10 Extreme 99% chance of damaging wind over 30 yrs
- Air quality 2/10 Low 1 unhealthy d/yr today · 2 by 30 yrs out
Nearby sold comps map
Loading sold comps map…
Walkable amenities ~0.75 mi
Loading nearby amenities…
Taxation est. · year 1
- Rental income
- $61,919
- − Mortgage interest
- −$17,085
- − Property taxes
- −$3,553
- − Insurance
- −$2,322
- − Repairs & maintenance
- −$4,954
- − Management
- −$4,954
- − HOA
- −$11,412
- − Depreciation
- −$8,873
- Taxable income
- $8,767
- Est. tax owed @ 24.0%
- −$2,104
- After-tax cash flow
- $10,331/yr
For passive investors: Depreciation is non-cash, so a rental often shows a tax loss while cash-flowing — sheltering income. Rental losses are passive: they offset passive income freely, and up to $25,000/yr can offset ordinary (W-2) income if you actively participate and your MAGI is under $100k (phasing out to $0 by $150k); unused losses carry forward. On sale, claimed depreciation is recaptured at up to 25%, and gains may owe capital-gains tax (a 1031 exchange can defer both). Figures are a year-1 estimate at your 24.0% rate — not tax advice; consult a CPA.
Schools (NCES district)
- District
- Miami-Dade
- NCES district ID
- 1200390
- Math proficiency
- 45% ▼ -16.00%
- Reading proficiency
- 54% ▼ -5.00%
- Median HH income
- $43,928
- Composite
- 41.76/100
- National rank
- #3397
- State rank
- #40 of 73 in FL
Livability — Ojus
- Score
- 83/100
- State rank
- #58
- US rank
- #1031
Category grades
Schools grade is shown separately in the Schools card above.
Census & demographics
- Census place
- Ojus, FL
- County
- Miami-Dade County · 2,697,751 people
- City population
- 34,147
- Metro
- Miami-Fort Lauderdale-Pompano Beach, FL
- Population (ZIP)
- 43,718
- Household income
- $67,040
- Rent vs Own
- Severe rent burden
- 3106.0
Population outlook (Miami-Dade County) Hauer SSP2
- Today (2025)
- 3,126,439 people
- By 2030
- 3,325,765 · +6.4%
- By 2040
- 3,697,561 · +18.3%
- By 2050
- 4,012,134 · +28.3%
- By 2075
- 4,605,612 · +47.3%
- By 2100
- 4,866,598 · +55.7%
Race, ethnicity, and origin ACS 2023
- Neighborhood character
- Diverse neighborhood (Simpson 0.59)
- Race & ethnicity
- Hispanic / Latino 46% White 44% Two or more races 27% Black 4% Asian 2%
- Hispanic origin (detail)
- Mexican 1% Puerto Rican 3% Cuban 8% Dominican 1% Salvadoran 4%
- Common ancestry
- Scotch-Irish 8% Hispanic 3% Subsaharan African 3%
- Foreign-born
- 61% · Canada, Jamaica, Dominican Republic
- Languages at home
- 29% English-only · Spanish 45% Russian/Polish/Slavic 12% Other Indo-European 5%
Political lean MEDSL · Miami-Dade
- 2024 margin
- R (+11.4) · D 43.9% · R 55.4%
- 2008→2024 swing
- -27.6pp toward R · 2008: 16.1pp · 2024: -11.4pp
- All cycles
- 2024: R+11.4 2020: D+7.3 2016: D+29.6 2012: D+23.7 2008: D+16.1
Not yet ingested
- Civics
- —
Market trends
- HPI YoY
- ▲ 0.53%
- Current HPI
- 284.9293
- Rent YoY
- ▲ 0.94%
- Metro
- Miami-Fort Lauderdale-Pompano Beach, FL
- State GDP YoY
- ▲ 3.28%
- F500 in state
- 36
Industry mix (Fortune 500 HQ in FL)
| Industry | F500 HQs | Revenue |
|---|---|---|
| Industrial Technology | 2 | $29B |
|
||
| Insurance | 2 | $17B |
|
||
| Retail | 1 | $60B |
|
||
| Technology Distribution | 1 | $58B |
|
||
| Homebuilding | 1 | $35B |
|
||
| Technology Manufacturing | 1 | $35B |
|
||
Price history
+385.7% since first listed15 events — show timeline
- 2026-03-30 Listed $340,000 MARMLS
- 2026-01-31 Listing Removed — MARMLS
- 2025-08-04 Listed $369,900 MARMLS
- 2025-07-31 Listing Removed — MARMLS
- 2025-06-18 Price Changed $374,900 MARMLS
- 2025-01-31 Listed $379,900 MARMLS
- 2025-01-27 Listing Removed — MARMLS
- 2025-01-14 Listed $380,000 MARMLS
- 2024-12-31 Listing Removed — MARMLS
- 2024-08-01 Listed $415,000 MARMLS
- 2020-05-20 Sold (MLS) $190,000 MARMLS
- 2020-04-29 Pending — MARMLS
- 2020-04-16 Price Changed $214,900 MARMLS
- 2020-03-02 Listed $219,000 MARMLS
- 1994-10-25 Sold (Public Records) $70,000 Public Records
Property tax history
+3.5%/yrLatest (2025): $3,553 · +1.7% YoY. Source: county tax records.
Cash-flow waterfall
monthlySold comps — $/sqft
last 12 mo · ≤1 miLoading sold comps…