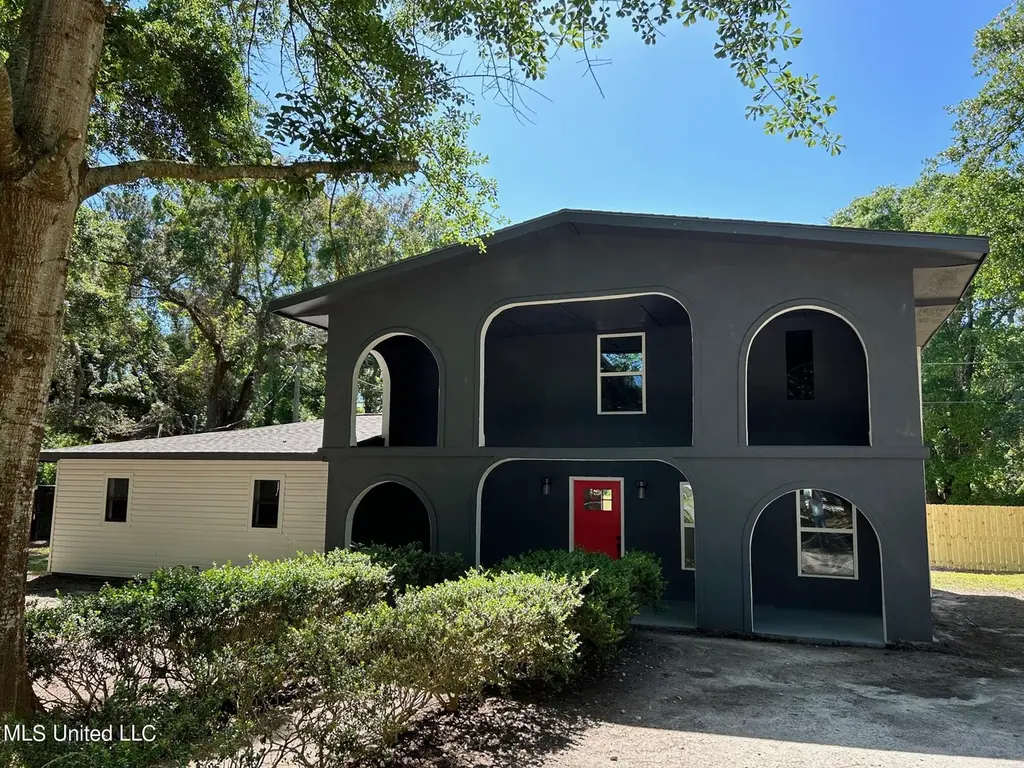
757 Highland Dr · Biloxi, MS
Flood risk 3/10 · Minor
- FEMA flood zone
- X (unshaded)
- Chance of flooding over 30 yrs
- 0.1%
- Est. flood insurance / yr
- $507 – $1,088
Fire risk 1/10 · Minimal
- Est. fire insurance / yr
- $1,241 – $2,305
Heat risk 10/10 · Severe
- Hot days now (above 106°F)
- 7 days/yr
- Hot days in 30 yrs
- 22 days/yr
Wind risk 9/10 · Severe
- Chance of severe wind over 30 yrs
- 99.0%
Air-quality risk 3/10 · Minor
- Unhealthy air days now
- 2 days/yr
- Unhealthy air days in 30 yrs
- 3 days/yr
Risk factors via First Street. Map © Google.
Why this score? — see what drove the B- grade
The composite is a weighted blend of 9 inputs, each scored 0–100. Each bar is that input's sub-score; the figure is the points it added to the 100-point composite (weight × sub-score).
- Cash flow +25.5/30.0
- ARV discount +15.0/15.0
- DSCR +8.5/10.0
- 1% rule +6.4/10.0
- Schools +4.5/10.0
- Livability +4.0/5.0
- Rent growth +3.2/5.0
- Condition / age +2.5/5.0
- Appreciation +0.0/10.0
$199,000
🖨 Deal sheet 📄 Offer letter ✓ Due diligence
Listing remarks MLS
Fantastic fully renovated 4 bed/3bath stucco home in Biloxi. This 2 story home is loaded with upscale appointments and desgin elements. Giant en-suite master bedroom sits off the first floor. Beautiful designer kitchen features tile back splash, granite countertops and custom cabinetry. Home offers large open living room that features brick fireplace . Both bathrooms have updated tiled sorrounds. Other interior features include fresh paint thoughout, new laminate flooring and upgraded lighting. Home sits on 1 acre lot. You won't want to miss out on this home, it has so much to offer. Make your showing appointment today,
Key facts
- Custom cabinetry
- Fully renovated
- Designer kitchen
Tags
Property features AI
Finance
- Other: Living area reported as 2,400 (source: public records)
Exterior
- Parking: Driveway
- Utilities: Public water; Public sewer; Electricity connected; Water connected; Sewer connected
- Home design: Single-family house; Two levels; Move-in ready
- Construction: Stucco exterior; Slab foundation; Built in public records (year built from public records)
- Exterior features: Asphalt shingle roof; Lot dimensions: 151' x 159' x 150' x 158'
Interior
- Kitchen: Dishwasher; Microwave; Granite counters
- Flooring: Carpet; Ceramic tile; Laminate
- Bathrooms: 3 full bathrooms
- Heating & cooling: Central heating; Central air; Ceiling fans
- Interior features: Ceiling fans; Crown molding; Double vanity; Granite counters; Walk-in closets; Living room fireplace
Neighborhood map
What this means for you Summary
Snapshot
- This is a 4-bed/2.0-bath single-family listed at $199k.
Deal economics
- At list price, monthly cash flow is $466 ($6k/yr) — positive.
- The deal already cash-flows at list — no discount required.
- Meets the 1% rule at list price ($2k rent vs $199k).
- Cap rate 9.1% vs local median 3.5% in Biloxi — top-decile yield for the area; either an underpriced asset or a hidden risk that comps aren't pricing in. Stress-test before assuming the spread holds.
Location & tenants
- Location reads 79/100 on livability (#6 in MS, #2,141 nationally) — a middle-class / working-renter tenant base. Strengths: crime A+, cost of living A+, housing A+; Watch: commute D+, amenities F, employment D-.
- Biloxi Public School District (urban): math 60% / reading 48% proficiency, ranked #7 of 130 in MS (top 5%) — acceptable for families but not a draw, mixed tenant base, ~2y average lease.
- Market conditions: Rents rising (+3.0%/yr); 392 active listings in the ZIP; 6 comparable units currently listed for rent nearby; rentals lingering (median 44d on market — plan ~5-8 weeks vacancy on turnover, expect pricing pressure); 67% of comp listings sitting > 30 days — soft ceiling on asking rent; 2,194 units permitted in Harrison County in 2024 (0 in 5+ unit buildings).
- This rent runs 40% of the median local income ($69k/yr) — at the standard rent-burdened threshold; future hikes will face affordability resistance.
Forward outlook
- Local home prices are declining (-3.0%/yr); year-one equity from $1k of loan paydown is wiped out by about $6k of value loss. Plan a longer hold.
- Harrison County population projected at +27% by 2050 — long-run rental-demand tailwind backs the buy-and-hold thesis.
Negotiation context
- Only 4 days on market — expect competitive offers; lowballing is unlikely to land.
- 3 sale attempts since 3y ago with the ask held roughly flat each time — persistent listings suggest the price (not the market) is what's stuck; bring a comps-based counter.
Risks & watch-outs
- Climate carrying-cost: severe wind risk, 99% chance of damaging wind over 30y; extreme-heat days projected 7→22/yr by 2055 (HVAC capex compounding) — expect insurance premiums to compound above CPI over the hold.
Questions for the listing agent
- Built in 1978 — when were the roof, HVAC, electrical panel, plumbing, and water heater last replaced?
- Is there a deadline driving the sale (1031 exchange, divorce, estate, relocation)? That informs how much negotiation room exists.
- What's the average days-on-market for RENTAL listings here right now (not sales)? A rising rental-DOM trend means longer vacancies and softer asking-rent achievability than the comps imply.
- What's the recent tenant-quality profile in this submarket — average credit score on applications, eviction rate, late-payment / NSF rate, and stable-employment percentage? A property-management company in the area should have these aggregated.
- How much new for-sale + rental construction is in the pipeline within 1–3 miles? Heavy new supply typically softens prices + rents 12–24 months out; constrained supply supports both.
Investment metrics
- 1% rule
- 1.14% ✓
- Cap rate
- 9.10%
- Cash-on-cash
- 10.04%
- DSCR
- 1.45
- GRM
- 7.3
CMA / ARV
- ARV (on-the-fly)
- $354,618
- Comps found
- 12
Show comp detail 12 sales within ~0.75 mi
| Address | Dist | Beds/Ba | Sqft | Sold | Price | $/sf | Match |
|---|---|---|---|---|---|---|---|
| 719 Holly Hills Dr | 0.35mi | 3/2.0 (-1) | 2,150 (-2%) | 2mo | $186,500 | $87 | 74 |
| 712 Champagne Dr | 0.29mi | 3/2.0 (-1) | 2,102 (-4%) | 1mo | $360,000 | $171 | 74 |
| 789 Sharon Hills Dr | 0.11mi | 4/2.0 | 1,876 (-14%) | 0mo | $255,000 | $136 | 71 |
| 730 Live Oak Dr | 0.23mi | 3/2.5 (-1) | 2,394 (+9%) | 1mo | $499,000 | $208 | 66 |
| 709 Champagne Dr | 0.27mi | 4/2.0 | 2,411 (+10%) | 7mo | $299,000 | $124 | 65 |
| 720 Oleander Ln | 0.65mi | 4/3.0 | 2,200 (+0%) | 1mo | $384,900 | $175 | 64 |
| 757 Canterbury Dr | 0.21mi | 3/2.0 (-1) | 1,920 (-12%) | 2mo | $265,000 | $138 | 64 |
| 2032 Englewood Dr | 0.70mi | 4/2.5 | 2,194 (+0%) | 2mo | $355,900 | $162 | 64 |
| 729 Canterbury Dr | 0.27mi | 3/2.0 (-1) | 2,407 (+10%) | 5mo | $235,000 | $98 | 61 |
| 882 Rustwood Dr | 0.53mi | 3/2.0 (-1) | 2,087 (-5%) | 6mo | $245,000 | $117 | 57 |
| 670 Mulberry Dr | 0.52mi | 3/2.0 (-1) | 2,372 (+8%) | 1mo | $435,000 | $183 | 56 |
| 717 Clover Pl | 0.75mi | 4/3.0 | 2,430 (+11%) | 1mo | $549,999 | $226 | 42 |
Match score weights: distance 35% · size 25% · config 20% · recency 20%. Top-matched comps best support the ARV.
Projected returns pro-forma
-3.0% appreciation · 2.98% rent growth · sell at horizon
- IRR
- -1.2%
- Equity multiple
- 0.95×
- Total profit
- $-2,587
- Equity at exit
- $29,672
- IRR
- 8.4%
- Equity multiple
- 1.64×
- Total profit
- $35,823
- Equity at exit
- $17,206
Cash invested: $55,720 (down + closing). Projections, not guarantees.
Landlord ↔ Tenant lean methodology
- Overall (STATE)
- 90 Strongly Landlord-Friendly
- State Mississippi
- 90 Strongly Landlord-Friendly · R+11
- County
- — inherits STATE
- City
- — inherits STATE
ZIP-level market 39532
- Rents YoY
- 3.0%
- Active inventory
- 392
- Price-to-rent
- 7.3×
Monthly cashflow live
- Estimated rent
- $2,270 high interval (Pro) →
- Mortgage (P&I)
- −$1,044
- Tax from tax record
- −$200 /mo · $2,406/yr
- Insurance
- −$83
- HOA
- −$0
- Vacancy / Maint / Mgmt
- −$477
- Net cashflow
- $466
Break-even live
UW: 25.0% down · 7.5% · 30yr · 1.5% tax · 5.0% vac · 8.0% maint · 8.0% mgmt
Financing live
Cash to close
- Down payment
- $49,750
- Closing costs
- $5,970
- Reserves months
- —
- Total cash needed
- —
Loan-product check · same deal, 3 products live
Conventional
25% down · 7.5% · 30yr
- Down + closing
- —
- Monthly P&I
- —
- Monthly cashflow
- —
- DSCR
- —
- Eligible?
- —
Personal DTI + credit; lowest rate.
DSCR
20% down · 8.5% · 30yr
- Down + closing
- —
- Monthly P&I
- —
- Monthly cashflow
- —
- DSCR
- —
- Eligible?
- —
No personal income docs; deal must DSCR.
Hard money
10% down · 12.0% · 12mo
- Down + closing
- —
- Monthly P&I
- —
- Monthly cashflow
- —
- DSCR
- —
- Eligible?
- —
Short-term bridge; refi at stabilization.
Rent comps 6 comps
| Address | Beds | Baths | Sqft | Rent | $/sqft | DOM | Units | Dist |
|---|---|---|---|---|---|---|---|---|
| 860 Leeward Dr Biloxi, MS | 4.0 | 2.0 | 1885 | $2,650 | $1.41 | 13d | 1 | 0.35mi |
| 1955 Popps Ferry Rd Biloxi, MS | 1.0–3.0 | 1.0–2.0 | 1347 | $1,647 | $1.22 | 43d | 1 | 0.48mi |
| 2171 Popps Ferry Rd Biloxi, MS | 4.0 | 2.0 | 1625 | $1,600 | $0.98 | 43d | 1 | 0.64mi |
| 630 Bay Cove Dr Biloxi, MS | 2.0–3.0 | 2.0 | 1780 | $3,450 | $1.94 | 43d | 2 | 1.37mi |
| 630 Bay Cove Dr #313 Biloxi, MS | 3.0 | 2.0 | 2310 | $3,450 | $1.49 | 21d | 1 | 1.37mi |
| 2411 Sunkist Country Club Rd Biloxi, MS | 3.0 | 2.0 | 1592 | $1,800 | $1.13 | 43d | 1 | 1.49mi |
Listing history 3 events
-
2026-06-13statusdays on market $199,000 Pending 4 DOM
-
2026-06-09remarks 645-char remark
-
2026-06-09$199,000 Active 1 DOM
ⓘ Source: listings_history table (triggers on properties + properties_extension) + one-shot
backfill from property_details.listing_events for pre-trigger history.
Tax reassessment forecast MS · Resets to sale price
- Current annual tax
- $2,406 · $200/mo
- Projected year-2 tax
- $2,406 · $200/mo
- Expected delta
- $0/yr ($0/mo · 0.0%)
ⓘ Screening estimate from a state-policy table — verify with the county assessor before closing.
Climate risk First Street
- Flood 3/10 Moderate FEMA zone X (unshaded) · 10% chance over 30 yrs
- Wildfire 1/10 Low
- Heat 10/10 Extreme 7 d/yr ≥106°F today · 22 d/yr by 30 yrs out
- Wind 9/10 Extreme 99% chance of damaging wind over 30 yrs
- Air quality 3/10 Moderate 2 unhealthy d/yr today · 3 by 30 yrs out
Nearby sold comps map
Loading sold comps map…
Walkable amenities ~0.75 mi
Loading nearby amenities…
Taxation est. · year 1
- Rental income
- $27,240
- − Mortgage interest
- −$11,147
- − Property taxes
- −$2,406
- − Insurance
- −$995
- − Repairs & maintenance
- −$2,179
- − Management
- −$2,179
- − Depreciation
- −$5,789
- Taxable income
- $2,545
- Est. tax owed @ 24.0%
- −$611
- After-tax cash flow
- $4,985/yr
For passive investors: Depreciation is non-cash, so a rental often shows a tax loss while cash-flowing — sheltering income. Rental losses are passive: they offset passive income freely, and up to $25,000/yr can offset ordinary (W-2) income if you actively participate and your MAGI is under $100k (phasing out to $0 by $150k); unused losses carry forward. On sale, claimed depreciation is recaptured at up to 25%, and gains may owe capital-gains tax (a 1031 exchange can defer both). Figures are a year-1 estimate at your 24.0% rate — not tax advice; consult a CPA.
Schools (NCES district)
- District
- Biloxi Public School District
- NCES district ID
- 2800630
- Math proficiency
- 60% ▼ -7.00%
- Reading proficiency
- 48% ▼ -3.00%
- Median HH income
- $40,608
- Composite
- 45.26/100
- National rank
- #2657
- State rank
- #7 of 130 in MS
Livability — Biloxi
- Score
- 79/100
- State rank
- #6
- US rank
- #2141
Category grades
Schools grade is shown separately in the Schools card above.
Census & demographics
- Census place
- Biloxi, MS
- County
- Harrison County · 178,171 people
- City population
- 63,281
- Metro
- Gulfport-Biloxi, MS
- Population (ZIP)
- 36,662
- Household income
- $68,710
- Rent vs Own
- Severe rent burden
- 954.0
Population outlook (Harrison County) Hauer SSP2
- Today (2025)
- 228,444 people
- By 2030
- 241,942 · +5.9%
- By 2040
- 267,531 · +17.1%
- By 2050
- 291,062 · +27.4%
- By 2075
- 346,711 · +51.8%
- By 2100
- 378,165 · +65.5%
Race, ethnicity, and origin ACS 2023
- Neighborhood character
- Predominantly White (69%)
- Race & ethnicity
- White 69% Black 15% Two or more races 9% Hispanic / Latino 6% Asian 4%
- Hispanic origin (detail)
- Mexican 2%
- Common ancestry
- Lithuanian 5% Italian 2% Serbian 2%
- Foreign-born
- 4% · Vietnam, Canada
- Languages at home
- 94% English-only · Spanish 2% Vietnamese 1% Other Indo-European 1%
Political lean MEDSL · Harrison
- 2024 margin
- Strong R (+28.9) · D 35.0% · R 63.9% · Other 1.1%
- 2008→2024 swing
- -2.9pp toward R · 2008: -26.0pp · 2024: -28.9pp
- All cycles
- 2024: R+28.9 2020: R+25.2 2016: R+30.7 2012: R+26.6 2008: R+26.0
Not yet ingested
- Civics
- —
Market trends
- HPI YoY
- ▼ -90.04%
- Current HPI
- 154.9975
- Rent YoY
- ▲ 2.98%
- Metro
- Gulfport-Biloxi, MS
- State GDP YoY
- —
- F500 in state
- 0
Price history
-33.4% since first listed16 events — show timeline
- 2026-06-08 Listed $199,000 MLSU
- 2023-11-13 Sold (MLS) — MLSU
- 2023-10-11 Pending — MLSU
- 2023-09-06 Price Changed $239,000 MLSU
- 2023-08-26 Price Changed $249,900 MLSU
- 2023-08-01 Price Changed $254,900 MLSU
- 2023-07-11 Price Changed $264,900 MLSU
- 2023-06-25 Price Changed $274,900 MLSU
- 2023-06-07 Price Changed $284,900 MLSU
- 2023-05-15 Price Changed $289,000 MLSU
- 2023-05-08 Relisted — MLSU
- 2023-05-08 Listing Removed — MLSU
- 2023-04-21 Listed $298,777 MLSU
- 2022-08-22 Sold (Public Records) — Public Records
- 2022-08-22 Sold (Public Records) — Public Records
- 2022-08-22 Sold (Public Records) — Public Records
Property tax history
+27.9%/yrLatest (2025): $2,406 · +58.6% YoY. Source: county tax records.
Cash-flow waterfall
monthlySold comps — $/sqft
last 12 mo · ≤1 miLoading sold comps…