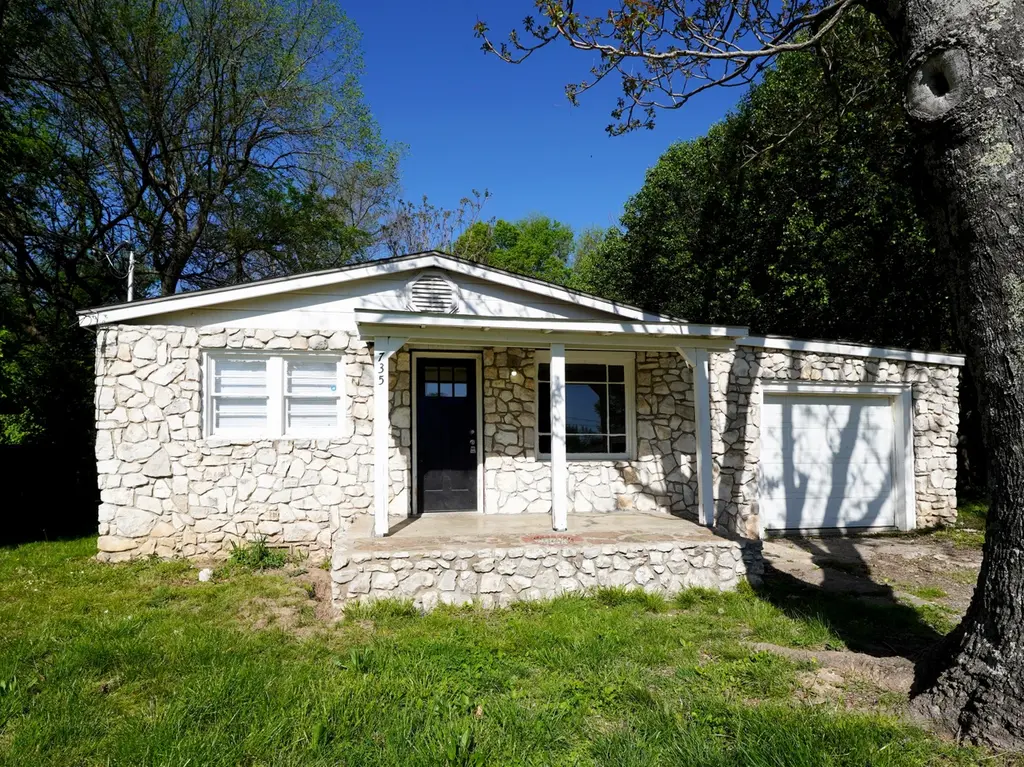
735 N Brown Ave · Springfield, MO
Flood risk 1/10 · Minimal
- FEMA flood zone
- X (unshaded)
- Chance of flooding over 30 yrs
- 0.0%
- Est. flood insurance / yr
- $507 – $1,088
Fire risk 1/10 · Minimal
- Est. fire insurance / yr
- $1,054 – $1,958
Heat risk 5/10 · Moderate
- Hot days now (above 104°F)
- 7 days/yr
- Hot days in 30 yrs
- 20 days/yr
Wind risk 2/10 · Minimal
- Chance of severe wind over 30 yrs
- 0.0%
Air-quality risk 2/10 · Minimal
- Unhealthy air days now
- 1 days/yr
- Unhealthy air days in 30 yrs
- 2 days/yr
Risk factors via First Street. Map © Google.
Why this score? — see what drove the C grade
The composite is a weighted blend of 9 inputs, each scored 0–100. Each bar is that input's sub-score; the figure is the points it added to the 100-point composite (weight × sub-score).
- Cash flow +17.7/30.0
- ARV discount +15.0/15.0
- DSCR +5.5/10.0
- 1% rule +4.0/10.0
- Livability +3.8/5.0
- Rent growth +3.7/5.0
- Schools +3.2/10.0
- Condition / age +2.5/5.0
- Appreciation +0.0/10.0
$115,000
🖨 Deal sheet 📄 Offer letter ✓ Due diligence
Listing remarks MLS
Charming Investment Opportunity in the Heart of Springfield!Discover the potential at 735 N Brown Ave, a solid single-family home just minutes from Downtown Springfield, OTC and MSU. This classic residence features a comfortable 1,209 sq. ft. floorplan with 3 bedrooms and 2 full baths, perfect for first-time buyers, downsizers, or investors seeking rental income.
Key facts
- 9,148 sq ft lot
- Garage
- Built 1900
Neighborhood map
What this means for you Summary
Snapshot
- This is a 2-bed/1.0-bath single-family listed at $115k.
Deal economics
- At list price, monthly cash flow is $93 ($1k/yr) — positive.
- The deal already cash-flows at list — no discount required.
- To meet the 1% rule (rent ≥ 1% of price), the offer needs to be $103k (10.2% below list).
- Recommended offer: $103k (10.2% below list) — sets the bar for 1% rule.
- Cap rate 7.3% vs local median 4.6% in Springfield — top-decile yield for the area; either an underpriced asset or a hidden risk that comps aren't pricing in. Stress-test before assuming the spread holds.
Location & tenants
- Location reads 75/100 on livability (#57 in MO, #4,121 nationally) — a middle-class / working-renter tenant base. Strengths: commute A+, cost of living A+, housing A+; Watch: crime F, employment F.
- Springfield R-XII (urban): math 32% / reading 46% proficiency, ranked #174 of 324 in MO (top 54%) — families likely to look elsewhere, expect single-tenant / working-renter base with shorter leases.
- Market conditions: Rents rising fast (+4.8%/yr); 512 active listings in the ZIP; 22 comparable units currently listed for rent nearby; rentals at typical pace (median 21d on market — plan ~3-4 weeks tenant-placement turnaround); 1,302 units permitted in Greene County in 2024 (250 in 5+ unit buildings).
Forward outlook
- Local home prices are declining (-3.0%/yr); year-one equity from $795 of loan paydown is wiped out by about $3k of value loss. Plan a longer hold.
- Greene County population projected at +25% by 2050 — long-run rental-demand tailwind backs the buy-and-hold thesis.
Negotiation context
- It's been on market 77 days — a 6% lower offer ($108k) is reasonable based on typical stale-listing flexibility.
- 6 sale attempts since 5y ago; this cycle's ask has dropped $10k (8%) from the opening price — seller is motivated, your offer sets the floor, not the list.
Risks & watch-outs
- Watch-outs: built in 1900 — expect roof / HVAC / electrical / plumbing capex.
- Climate carrying-cost: extreme-heat days projected 7→20/yr by 2055 (HVAC capex compounding) — expect insurance premiums to compound above CPI over the hold.
Questions for the listing agent
- It's been on market 77 days. Have you received any prior offers? Is the seller open to a 10% concession, seller financing, or rate buy-down credit?
- Built in 1900 — when were the roof, HVAC, electrical panel, plumbing, and water heater last replaced?
- Why hasn't it sold? Are there any deal-killer items the seller is aware of (foundation, flood, title, zoning, code violations)?
- Is there a deadline driving the sale (1031 exchange, divorce, estate, relocation)? That informs how much negotiation room exists.
- Crime grade is F in this area — have there been break-ins, vandalism, or insurance claims at this property in the last 3 years? What carrier currently insures it and at what premium?
- What's the average days-on-market for RENTAL listings here right now (not sales)? A rising rental-DOM trend means longer vacancies and softer asking-rent achievability than the comps imply.
- What's the recent tenant-quality profile in this submarket — average credit score on applications, eviction rate, late-payment / NSF rate, and stable-employment percentage? A property-management company in the area should have these aggregated.
- How much new for-sale + rental construction is in the pipeline within 1–3 miles? Heavy new supply typically softens prices + rents 12–24 months out; constrained supply supports both.
Investment metrics
- 1% rule
- 0.90% ✗
- Cap rate
- 7.26%
- Cash-on-cash
- 3.47%
- DSCR
- 1.15
- GRM
- 9.3
CMA / ARV
- ARV (median comp)
- $159,294
- List price
- $115,000
- Delta
- -27.81%
- Verdict
- UNDERPRICED
- Comps
- 20 within 1.0 mi
Show comp detail 12 sales within ~0.75 mi
| Address | Dist | Beds/Ba | Sqft | Sold | Price | $/sf | Match |
|---|---|---|---|---|---|---|---|
| 735 N Brown Ave | 0.00mi | 3/2.0 (+1) | 1,209 (0%) | 1mo | $115,000 | $95 | 90 |
| 1024 N Brown Ave | 0.24mi | 2/1.0 | 1,258 (+4%) | 2mo | $100,000 | $79 | 80 |
| 521 N Warren Ave | 0.30mi | 2/1.0 | 1,260 (+4%) | 2mo | $119,500 | $95 | 77 |
| 1027 Warren Ave | 0.35mi | 3/2.0 (+1) | 1,209 (0%) | 2mo | $180,000 | $149 | 73 |
| 1208 N Fulbright Ave | 0.40mi | 2/1.0 | 1,116 (-8%) | 0mo | $56,500 | $51 | 68 |
| 1205 N Drury Ave | 0.57mi | 3/2.0 (+1) | 1,160 (-4%) | 3mo | $185,000 | $159 | 55 |
| 2916 W Chestnut St | 0.47mi | 2/1.0 | 1,040 (-14%) | 3mo | $139,000 | $134 | 52 |
| 2914 W Chestnut St | 0.46mi | 3/1.0 (+1) | 1,040 (-14%) | 3mo | $129,000 | $124 | 48 |
| 2930 W Lynn St | 0.69mi | 3/1.0 (+1) | 1,317 (+9%) | 0mo | $149,900 | $114 | 48 |
| 2928 W Chestnut St | 0.49mi | 3/1.0 (+1) | 1,040 (-14%) | 3mo | $119,000 | $114 | 47 |
| 1120 N Colgate Ave | 0.69mi | 3/2.0 (+1) | 1,119 (-7%) | 2mo | $210,000 | $188 | 44 |
| 3036 W Water St | 0.75mi | 3/1.5 (+1) | 1,040 (-14%) | 1mo | $135,000 | $130 | 34 |
Match score weights: distance 35% · size 25% · config 20% · recency 20%. Top-matched comps best support the ARV.
Projected returns pro-forma
-3.0% appreciation · 4.82% rent growth · sell at horizon
- IRR
- -9.0%
- Equity multiple
- 0.66×
- Total profit
- $-10,811
- Equity at exit
- $17,147
- IRR
- 2.5%
- Equity multiple
- 1.20×
- Total profit
- $6,305
- Equity at exit
- $9,943
Cash invested: $32,200 (down + closing). Projections, not guarantees.
Landlord ↔ Tenant lean methodology
- Overall (STATE)
- 81 Strongly Landlord-Friendly
- State Missouri
- 81 Strongly Landlord-Friendly · R+10
- County
- — inherits STATE
- City
- — inherits STATE
ZIP-level market 65802
- Home prices YoY
- -31.9%
- Rents YoY
- 4.8%
- Active inventory
- 512
- Price-to-rent
- 9.3×
Monthly cashflow live
- Estimated rent
- $1,033 high interval (Pro) →
- Mortgage (P&I)
- −$603
- Tax from tax record
- −$72 /mo · $866/yr
- Insurance
- −$48
- HOA
- −$0
- Vacancy / Maint / Mgmt
- −$217
- Net cashflow
- $93
Break-even live
UW: 25.0% down · 7.5% · 30yr · 1.5% tax · 5.0% vac · 8.0% maint · 8.0% mgmt
Financing live
Cash to close
- Down payment
- $28,750
- Closing costs
- $3,450
- Reserves months
- —
- Total cash needed
- —
Loan-product check · same deal, 3 products live
Conventional
25% down · 7.5% · 30yr
- Down + closing
- —
- Monthly P&I
- —
- Monthly cashflow
- —
- DSCR
- —
- Eligible?
- —
Personal DTI + credit; lowest rate.
DSCR
20% down · 8.5% · 30yr
- Down + closing
- —
- Monthly P&I
- —
- Monthly cashflow
- —
- DSCR
- —
- Eligible?
- —
No personal income docs; deal must DSCR.
Hard money
10% down · 12.0% · 12mo
- Down + closing
- —
- Monthly P&I
- —
- Monthly cashflow
- —
- DSCR
- —
- Eligible?
- —
Short-term bridge; refi at stabilization.
Rent comps 22 comps
| Address | Beds | Baths | Sqft | Rent | $/sqft | DOM | Units | Dist |
|---|---|---|---|---|---|---|---|---|
| 741 N West Ave Springfield, MO | 2.0 | 1.0 | 912 | $950 | $1.04 | 43d | 1 | 0.05mi |
| 740 N West Ave Springfield, MO | 3.0 | 1.0 | 900 | $995 | $1.11 | 23d | 1 | 0.09mi |
| 922 N Glenn Ave Springfield, MO | 2.0 | 1.0 | 780 | $1,100 | $1.41 | 43d | 1 | 0.43mi |
| 2602 W College St Springfield, MO | 2.0 | 1.0 | 1350 | $995 | $0.74 | 13d | 1 | 0.57mi |
| 2541 W Lincoln St Springfield, MO | 2.0 | 1.0 | 1034 | $975 | $0.94 | 43d | 1 | 0.76mi |
| 2854 W Walnut St Springfield, MO | 3.0 | 1.0 | 945 | $995 | $1.05 | 21d | 1 | 0.78mi |
| 3016 W Hovey St Springfield, MO | 3.0 | 2.0 | 1059 | $1,350 | $1.27 | 43d | 1 | 0.78mi |
| 2412 W Lincoln St Springfield, MO | 3.0 | 1.0 | 1260 | $1,295 | $1.03 | 23d | 1 | 0.79mi |
| 1740 W Olive St Springfield, MO | 3.0 | 1.0 | 736 | $1,195 | $1.62 | 13d | 1 | 0.82mi |
| 3028 W Walnut St Springfield, MO | 2.0 | 1.0 | 975 | $850 | $0.87 | 21d | 1 | 0.90mi |
| 3002 W Elm St Springfield, MO | 3.0 | 2.0 | 1128 | $1,295 | $1.15 | 21d | 1 | 0.92mi |
| 250 N Hilton Ave Springfield, MO | 2.0 | 2.0 | 1153 | $628 | $0.54 | 13d | 1 | 0.96mi |
| 1406 W Calhoun St Unit B Springfield, MO | 2.0 | 1.0 | 885 | $865 | $0.98 | 23d | 1 | 1.04mi |
| 3031 W Pacific St Springfield, MO | 3.0 | 1.5 | 1008 | $1,295 | $1.28 | 21d | 1 | 1.06mi |
| 2204 W Madison St Springfield, MO | 3.0 | 1.0 | 960 | $1,095 | $1.14 | 13d | 1 | 1.17mi |
| 547 S Hilton Ave Springfield, MO | 3.0 | 1.0 | 1008 | $1,175 | $1.17 | 43d | 1 | 1.20mi |
| 1200 W Walnut St Springfield, MO | 2.0 | 2.0 | 1000 | $995 | $0.99 | 13d | 3 | 1.32mi |
| 539 S Fort Ave Springfield, MO | 2.0 | 1.0 | 1500 | $1,025 | $0.68 | 13d | 1 | 1.35mi |
| 1020 S Clifton Ave Springfield, MO | 2.0 | 2.0 | 1010 | $950 | $0.94 | 23d | 1 | 1.38mi |
| 627 S Fort Ave Springfield, MO | 2.0 | 1.0 | 880 | $895 | $1.02 | 23d | 1 | 1.40mi |
| 1040 S Clifton Ave Springfield, MO | 2.0 | 2.0 | 1010 | $945 | $0.94 | 13d | 1 | 1.44mi |
| 2224 N Clifton Ave Unit 2238-A Springfield, MO | 2.0 | 1.0 | 756 | $695 | $0.92 | 13d | 1 | 1.48mi |
Listing history 17 events
-
2026-05-05status Pending 365-char remark
Show marketing remark (365 chars)
Charming Investment Opportunity in the Heart of Springfield!Discover the potential at 735 N Brown Ave, a solid single-family home just minutes from Downtown Springfield, OTC and MSU. This classic residence features a comfortable 1,209 sq. ft. floorplan with 3 bedrooms and 2 full baths, perfect for first-time buyers, downsizers, or investors seeking rental income.
-
2026-03-30status Active 365-char remark
Show marketing remark (365 chars)
Charming Investment Opportunity in the Heart of Springfield!Discover the potential at 735 N Brown Ave, a solid single-family home just minutes from Downtown Springfield, OTC and MSU. This classic residence features a comfortable 1,209 sq. ft. floorplan with 3 bedrooms and 2 full baths, perfect for first-time buyers, downsizers, or investors seeking rental income.
-
2026-03-19status Pending 365-char remark
Show marketing remark (365 chars)
Charming Investment Opportunity in the Heart of Springfield!Discover the potential at 735 N Brown Ave, a solid single-family home just minutes from Downtown Springfield, OTC and MSU. This classic residence features a comfortable 1,209 sq. ft. floorplan with 3 bedrooms and 2 full baths, perfect for first-time buyers, downsizers, or investors seeking rental income.
-
2026-03-17price $115,000 365-char remark
Show marketing remark (365 chars)
Charming Investment Opportunity in the Heart of Springfield!Discover the potential at 735 N Brown Ave, a solid single-family home just minutes from Downtown Springfield, OTC and MSU. This classic residence features a comfortable 1,209 sq. ft. floorplan with 3 bedrooms and 2 full baths, perfect for first-time buyers, downsizers, or investors seeking rental income.
-
2026-02-16status Active 365-char remark
Show marketing remark (365 chars)
Charming Investment Opportunity in the Heart of Springfield!Discover the potential at 735 N Brown Ave, a solid single-family home just minutes from Downtown Springfield, OTC and MSU. This classic residence features a comfortable 1,209 sq. ft. floorplan with 3 bedrooms and 2 full baths, perfect for first-time buyers, downsizers, or investors seeking rental income.
-
2026-02-01status Pending 365-char remark
Show marketing remark (365 chars)
Charming Investment Opportunity in the Heart of Springfield!Discover the potential at 735 N Brown Ave, a solid single-family home just minutes from Downtown Springfield, OTC and MSU. This classic residence features a comfortable 1,209 sq. ft. floorplan with 3 bedrooms and 2 full baths, perfect for first-time buyers, downsizers, or investors seeking rental income.
-
2026-01-20$125,000 Active 365-char remark
Show marketing remark (365 chars)
Charming Investment Opportunity in the Heart of Springfield!Discover the potential at 735 N Brown Ave, a solid single-family home just minutes from Downtown Springfield, OTC and MSU. This classic residence features a comfortable 1,209 sq. ft. floorplan with 3 bedrooms and 2 full baths, perfect for first-time buyers, downsizers, or investors seeking rental income.
-
2024-11-08historical $1,095
-
2024-09-27$1,095
-
2024-05-19historical $1,095
-
2024-04-25price $1,095
-
2024-04-24$825
-
2022-02-03price $1,095
-
2021-06-03soldstatus
-
2021-05-03soldstatus
-
2021-04-29soldstatus 170-char remark
Show marketing remark (170 chars)
Investment opportunity! 2 bedrooms, 1 full bathroom, multiple living areas, and a 1 car attached garage. Located just a short drive to OTC, MSU, and Downtown Springfield.
-
2021-04-15$60,000 170-char remark
Show marketing remark (170 chars)
Investment opportunity! 2 bedrooms, 1 full bathroom, multiple living areas, and a 1 car attached garage. Located just a short drive to OTC, MSU, and Downtown Springfield.
ⓘ Source: listings_history table (triggers on properties + properties_extension) + one-shot
backfill from property_details.listing_events for pre-trigger history.
Tax reassessment forecast MO · Resets to sale price
- Current annual tax
- $866 · $72/mo
- Projected year-2 tax
- $1,116 · $93/mo
- Expected delta
- +$249/yr (+$21/mo · 28.8%)
ⓘ Screening estimate from a state-policy table — verify with the county assessor before closing.
Climate risk First Street
- Flood 1/10 Low FEMA zone X (unshaded) · 0% chance over 30 yrs
- Wildfire 1/10 Low
- Heat 5/10 Major 7 d/yr ≥104°F today · 20 d/yr by 30 yrs out
- Wind 2/10 Low 0% chance of damaging wind over 30 yrs
- Air quality 2/10 Low 1 unhealthy d/yr today · 2 by 30 yrs out
Nearby sold comps map
Loading sold comps map…
Walkable amenities ~0.75 mi
Loading nearby amenities…
Taxation est. · year 1
- Rental income
- $12,398
- − Mortgage interest
- −$6,442
- − Property taxes
- −$866
- − Insurance
- −$575
- − Repairs & maintenance
- −$992
- − Management
- −$992
- − Depreciation
- −$3,345
- Taxable loss
- −$814
- Est. tax savings @ 24.0%
- +$195
- After-tax cash flow
- $1,312/yr
For passive investors: Depreciation is non-cash, so a rental often shows a tax loss while cash-flowing — sheltering income. Rental losses are passive: they offset passive income freely, and up to $25,000/yr can offset ordinary (W-2) income if you actively participate and your MAGI is under $100k (phasing out to $0 by $150k); unused losses carry forward. On sale, claimed depreciation is recaptured at up to 25%, and gains may owe capital-gains tax (a 1031 exchange can defer both). Figures are a year-1 estimate at your 24.0% rate — not tax advice; consult a CPA.
Schools (NCES district)
- District
- Springfield R-XII
- NCES district ID
- 2928860
- Math proficiency
- 32% ▼ -2.00%
- Reading proficiency
- 46% ▼ -3.00%
- Median HH income
- $37,886
- Composite
- 32.45/100
- National rank
- #5717
- State rank
- #174 of 324 in MO
Livability — Springfield
- Score
- 75/100
- State rank
- #57
- US rank
- #4121
Category grades
Schools grade is shown separately in the Schools card above.
Census & demographics
- Census place
- Springfield, MO
- County
- Greene County · 244,327 people
- City population
- 223,044
- Metro
- Springfield, MO
- Population (ZIP)
- 46,739
- Household income
- $55,019
- Rent vs Own
- Severe rent burden
- 1818.0
Population outlook (Greene County) Hauer SSP2
- Today (2025)
- 319,054 people
- By 2030
- 335,135 · +5.0%
- By 2040
- 366,186 · +14.8%
- By 2050
- 397,431 · +24.6%
- By 2075
- 477,035 · +49.5%
- By 2100
- 520,828 · +63.2%
Race, ethnicity, and origin ACS 2023
- Neighborhood character
- Predominantly White (81%)
- Race & ethnicity
- White 81% Two or more races 8% Hispanic / Latino 5% Black 4% Asian 2%
- Common ancestry
- Slovak 2% Lithuanian 2% Italian 2%
- Foreign-born
- 3% · Canada, Vietnam
- Languages at home
- 95% English-only · Spanish 2% Vietnamese 1% Other Indo-European 1%
Political lean MEDSL · Greene
- 2024 margin
- Strong R (+20.8) · D 38.9% · R 59.7% · Other 1.4%
- 2008→2024 swing
- -5.0pp toward R · 2008: -15.8pp · 2024: -20.8pp
- All cycles
- 2024: R+20.8 2020: R+20.1 2016: R+27.4 2012: R+24.4 2008: R+15.8
Not yet ingested
- Civics
- —
Market trends
- HPI YoY
- ▼ -99.72%
- Current HPI
- 212.9826
- Rent YoY
- ▲ 4.82%
- Metro
- Springfield, MO
- State GDP YoY
- ▲ 1.84%
- F500 in state
- 20
Industry mix (Fortune 500 HQ in MO)
| Industry | F500 HQs | Revenue |
|---|---|---|
| Healthcare | 1 | $163B |
|
||
| Insurance | 1 | $21B |
|
||
| Industrial Technology | 1 | $17B |
|
||
| Retail | 1 | $16B |
|
||
| Industrial Distribution | 1 | $10B |
|
||
| Utilities | 1 | $9B |
|
||
Price history
+91.7% since first listed17 events — show timeline
- 2026-05-05 Pending — SOMO
- 2026-03-30 Relisted — SOMO
- 2026-03-19 Pending — SOMO
- 2026-03-17 Price Changed $115,000 SOMO
- 2026-02-16 Relisted — SOMO
- 2026-02-01 Pending — SOMO
- 2026-01-20 Listed $125,000 SOMO
- 2024-11-08 Rental Removed $1,095 APPFOLIO
- 2024-09-27 Listed for Rent $1,095 APPFOLIO
- 2024-05-19 Rental Removed $1,095 APPFOLIO
- 2024-04-25 Price Changed $1,095 APPFOLIO
- 2024-04-24 Listed for Rent $825 APPFOLIO
- 2022-02-03 Price Changed $1,095 RENT.
- 2021-06-03 Sold (Public Records) — Public Records
- 2021-05-03 Sold (Public Records) — Public Records
- 2021-04-29 Sold (MLS) — SOMO
- 2021-04-15 Listed $60,000 SOMO
Property tax history
+7.0%/yrLatest (2025): $866 · +10.5% YoY. Source: county tax records.
Cash-flow waterfall
monthlySold comps — $/sqft
last 12 mo · ≤1 miLoading sold comps…