23 Costar St · Rochester, NY
Flood risk 1/10 · Minimal
- FEMA flood zone
- X (unshaded)
- Chance of flooding over 30 yrs
- 0.0%
- Est. flood insurance / yr
- $473 – $860
Fire risk 1/10 · Minimal
- Est. fire insurance / yr
- $691 – $1,283
Heat risk 2/10 · Minimal
- Hot days now (above 95°F)
- 7 days/yr
- Hot days in 30 yrs
- 15 days/yr
Wind risk 1/10 · Minimal
- Chance of severe wind over 30 yrs
- —
Air-quality risk 2/10 · Minimal
- Unhealthy air days now
- 1 days/yr
- Unhealthy air days in 30 yrs
- 2 days/yr
Risk factors via First Street. Map © Google.
Why this score? — see what drove the B+ grade
The composite is a weighted blend of 9 inputs, each scored 0–100. Each bar is that input's sub-score; the figure is the points it added to the 100-point composite (weight × sub-score).
- Cash flow +30.0/30.0
- 1% rule +10.0/10.0
- DSCR +10.0/10.0
- ARV discount +7.5/15.0
- Appreciation +6.8/10.0
- Rent growth +4.2/5.0
- Livability +3.8/5.0
- Schools +1.9/10.0
- Condition / age +1.0/5.0
$75,000
🖨 Deal sheet 📄 Offer letter ✓ Due diligence
Listing remarks
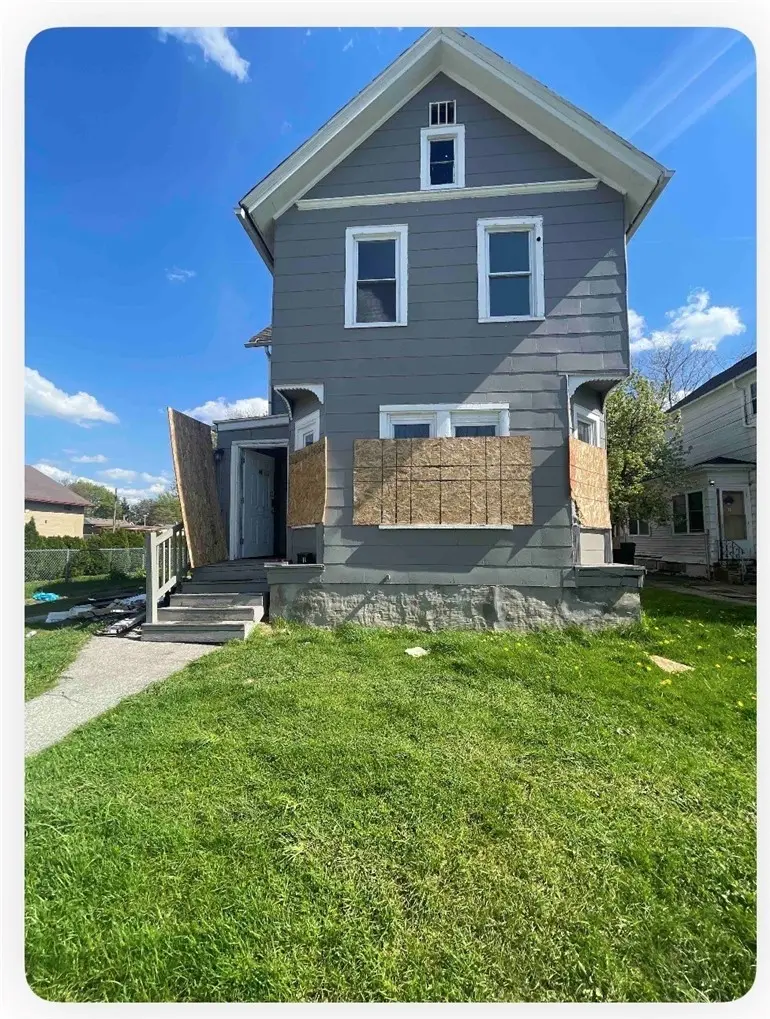
NO INTERIOR ACCESS ALLOW PRIOR TO CLOSING. Photos supplied are from the seller and were taken mid-May. Home is boarded. Seller has never occupied the property. Property to be sold as-is, cash or equivalent only. Any garbage/contents at the property will remain. No seller financing. Seller will not accept a contract subject to any unresolved contingencies (inspection, financing, etc. ) except attorney approval.
Key facts
- 6,098 sq ft lot
- Built 1900
- Listed 12 days
Property features AI
Exterior
- Parking: No garage
- Utilities: Public water (connected); Sewer connected
- Home design: Two-story property; Existing construction
- Construction: Composite siding; Asphalt roof; Block foundation
- Exterior features: See remarks; Near public transit; Rectangular residential lot; City street frontage
Interior
- Kitchen: Eat-in kitchen
- Bedrooms: 2 main-level bedrooms
- Flooring: Carpet; Vinyl; Varies
- Bathrooms: 1 full bathroom; 1 half bathroom; 1 main-level bathroom
- Heating & cooling: Gas forced-air heating
- Interior features: Separate/formal dining room; Eat-in kitchen; Bedroom on main level; Full basement
- Laundry & utility: Gas water heater
Neighborhood map
What this means for you Summary
Snapshot
- This is a 4-bed/1.5-bath single-family listed at $75k. Condition is rated poor.
Deal economics
- At list price, monthly cash flow is $842 ($10k/yr) — positive.
- The deal already cash-flows at list — no discount required.
- Meets the 1% rule at list price ($2k rent vs $75k).
- Cap rate 19.8% vs local median 9.3% in Rochester — top-decile yield for the area; either an underpriced asset or a hidden risk that comps aren't pricing in. Stress-test before assuming the spread holds.
Location & tenants
- Location reads 76/100 on livability (#222 in NY, #3,482 nationally) — a middle-class / working-renter tenant base. Strengths: commute A+, cost of living A+, housing A+; Watch: schools D+, crime F, employment F.
- Rochester City School District (urban): math 21% / reading 26% proficiency, ranked #589 of 590 in NY (top 100%) — low school quality limits family demand, transient renter base, plan for 1-2y turnover; 82% free/reduced lunch — lower-income household profile, screen leases tightly.
- Market conditions: Rents rising fast (+6.6%/yr); 51 active listings in the ZIP; 9 comparable units currently listed for rent nearby; rentals at typical pace (median 24d on market — plan ~3-4 weeks tenant-placement turnaround); 44% of comp listings sitting > 30 days — soft ceiling on asking rent; lower-income renter base — watch delinquency; 1,169 units permitted in Monroe County in 2024 (591 in 5+ unit buildings).
- At $1,721/mo this rent would consume 51% of the median local household income ($41k/yr) (locally 1300% of renters already pay >50% of income on rent) — very limited rent-growth headroom before tenants either downsize or default.
Forward outlook
- In year one you build about $3k of equity ($519 loan paydown + $3k appreciation (3.7% local appreciation)).
- Monroe County population projected to shrink 6% by 2050 — rents likely to lag national; underwrite the cash flow, not the appreciation.
- At projected returns (3.7% appreciation + 6.6% rent growth), your $21k cash investment doubles in ~2 years — after that, you're playing with house money.
- By year 10, paydown + projected appreciation supports a ~$32k cash-out refi (75% LTV) — recoverable capital for the next deal without selling this one.
Negotiation context
- Only 12 days on market — expect competitive offers; lowballing is unlikely to land.
- 3 sale attempts since 11y ago with the ask held roughly flat each time — persistent listings suggest the price (not the market) is what's stuck; bring a comps-based counter.
Risks & watch-outs
- Watch-outs: built in 1900 — expect roof / HVAC / electrical / plumbing capex.
Questions for the listing agent
- Have any recent inspections been done? Can we get a copy of the seller's disclosures and any deferred-maintenance estimates?
- Built in 1900 — when were the roof, HVAC, electrical panel, plumbing, and water heater last replaced?
- Is there a deadline driving the sale (1031 exchange, divorce, estate, relocation)? That informs how much negotiation room exists.
- Schools are D-rated, which usually means shorter tenancies and higher turnover. Who's the typical renter profile here, and what's been the actual vacancy rate?
- Crime grade is F in this area — have there been break-ins, vandalism, or insurance claims at this property in the last 3 years? What carrier currently insures it and at what premium?
- What's the average days-on-market for RENTAL listings here right now (not sales)? A rising rental-DOM trend means longer vacancies and softer asking-rent achievability than the comps imply.
- What's the recent tenant-quality profile in this submarket — average credit score on applications, eviction rate, late-payment / NSF rate, and stable-employment percentage? A property-management company in the area should have these aggregated.
- How much new for-sale + rental construction is in the pipeline within 1–3 miles? Heavy new supply typically softens prices + rents 12–24 months out; constrained supply supports both.
Investment metrics
- 1% rule
- 2.30% ✓
- Cap rate
- 19.76%
- Cash-on-cash
- 48.09%
- DSCR
- 3.14
- GRM
- 3.6
CMA / ARV
- ARV (on-the-fly)
- $163,116
- Comps found
- 12
Show comp detail 12 sales within ~0.75 mi
| Address | Dist | Beds/Ba | Sqft | Sold | Price | $/sf | Match |
|---|---|---|---|---|---|---|---|
| 309 Emerson St | 0.44mi | 4/1.5 | 1,725 (-3%) | 4mo | $65,000 | $38 | 72 |
| 288 Emerson St | 0.43mi | 4/2.0 | 1,688 (-5%) | 9mo | $185,000 | $110 | 62 |
| 134 Cameron St | 0.40mi | 4/2.5 | 1,645 (-7%) | 7mo | $50,000 | $30 | 60 |
| 163 Ravine Ave | 0.42mi | 4/1.0 | 1,622 (-8%) | 8mo | $78,000 | $48 | 58 |
| 371 Glenwood Ave | 0.67mi | 4/2.0 | 1,830 (+3%) | 5mo | $168,000 | $92 | 58 |
| 170 Otis St | 0.60mi | 5/3.0 (+1) | 1,830 (+3%) | 0mo | $190,000 | $104 | 55 |
| 320 Ravine Ave | 0.54mi | 4/2.0 | 1,923 (+8%) | 6mo | $140,000 | $73 | 54 |
| 79 Avenue B | 0.74mi | 4/2.0 | 1,922 (+8%) | 2mo | $165,000 | $86 | 48 |
| 515 Emerson St | 0.69mi | 4/1.5 | 1,536 (-13%) | 4mo | $129,900 | $85 | 43 |
| 33 Wolff St | 0.71mi | 5/2.0 (+1) | 1,630 (-8%) | 5mo | $175,000 | $107 | 42 |
| 62 Curtis St | 0.58mi | 3/1.0 (-1) | 1,566 (-12%) | 5mo | $155,000 | $99 | 42 |
| 33 Brooklyn St | 0.73mi | 3/1.5 (-1) | 1,609 (-9%) | 6mo | $160,000 | $99 | 41 |
Match score weights: distance 35% · size 25% · config 20% · recency 20%. Top-matched comps best support the ARV.
Projected returns pro-forma
3.69% appreciation · 6.61% rent growth · sell at horizon
- IRR
- 57.4%
- Equity multiple
- 4.42×
- Total profit
- $71,917
- Equity at exit
- $36,679
- IRR
- 57.9%
- Equity multiple
- 9.99×
- Total profit
- $188,825
- Equity at exit
- $58,941
Cash invested: $21,000 (down + closing). Projections, not guarantees.
Landlord ↔ Tenant lean methodology
- Overall (STATE)
- 15 Strongly Tenant-Friendly
- State New York
- 15 Strongly Tenant-Friendly · D+10
- County
- — inherits STATE
- City
- — inherits STATE
ZIP-level market 14608
- Home prices YoY
- 1.3%
- Rents YoY
- 6.6%
- Active inventory
- 51
- Price-to-rent
- 3.6×
Monthly cashflow live
- Estimated rent
- $1,721 high interval (Pro) →
- Mortgage (P&I)
- −$393
- Tax est. 1.5%
- −$94 /mo · $1,125/yr
- Insurance
- −$31
- HOA
- −$0
- Vacancy / Maint / Mgmt
- −$361
- Net cashflow
- $842
Break-even live
UW: 25.0% down · 7.5% · 30yr · 1.5% tax · 5.0% vac · 8.0% maint · 8.0% mgmt
Financing live
Cash to close
- Down payment
- $18,750
- Closing costs
- $2,250
- Reserves months
- —
- Total cash needed
- —
Loan-product check · same deal, 3 products live
Conventional
25% down · 7.5% · 30yr
- Down + closing
- —
- Monthly P&I
- —
- Monthly cashflow
- —
- DSCR
- —
- Eligible?
- —
Personal DTI + credit; lowest rate.
DSCR
20% down · 8.5% · 30yr
- Down + closing
- —
- Monthly P&I
- —
- Monthly cashflow
- —
- DSCR
- —
- Eligible?
- —
No personal income docs; deal must DSCR.
Hard money
10% down · 12.0% · 12mo
- Down + closing
- —
- Monthly P&I
- —
- Monthly cashflow
- —
- DSCR
- —
- Eligible?
- —
Short-term bridge; refi at stabilization.
Rent comps 9 comps
| Address | Beds | Baths | Sqft | Rent | $/sqft | DOM | Units | Dist |
|---|---|---|---|---|---|---|---|---|
| 327 Glenwood Ave Rochester, NY | 3.0 | 1.0 | 2012 | $1,690 | $0.84 | 3d | 1 | 0.62mi |
| 2 Jay St Unit 2 Rochester, NY | 3.0 | 1.0 | 1252 | $1,045 | $0.83 | 43d | 1 | 0.66mi |
| 649 Jay St Rochester, NY | 5.0 | 2.0 | 2144 | $2,000 | $0.93 | 3d | 1 | 0.74mi |
| 28-30 Carthage Dr Unit 28 Rochester, NY | 3.0 | 1.0 | 1415 | $1,600 | $1.13 | 23d | 1 | 0.75mi |
| 98 Pierpont St Rochester, NY | 3.0 | 1.0 | 1973 | $1,295 | $0.66 | 43d | 1 | 0.88mi |
| 385 Ames St Rochester, NY | 3.0 | 1.5 | 1738 | $1,500 | $0.86 | 21d | 1 | 0.98mi |
| 1016 Lake Ave Unit 1 Rochester, NY | 3.0 | 1.0 | 1300 | $1,600 | $1.23 | 43d | 1 | 1.05mi |
| 108 Wetmore Park Rochester, NY | 3.0 | 2.0 | 1278 | $1,900 | $1.49 | 10d | 1 | 1.35mi |
| 478 Tremont St Rochester, NY | 3.0 | 2.0 | 1424 | $1,500 | $1.05 | 43d | 1 | 1.46mi |
Listing history 7 events
-
2026-06-09statusdays on market $75,000 Pending 12 DOM
-
2026-06-07days on market $75,000 Active 11 DOM
-
2026-06-05days on market $75,000 Active 8 DOM
-
2026-06-03days on market $75,000 Active 7 DOM
-
2026-06-03days on market $75,000 Active 6 DOM
-
2026-06-02remarks 413-char remark
-
2026-06-02$75,000 Active 5 DOM
ⓘ Source: listings_history table (triggers on properties + properties_extension) + one-shot
backfill from property_details.listing_events for pre-trigger history.
Climate risk First Street
- Flood 1/10 Low FEMA zone X (unshaded) · 0% chance over 30 yrs
- Wildfire 1/10 Low
- Heat 2/10 Low 7 d/yr ≥95°F today · 15 d/yr by 30 yrs out
- Wind 1/10 Low
- Air quality 2/10 Low 1 unhealthy d/yr today · 2 by 30 yrs out
Nearby sold comps map
Loading sold comps map…
Walkable amenities ~0.75 mi
Loading nearby amenities…
Taxation est. · year 1
- Rental income
- $20,656
- − Mortgage interest
- −$4,201
- − Property taxes
- −$1,125
- − Insurance
- −$375
- − Repairs & maintenance
- −$1,652
- − Management
- −$1,652
- − Depreciation
- −$2,182
- Taxable income
- $9,468
- Est. tax owed @ 24.0%
- −$2,272
- After-tax cash flow
- $7,826/yr
For passive investors: Depreciation is non-cash, so a rental often shows a tax loss while cash-flowing — sheltering income. Rental losses are passive: they offset passive income freely, and up to $25,000/yr can offset ordinary (W-2) income if you actively participate and your MAGI is under $100k (phasing out to $0 by $150k); unused losses carry forward. On sale, claimed depreciation is recaptured at up to 25%, and gains may owe capital-gains tax (a 1031 exchange can defer both). Figures are a year-1 estimate at your 24.0% rate — not tax advice; consult a CPA.
Condition & rehab AI · 1 photo
This property requires extensive repairs and improvements to be marketable. Immediate focus should be on removing the board-ups and addressing the structural issues to ensure safety and security for potential buyers.
Repairs flagged
- Major Boarded up windows — Structural damage or security issue
- Major Boarded up siding — Structural damage or security issue
Value-add opportunities
- Both Board up removal and repair — Safety and security for potential buyers
- Both Landscaping and curb appeal improvements — Enhances property's visual appeal and marketability
Renovation cost estimate screening
| Repair item | Severity | Est. cost |
|---|---|---|
| Boarded up windows · Structural damage or security issue | Major | $15,000–50,000 |
| Boarded up siding · Structural damage or security issue | Major | $15,000–50,000 |
| Total estimated repair cost · 2 items | $30,000–100,000 |
Value-add ROI direction
- Both Board up removal and repair — Safety and security for potential buyers ↑
- Both Landscaping and curb appeal improvements — Enhances property's visual appeal and marketability ↑
ⓘ Cost ranges are severity-bucket heuristics (US national rule-of-thumb). Get contractor quotes + a written scope before underwriting a rehab budget.
Schools (NCES district)
- District
- Rochester City School District
- NCES district ID
- 3624750
- Math proficiency
- 21% ▬ 0.00%
- Reading proficiency
- 26% ▲ 4.00%
- Median HH income
- $30,923
- Composite
- 18.98/100
- National rank
- #8850
- State rank
- #589 of 590 in NY
Livability — Rochester
- Score
- 76/100
- State rank
- #222
- US rank
- #3482
Category grades
Schools grade is shown separately in the Schools card above.
Census & demographics
- Census place
- Rochester, NY
- County
- Monroe County · 674,131 people
- City population
- 432,803
- Metro
- Rochester, NY
- Population (ZIP)
- 12,792
- Household income
- $40,646
- Rent vs Own
- Severe rent burden
- 1300.0
Population outlook (Monroe County) Hauer SSP2
- Today (2025)
- 759,460 people
- By 2030
- 757,154 · -0.3%
- By 2040
- 740,644 · -2.5%
- By 2050
- 714,443 · -5.9%
- By 2075
- 645,883 · -15.0%
- By 2100
- 547,084 · -28.0%
Race, ethnicity, and origin ACS 2023
- Neighborhood character
- Diverse neighborhood (Simpson 0.67)
- Race & ethnicity
- Black 50% White 25% Two or more races 13% Hispanic / Latino 12% Asian 4%
- Hispanic origin (detail)
- Puerto Rican 10%
- Common ancestry
- Lithuanian 1% Romanian 1% Iranian 1%
- Foreign-born
- 8% · Canada, India
- Languages at home
- 85% English-only · Spanish 8% Other Indo-European 3% French/Haitian/Cajun 1%
Political lean MEDSL · Monroe
- 2024 margin
- D (+19.1) · D 59.5% · R 40.5%
- 2008→2024 swing
- +1.4pp toward D · 2008: 17.7pp · 2024: 19.1pp
- All cycles
- 2024: D+19.1 2020: D+21.0 2016: D+14.1 2012: D+17.4 2008: D+17.7
Not yet ingested
- Civics
- —
Market trends
- HPI YoY
- ▲ 3.69%
- Current HPI
- 280.2411
- Rent YoY
- ▲ 6.61%
- Metro
- Rochester, NY
- State GDP YoY
- ▲ 2.60%
- F500 in state
- 92
Industry mix (Fortune 500 HQ in NY)
| Industry | F500 HQs | Revenue |
|---|---|---|
| Financial Services | 10 | $950B |
|
||
| Consumer Goods | 9 | $162B |
|
||
| Insurance | 4 | $225B |
|
||
| Telecommunications | 2 | $144B |
|
||
| Pharmaceuticals | 2 | $112B |
|
||
| Media / Entertainment | 2 | $69B |
|
||
Price history
+67.0% since first listed4 events — show timeline
- 2026-05-27 Listed $75,000 UNYREIS
- 2022-12-14 Listing Removed — UNYREIS
- 2022-12-07 Listed $130,000 UNYREIS
- 2015-07-28 Listed $44,900 UNYREIS
Cash-flow waterfall
monthlySold comps — $/sqft
last 12 mo · ≤1 miLoading sold comps…