1414 Wesley St · Greenville, TX
Flood risk 1/10 · Minimal
- FEMA flood zone
- X (unshaded)
- Chance of flooding over 30 yrs
- 0.0%
- Est. flood insurance / yr
- $507 – $1,088
Fire risk 5/10 · Moderate
- Est. fire insurance / yr
- $1,222 – $2,270
Heat risk 7/10 · Major
- Hot days now (above 110°F)
- 7 days/yr
- Hot days in 30 yrs
- 23 days/yr
Wind risk 6/10 · Moderate
- Chance of severe wind over 30 yrs
- 27.0%
Air-quality risk 2/10 · Minimal
- Unhealthy air days now
- 1 days/yr
- Unhealthy air days in 30 yrs
- 1 days/yr
Risk factors via First Street. Map © Google.
Why this score? — see what drove the B- grade
The composite is a weighted blend of 9 inputs, each scored 0–100. Each bar is that input's sub-score; the figure is the points it added to the 100-point composite (weight × sub-score).
- Cash flow +30.0/30.0
- 1% rule +10.0/10.0
- DSCR +10.0/10.0
- ARV discount +7.5/15.0
- Livability +3.9/5.0
- Rent growth +2.7/5.0
- Condition / age +2.5/5.0
- Schools +2.0/10.0
- Appreciation +0.0/10.0
$79,900
🖨 Deal sheet 📄 Offer letter ✓ Due diligence
Listing remarks
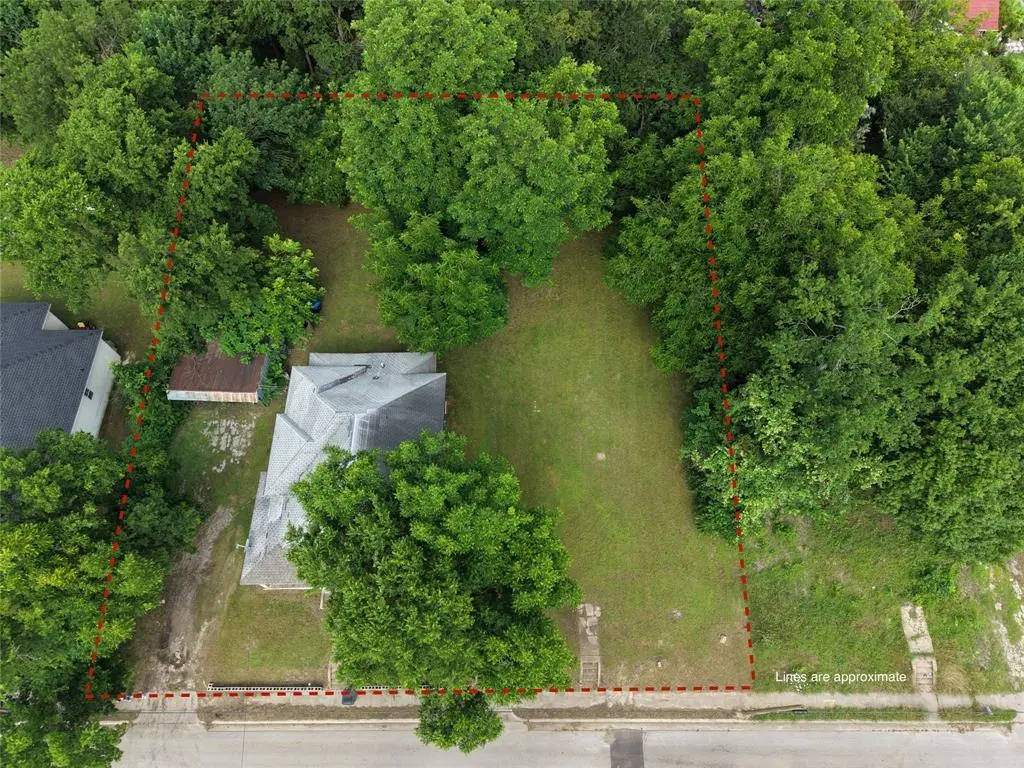
Investor opportunity in the growing heart of Greenville! This 3-bedroom, 1-bath home sits on an oversized double lot and is ready for transformation. Property will require a full rehab but offers incredible potential as a fix-and-flip, rental property, or future redevelopment opportunity. With surrounding new construction homes already transforming the area, this could also be the perfect location to build a new construction home. Two combined lots included in the sale (buyer to verify zoning, intended use, and lot dimensions). Convenient location with easy access to downtown Greenville, shopping, dining, and major roadways. Strong potential for added value and future growth. No current sur
Key facts
- Oversized double lot
- Full rehab
- Convenient location
Tags
Property features AI
Finance
- Other: Property is not attached (detached); Subdivision: Delaney Sub
- Financial info: Listing terms include Cash, Conventional, FHA-203K
- HOA & community: No homeowners association
Exterior
- Parking: Driveway parking
- Utilities: City water; City sewer; Electricity connected; Not in a municipal utility district
- Home design: Single-family residence; Residential property; One story; Deed restrictions
- Construction: Built in 1975; Siding exterior; Mixed roof; Pillar/post/pier foundation; Preowned
- Exterior features: Covered wrap-around front porch; Covered porch(es); Stable/Barn on property; Storage outbuilding; Large backyard with grass; Many trees; Interior lot; Utilities easement
Interior
- Kitchen: Includes appliances (other)
- Bedrooms: 3 bedrooms (primary bedroom on main level)
- Bathrooms: 1 full bathroom
- Heating & cooling: Other heating; Other cooling
- Interior features: One-level layout; Open living and dining areas (1 living area, 1 dining area); Other interior features
- Laundry & utility: Full-size washer/dryer area
Neighborhood map
What this means for you Summary
Snapshot
- This is a 3-bed/2.0-bath single-family listed at $80k.
Deal economics
- At list price, monthly cash flow is $426 ($5k/yr) — positive.
- The deal already cash-flows at list — no discount required.
- Meets the 1% rule at list price ($2k rent vs $80k).
- Recommended offer: $79k (1.5% below list) — sets the bar for market timing.
- Cap rate 12.7% vs local median 4.1% in Greenville — top-decile yield for the area; either an underpriced asset or a hidden risk that comps aren't pricing in. Stress-test before assuming the spread holds.
Location & tenants
- Location reads 77/100 on livability (#78 in TX, #2,719 nationally) — a middle-class / working-renter tenant base. Strengths: cost of living A+, housing A+, health & safety A; Watch: employment D, commute F.
- Greenville ISD (town): math 20% / reading 26% proficiency, ranked #743 of 826 in TX (top 90%) — low school quality limits family demand, transient renter base, plan for 1-2y turnover.
- Zoned schools: Carver El (math 18% / reading 15%, grade F, #3,946 of 4,322 statewide, top 92%, 524 students, 93% FRL) — zoned schools average 93% FRL vs 55% district-wide (38 pts higher); higher-poverty schools than district average — tighter screening recommended.
- Market conditions: Rents flat; 396 active listings in the ZIP; 40 comparable units currently listed for rent nearby; rentals at typical pace (median 25d on market — plan ~3-4 weeks tenant-placement turnaround); 42% of comp listings sitting > 30 days — soft ceiling on asking rent; 1,289 units permitted in Hunt County in 2024 (527 in 5+ unit buildings).
- This rent runs 30% of the median local income ($60k/yr) — at the standard rent-burdened threshold; future hikes will face affordability resistance.
Forward outlook
- Local home prices are declining (-3.0%/yr); year-one equity from $552 of loan paydown is wiped out by about $2k of value loss. Plan a longer hold.
- Hunt County population projected at +15% by 2050 — modest demand growth; plan on rents tracking national, not racing it.
- At projected returns (-3.0% appreciation + 0.6% rent growth), your $22k cash investment doubles in ~7 years — after that, you're playing with house money.
Negotiation context
- It's been on market 17 days — a 2% lower offer ($79k) is reasonable based on typical stale-listing flexibility.
- 3 sale attempts with the ask held roughly flat each time — persistent listings suggest the price (not the market) is what's stuck; bring a comps-based counter.
Risks & watch-outs
- Watch-outs: property tax is 4.6% of price.
- Climate carrying-cost: major wind risk, 27% chance of damaging wind over 30y; moderate wildfire risk; extreme-heat days projected 7→23/yr by 2055 (HVAC capex compounding) — expect insurance premiums to compound above CPI over the hold.
Questions for the listing agent
- Built in 1975 — when were the roof, HVAC, electrical panel, plumbing, and water heater last replaced?
- Property tax is high relative to price — has the assessment been appealed recently, and will the sale trigger a re-assessment?
- Is there a deadline driving the sale (1031 exchange, divorce, estate, relocation)? That informs how much negotiation room exists.
- Schools are D-rated, which usually means shorter tenancies and higher turnover. Who's the typical renter profile here, and what's been the actual vacancy rate?
- What's the average days-on-market for RENTAL listings here right now (not sales)? A rising rental-DOM trend means longer vacancies and softer asking-rent achievability than the comps imply.
- What's the recent tenant-quality profile in this submarket — average credit score on applications, eviction rate, late-payment / NSF rate, and stable-employment percentage? A property-management company in the area should have these aggregated.
- How much new for-sale + rental construction is in the pipeline within 1–3 miles? Heavy new supply typically softens prices + rents 12–24 months out; constrained supply supports both.
Investment metrics
- 1% rule
- 1.88% ✓
- Cap rate
- 12.69%
- Cash-on-cash
- 22.83%
- DSCR
- 2.02
- GRM
- 4.4
CMA / ARV
- ARV (on-the-fly)
- $176,094
- Comps found
- 12
Show comp detail 12 sales within ~0.75 mi
| Address | Dist | Beds/Ba | Sqft | Sold | Price | $/sf | Match |
|---|---|---|---|---|---|---|---|
| 1216 Wesley St | 0.12mi | 3/1.0 | 1,172 (+8%) | 3mo | $165,000 | $141 | 75 |
| 2202 Stuart St | 0.43mi | 2/2.0 (-1) | 1,110 (+2%) | 6mo | $89,900 | $81 | 66 |
| 2612 Polk St | 0.18mi | 3/2.0 | 1,231 (+13%) | 9mo | $259,900 | $211 | 62 |
| 3123 Silver St | 0.24mi | 3/2.0 | 1,200 (+10%) | 13mo | $209,999 | $175 | 61 |
| 3206 Bourland St | 0.37mi | 3/2.0 | 1,248 (+15%) | 1mo | $185,000 | $148 | 57 |
| 3104 Bourland St | 0.33mi | 3/2.0 | 1,200 (+10%) | 13mo | $215,000 | $179 | 56 |
| 1215 Walnut St | 0.62mi | 3/2.0 | 1,125 (+4%) | 13mo | $209,900 | $187 | 55 |
| 2207 Henry St | 0.49mi | 3/2.0 | 1,242 (+14%) | 6mo | $195,000 | $157 | 48 |
| 3603 Washington St | 0.74mi | 4/2.0 (+1) | 1,136 (+4%) | 6mo | $100,000 | $88 | 48 |
| 3606 Pace St | 0.47mi | 3/2.0 | 1,234 (+14%) | 11mo | $200,000 | $162 | 46 |
| 1805 Walnut St | 0.64mi | 3/2.0 | 1,178 (+8%) | 13mo | $210,000 | $178 | 45 |
| 3008 Pickett St | 0.61mi | 3/2.0 | 1,210 (+11%) | 12mo | $169,900 | $140 | 43 |
Match score weights: distance 35% · size 25% · config 20% · recency 20%. Top-matched comps best support the ARV.
Projected returns pro-forma
-3.0% appreciation · 0.62% rent growth · sell at horizon
- IRR
- 12.6%
- Equity multiple
- 1.48×
- Total profit
- $10,806
- Equity at exit
- $11,913
- IRR
- 19.2%
- Equity multiple
- 2.39×
- Total profit
- $31,200
- Equity at exit
- $6,908
Cash invested: $22,372 (down + closing). Projections, not guarantees.
Landlord ↔ Tenant lean methodology
- Overall (STATE)
- 87 Strongly Landlord-Friendly
- State Texas
- 87 Strongly Landlord-Friendly · R+5
- County
- — inherits STATE
- City
- — inherits STATE
ZIP-level market 75401
- Home prices YoY
- -20.7%
- Rents YoY
- 0.6%
- Active inventory
- 396
- Price-to-rent
- 4.4×
Monthly cashflow live
- Estimated rent
- $1,501 high interval (Pro) →
- Mortgage (P&I)
- −$419
- Tax from tax record
- −$308 /mo · $3,692/yr
- Insurance
- −$33
- HOA
- −$0
- Vacancy / Maint / Mgmt
- −$315
- Net cashflow
- $426
Break-even live
UW: 25.0% down · 7.5% · 30yr · 1.5% tax · 5.0% vac · 8.0% maint · 8.0% mgmt
Financing live
Cash to close
- Down payment
- $19,975
- Closing costs
- $2,397
- Reserves months
- —
- Total cash needed
- —
Loan-product check · same deal, 3 products live
Conventional
25% down · 7.5% · 30yr
- Down + closing
- —
- Monthly P&I
- —
- Monthly cashflow
- —
- DSCR
- —
- Eligible?
- —
Personal DTI + credit; lowest rate.
DSCR
20% down · 8.5% · 30yr
- Down + closing
- —
- Monthly P&I
- —
- Monthly cashflow
- —
- DSCR
- —
- Eligible?
- —
No personal income docs; deal must DSCR.
Hard money
10% down · 12.0% · 12mo
- Down + closing
- —
- Monthly P&I
- —
- Monthly cashflow
- —
- DSCR
- —
- Eligible?
- —
Short-term bridge; refi at stabilization.
Rent comps 40 comps
| Address | Beds | Baths | Sqft | Rent | $/sqft | DOM | Units | Dist |
|---|---|---|---|---|---|---|---|---|
| 1707 Wright St Greenville, TX | 3.0 | 2.0 | 1400 | $1,725 | $1.23 | 5d | 1 | 0.19mi |
| 1901 Wright St Greenville, TX | 3.0 | 2.0 | 1260 | $1,575 | $1.25 | 24d | 1 | 0.26mi |
| 2005 Wesley St Unit 4 Greenville, TX | 2.0 | 1.0 | 1056 | $1,250 | $1.18 | 2d | 1 | 0.26mi |
| 2915 Bourland St Greenville, TX | 3.0 | 2.0 | 1197 | $1,364 | $1.14 | 44d | 1 | 0.28mi |
| 2003 Johnson St Greenville, TX | 2.0 | 1.0 | 1156 | $1,375 | $1.19 | 44d | 1 | 0.31mi |
| 2106 Stonewall St Unit 2B Greenville, TX | 2.0 | 1.0 | 1220 | $1,265 | $1.04 | 20d | 1 | 0.32mi |
| 2106 Stonewall St Unit 2B Greenville, TX | 2.0 | 1.0 | 1200 | $1,263 | $1.05 | 12d | 1 | 0.32mi |
| 2015 Stuart St Unit A Greenville, TX | 3.0 | 2.0 | 1069 | $1,400 | $1.31 | 24d | 1 | 0.34mi |
| 2116 King St Unit 1 Greenville, TX | 2.0 | 1.0 | 1000 | $1,150 | $1.15 | 4d | 1 | 0.34mi |
| 2305 Bourland St Greenville, TX | 3.0 | 2.0 | 1320 | $1,900 | $1.44 | 44d | 1 | 0.36mi |
| 2113 Wright St Unit A Greenville, TX | 3.0 | 2.5 | 1436 | $1,800 | $1.25 | 44d | 1 | 0.36mi |
| 3333 Dalton St Greenville, TX | 3.0 | 2.0 | 1493 | $1,635 | $1.10 | 24d | 1 | 0.37mi |
| 3333 Dalton St Greenville, TX | 3.0 | 2.0 | 1493 | $1,635 | $1.10 | 7d | 1 | 0.37mi |
| 3333 Dalton St Greenville, TX | 3.0 | 2.0 | 1493 | $1,635 | $1.10 | 5d | 1 | 0.37mi |
| 3307 Polk St Unit A Greenville, TX | 3.0 | 2.0 | 1288 | $1,550 | $1.20 | 18d | 1 | 0.38mi |
| 3020 Henry St Unit B Greenville, TX | 3.0 | 2.0 | 1100 | $2,850 | $2.59 | 44d | 1 | 0.39mi |
| 3020 Henry St Unit A Greenville, TX | 3.0 | 2.0 | 1100 | $2,800 | $2.55 | 44d | 1 | 0.39mi |
| 3305 Stevens St Unit B Greenville, TX | 3.0 | 2.0 | 1069 | $1,350 | $1.26 | 44d | 1 | 0.40mi |
| 3305 Stevens St Unit A Greenville, TX | 3.0 | 2.0 | 1069 | $1,300 | $1.22 | 44d | 1 | 0.40mi |
| 3305 Stevens St Greenville, TX | 3.0 | 2.0 | 1069 | $1,475 | $1.38 | 44d | 1 | 0.40mi |
| 2203 Henry St Unit A Greenville, TX | 3.0 | 2.0 | 980 | $1,250 | $1.28 | 10d | 1 | 0.40mi |
| 2203 Henry St Unit A Greenville, TX | 3.0 | 2.0 | 980 | $1,250 | $1.28 | 21d | 1 | 0.40mi |
| 2309 Wesley St Unit A Greenville, TX | 2.0 | 1.0 | 1150 | $1,175 | $1.02 | 44d | 1 | 0.41mi |
| 2309 Wesley St Unit D Greenville, TX | 2.0 | 1.0 | 1150 | $1,100 | $0.96 | 22d | 1 | 0.41mi |
| 2212 Church St Unit A Greenville, TX | 3.0 | 2.0 | 1254 | $1,595 | $1.27 | 6d | 1 | 0.42mi |
| 902 Clark St Greenville, TX | 3.0 | 2.0 | 1200 | $1,900 | $1.58 | 44d | 1 | 0.45mi |
| 2107 Church St Unit A Greenville, TX | 3.0 | 2.0 | 1069 | $1,400 | $1.31 | 24d | 1 | 0.46mi |
| 2107 Church St Unit B Greenville, TX | 3.0 | 2.0 | 1069 | $1,400 | $1.31 | 44d | 1 | 0.46mi |
| 2203 Henry St Unit B Greenville, TX | 3.0 | 2.0 | 980 | $1,250 | $1.28 | 44d | 1 | 0.48mi |
| 2006 Church St Greenville, TX | 3.0 | 2.0 | 1463 | $1,600 | $1.09 | 44d | 1 | 0.49mi |
| 2113 Henry St Unit B Greenville, TX | 3.0 | 2.0 | 1068 | $1,400 | $1.31 | 24d | 1 | 0.49mi |
| 2113 Henry St Greenville, TX | 3.0 | 2.0 | 1068 | $1,400 | $1.31 | 18d | 1 | 0.49mi |
| 2018 Henry St Unit A Greenville, TX | 3.0 | 1.0 | 838 | $1,030 | $1.23 | 15d | 1 | 0.49mi |
| 2005 Bourland St Unit B Greenville, TX | 3.0 | 2.0 | 1038 | $1,350 | $1.30 | 4d | 1 | 0.49mi |
| 2901 Lee St Apt 1 Greenville, TX | 2.0 | 2.0 | 1250 | $1,575 | $1.26 | 44d | 1 | 0.51mi |
| 3604 Bourland St Greenville, TX | 3.0 | 2.0 | 1028 | $1,360 | $1.32 | 44d | 1 | 0.52mi |
| 1901 Bourland St Unit A Greenville, TX | 3.0 | 1.0 | 1100 | $1,399 | $1.27 | 44d | 1 | 0.52mi |
| 2217 Sayle St Unit B Greenville, TX | 2.0 | 2.0 | 812 | $1,275 | $1.57 | 22d | 1 | 0.54mi |
| 2217 Sayle St Greenville, TX | 2.0 | 2.0 | 812 | $1,275 | $1.57 | 3d | 1 | 0.54mi |
| 3840 McDougal St Greenville, TX | 3.0 | 2.0 | 1458 | $2,000 | $1.37 | 7d | 1 | 0.59mi |
Listing history 12 events
-
2026-06-18days on market $79,900 Active 17 DOM
-
2026-06-17days on market $79,900 Active 16 DOM
-
2026-06-16days on market $79,900 Active 15 DOM
-
2026-06-15days on market $79,900 Active 14 DOM
-
2026-06-13days on market $79,900 Active 12 DOM
-
2026-06-09days on market $79,900 Active 8 DOM
-
2026-06-08days on market $79,900 Active 7 DOM
-
2026-06-07days on market $79,900 Active 6 DOM
-
2026-06-04days on market $79,900 Active 3 DOM
-
2026-06-03days on market $79,900 Active 2 DOM
-
2026-06-02remarks 699-char remark
-
2026-06-02$79,900 Active 1 DOM
ⓘ Source: listings_history table (triggers on properties + properties_extension) + one-shot
backfill from property_details.listing_events for pre-trigger history.
Tax reassessment forecast TX · Resets to sale price
- Current annual tax
- $3,692 · $308/mo
- Projected year-2 tax
- $3,692 · $308/mo
- Expected delta
- $0/yr ($0/mo · 0.0%)
ⓘ Screening estimate from a state-policy table — verify with the county assessor before closing.
Climate risk First Street
- Flood 1/10 Low FEMA zone X (unshaded) · 0% chance over 30 yrs
- Wildfire 5/10 Major
- Heat 7/10 Severe 7 d/yr ≥110°F today · 23 d/yr by 30 yrs out
- Wind 6/10 Major 27% chance of damaging wind over 30 yrs
- Air quality 2/10 Low 1 unhealthy d/yr today · 1 by 30 yrs out
Nearby sold comps map
Loading sold comps map…
Walkable amenities ~0.75 mi
Loading nearby amenities…
Taxation est. · year 1
- Rental income
- $18,010
- − Mortgage interest
- −$4,476
- − Property taxes
- −$3,692
- − Insurance
- −$400
- − Repairs & maintenance
- −$1,441
- − Management
- −$1,441
- − Depreciation
- −$2,324
- Taxable income
- $4,237
- Est. tax owed @ 24.0%
- −$1,017
- After-tax cash flow
- $4,092/yr
For passive investors: Depreciation is non-cash, so a rental often shows a tax loss while cash-flowing — sheltering income. Rental losses are passive: they offset passive income freely, and up to $25,000/yr can offset ordinary (W-2) income if you actively participate and your MAGI is under $100k (phasing out to $0 by $150k); unused losses carry forward. On sale, claimed depreciation is recaptured at up to 25%, and gains may owe capital-gains tax (a 1031 exchange can defer both). Figures are a year-1 estimate at your 24.0% rate — not tax advice; consult a CPA.
Schools (NCES district)
- District
- Greenville ISD
- NCES district ID
- 4821720
- Math proficiency
- 20% ▼ -12.00%
- Reading proficiency
- 26% ▼ -7.00%
- Median HH income
- $41,374
- Composite
- 19.56/100
- National rank
- #8759
- State rank
- #743 of 826 in TX
Livability — Greenville
- Score
- 77/100
- State rank
- #78
- US rank
- #2719
Category grades
Schools grade is shown separately in the Schools card above.
Census & demographics
- Census place
- Greenville, TX
- County
- Hunt County · 71,969 people
- City population
- 42,767
- Metro
- Dallas-Fort Worth-Arlington, TX
- Population (ZIP)
- 22,669
- Household income
- $59,908
- Rent vs Own
- Severe rent burden
- 638.0
Population outlook (Hunt County) Hauer SSP2
- Today (2025)
- 97,090 people
- By 2030
- 100,452 · +3.5%
- By 2040
- 106,544 · +9.7%
- By 2050
- 111,218 · +14.6%
- By 2075
- 121,695 · +25.3%
- By 2100
- 123,683 · +27.4%
Race, ethnicity, and origin ACS 2023
- Neighborhood character
- Diverse neighborhood (Simpson 0.62)
- Race & ethnicity
- White 51% Hispanic / Latino 32% Black 13% Two or more races 11%
- Hispanic origin (detail)
- Mexican 30%
- Common ancestry
- Slovak 2% Lithuanian 1% Iranian 1%
- Foreign-born
- 13% · Canada
- Languages at home
- 75% English-only · Spanish 24%
Political lean MEDSL · Hunt
- 2024 margin
- Solid R (+55.5) · D 21.9% · R 77.4%
- 2008→2024 swing
- -14.9pp toward R · 2008: -40.6pp · 2024: -55.5pp
- All cycles
- 2024: R+55.5 2020: R+52.5 2016: R+56.3 2012: R+51.2 2008: R+40.6
Not yet ingested
- Civics
- —
Market trends
- HPI YoY
- ▼ -88.45%
- Current HPI
- 339.0287
- Rent YoY
- ▲ 0.62%
- Metro
- Dallas-Fort Worth-Arlington, TX
- State GDP YoY
- ▲ 3.95%
- F500 in state
- 110
Industry mix (Fortune 500 HQ in TX)
| Industry | F500 HQs | Revenue |
|---|---|---|
| Energy | 16 | $1,198B |
|
||
| Technology | 5 | $198B |
|
||
| Engineering / Construction | 4 | $72B |
|
||
| Energy Services | 3 | $60B |
|
||
| Utilities | 3 | $41B |
|
||
| Healthcare | 2 | $330B |
|
||
Price history
-20.0% since first listed10 events — show timeline
- 2026-06-01 Listed $79,900 NTREIS
- 2026-04-30 Listing Removed — NTREIS
- 2026-04-29 Relisted — NTREIS
- 2026-04-22 Contingent — NTREIS
- 2026-04-21 Price Changed $79,900 NTREIS
- 2026-03-12 Price Changed $84,900 NTREIS
- 2026-02-19 Price Changed $94,900 NTREIS
- 2026-02-06 Listed $99,900 NTREIS
- 2024-09-04 Sold (Public Records) — Public Records
- 2016-03-31 Sold (Public Records) — Public Records
Property tax history
+10.9%/yrLatest (2025): $3,692 · +13.9% YoY. Source: county tax records.
Cash-flow waterfall
monthlySold comps — $/sqft
last 12 mo · ≤1 miLoading sold comps…