2429 Cresap St · Lakeland, FL
Flood risk 4/10 · Minor
- FEMA flood zone
- X (unshaded)
- Chance of flooding over 30 yrs
- 0.2%
- Est. flood insurance / yr
- $507 – $1,088
Fire risk 3/10 · Minor
- Est. fire insurance / yr
- $947 – $1,759
Heat risk 8/10 · Major
- Hot days now (above 108°F)
- 7 days/yr
- Hot days in 30 yrs
- 22 days/yr
Wind risk 10/10 · Severe
- Chance of severe wind over 30 yrs
- 99.0%
Air-quality risk 2/10 · Minimal
- Unhealthy air days now
- 1 days/yr
- Unhealthy air days in 30 yrs
- 2 days/yr
Risk factors via First Street. Map © Google.
Why this score? — see what drove the A- grade
The composite is a weighted blend of 9 inputs, each scored 0–100. Each bar is that input's sub-score; the figure is the points it added to the 100-point composite (weight × sub-score).
- Cash flow +30.0/30.0
- 1% rule +10.0/10.0
- DSCR +10.0/10.0
- Appreciation +10.0/10.0
- ARV discount +7.5/15.0
- Rent growth +4.0/5.0
- Livability +3.9/5.0
- Schools +3.5/10.0
- Condition / age +2.5/5.0
$60,000
🖨 Deal sheet 📄 Offer letter ✓ Due diligence
Listing remarks
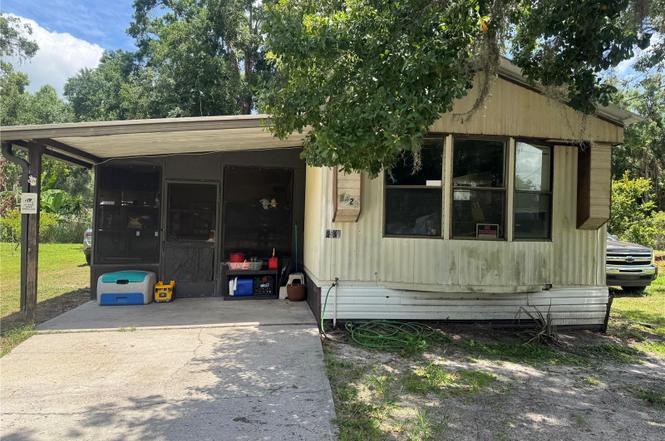
Calling all investors, flippers, and renovation enthusiasts! This 3-bedroom, 1-bath home offers a prime opportunity to build equity and unlock its full potential. Renovations were started by the current owners but remain unfinished, leaving the perfect blank canvas for your vision and finishing touches. The home features a spacious screened patio, exterior laundry room, and detached storage shed. While significant cosmetic updates are needed, the property appears to have solid fundamentals and presents an excellent value-add opportunity for the right buyer. Previously equipped with central heat and air, the home is currently serviced by window units. Whether you're looking for your next fli
Key facts
- Screened patio
- 5,907 sq ft lot
- Built 1986
Tags
Property features AI
Finance
- Other: Property listed as Residential — Manufactured Home; Lot dimensions approximately 55 x 108 (0.14 acres)
- HOA & community: No HOA
Exterior
- Utilities: Public water; Septic tank; Electricity connected
- Home design: Manufactured home (single wide); One story; South-facing entry
- Construction: Vinyl siding; Other roof; Crawlspace foundation; Built on crawlspace
- Exterior features: Private mailbox; Asphalt road access
Interior
- Kitchen: Refrigerator
- Bedrooms: 3 bedrooms
- Flooring: Other flooring
- Bathrooms: 1 full bathroom
- Heating & cooling: No central heating; Wall/window AC units
- Interior features: Ceiling fans; Open floorplan
- Laundry & utility: Washer hookup; Electric dryer hookup; Dedicated laundry room
Neighborhood map
What this means for you Summary
Snapshot
- This is a 3-bed/1.0-bath manufactured listed at $60k.
Deal economics
- At list price, monthly cash flow is $685 ($8k/yr) — positive.
- The deal already cash-flows at list — no discount required.
- Meets the 1% rule at list price ($1k rent vs $60k).
Location & tenants
- Location reads 77/100 on livability (#206 in FL, #3,179 nationally) — a middle-class / working-renter tenant base. Strengths: cost of living A+, housing A+, health & safety A+; Watch: employment D+, amenities F, commute F.
- Polk (suburban): math 39% / reading 43% proficiency, ranked #62 of 73 in FL (top 85%) — families likely to look elsewhere, expect single-tenant / working-renter base with shorter leases.
- Market conditions: Rents rising fast (+6.1%/yr); 72 active listings in the ZIP; 23 comparable units currently listed for rent nearby; rentals at typical pace (median 15d on market — plan ~3-4 weeks tenant-placement turnaround); lower-income renter base — watch delinquency; 10,384 units permitted in Polk County in 2024 (1,716 in 5+ unit buildings).
- At $1,447/mo this rent would consume 46% of the median local household income ($37k/yr) (locally 700% of renters already pay >50% of income on rent) — very limited rent-growth headroom before tenants either downsize or default.
Forward outlook
- In year one you build about $6k of equity ($415 loan paydown + $6k appreciation (10.0% local appreciation)).
- Polk County population projected at +33% by 2050 — long-run rental-demand tailwind backs the buy-and-hold thesis.
- At projected returns (10.0% appreciation + 6.1% rent growth), your $17k cash investment doubles in ~2 years — after that, you're playing with house money.
- By year 6, paydown + projected appreciation supports a ~$38k cash-out refi (75% LTV) — recoverable capital for the next deal without selling this one.
Negotiation context
- Only 1 days on market — expect competitive offers; lowballing is unlikely to land.
- Current owner paid $37k; list at $60k implies a 62% gain — meaningful room to come down on a strong offer.
Risks & watch-outs
- Climate carrying-cost: severe wind risk, 99% chance of damaging wind over 30y; extreme-heat days projected 7→22/yr by 2055 (HVAC capex compounding) — expect insurance premiums to compound above CPI over the hold.
Questions for the listing agent
- Is there a deadline driving the sale (1031 exchange, divorce, estate, relocation)? That informs how much negotiation room exists.
- What's the average days-on-market for RENTAL listings here right now (not sales)? A rising rental-DOM trend means longer vacancies and softer asking-rent achievability than the comps imply.
- What's the recent tenant-quality profile in this submarket — average credit score on applications, eviction rate, late-payment / NSF rate, and stable-employment percentage? A property-management company in the area should have these aggregated.
- How much new for-sale + rental construction is in the pipeline within 1–3 miles? Heavy new supply typically softens prices + rents 12–24 months out; constrained supply supports both.
Investment metrics
- 1% rule
- 2.41% ✓
- Cap rate
- 20.00%
- Cash-on-cash
- 48.95%
- DSCR
- 3.18
- GRM
- 3.5
CMA / ARV
No comps found within radius.
Projected returns pro-forma
10.0% appreciation · 6.14% rent growth · sell at horizon
- IRR
- 65.2%
- Equity multiple
- 5.83×
- Total profit
- $81,084
- Equity at exit
- $54,053
- IRR
- 60.1%
- Equity multiple
- 13.82×
- Total profit
- $215,411
- Equity at exit
- $116,567
Cash invested: $16,800 (down + closing). Projections, not guarantees.
Landlord ↔ Tenant lean methodology
- Overall (STATE)
- 87 Strongly Landlord-Friendly
- State Florida
- 87 Strongly Landlord-Friendly · R+3
- County
- — inherits STATE
- City
- — inherits STATE
ZIP-level market 33815
- Home prices YoY
- 12.6%
- Rents YoY
- 6.1%
- Active inventory
- 72
- Price-to-rent
- 3.5×
Monthly cashflow live
- Estimated rent
- $1,447 high interval (Pro) →
- Mortgage (P&I)
- −$315
- Tax from tax record
- −$118 /mo · $1,417/yr
- Insurance
- −$25
- HOA
- −$0
- Vacancy / Maint / Mgmt
- −$304
- Net cashflow
- $685
Break-even live
UW: 25.0% down · 7.5% · 30yr · 1.5% tax · 5.0% vac · 8.0% maint · 8.0% mgmt
Financing live
Cash to close
- Down payment
- $15,000
- Closing costs
- $1,800
- Reserves months
- —
- Total cash needed
- —
Loan-product check · same deal, 3 products live
Conventional
25% down · 7.5% · 30yr
- Down + closing
- —
- Monthly P&I
- —
- Monthly cashflow
- —
- DSCR
- —
- Eligible?
- —
Personal DTI + credit; lowest rate.
DSCR
20% down · 8.5% · 30yr
- Down + closing
- —
- Monthly P&I
- —
- Monthly cashflow
- —
- DSCR
- —
- Eligible?
- —
No personal income docs; deal must DSCR.
Hard money
10% down · 12.0% · 12mo
- Down + closing
- —
- Monthly P&I
- —
- Monthly cashflow
- —
- DSCR
- —
- Eligible?
- —
Short-term bridge; refi at stabilization.
Rent comps 23 comps
| Address | Beds | Baths | Sqft | Rent | $/sqft | DOM | Units | Dist |
|---|---|---|---|---|---|---|---|---|
| 2206 W Highland St Unit 2208 Lakeland, FL | 2.0 | 1.0 | 756 | $1,125 | $1.49 | 10d | 1 | 0.27mi |
| 457 Arapahoe Ave Lakeland, FL | 2.0 | 1.0 | 750 | $1,095 | $1.46 | 2d | 1 | 0.74mi |
| 455 Arapahoe Ave Lakeland, FL | 2.0 | 1.0 | 750 | $1,199 | $1.60 | 19d | 1 | 0.75mi |
| 2259 Chestnut Woods Dr Lakeland, FL | 2.0 | 1.0 | 1001 | $1,400 | $1.40 | 14d | 1 | 0.81mi |
| 2463 Chestnut Woods Dr Lakeland, FL | 2.0 | 1.0 | 910 | $1,500 | $1.65 | 23d | 1 | 0.81mi |
| 2559 Chestnut Woods Dr Lakeland, FL | 2.0 | 1.0 | 1001 | $1,500 | $1.50 | 14d | 1 | 0.83mi |
| 607 Kansas Ave Lakeland, FL | 2.0 | 1.0 | 829 | $1,150 | $1.39 | 23d | 1 | 0.90mi |
| 1618 Wayman St Lakeland, FL | 3.0 | 1.0 | 994 | $1,750 | $1.76 | 23d | 1 | 0.95mi |
| 524 Montana Ave Lakeland, FL | 2.0 | 1.0 | 817 | $1,300 | $1.59 | 23d | 1 | 0.98mi |
| 515 Oregon Ave Lakeland, FL | 3.0 | 2.0 | 1024 | $1,500 | $1.46 | 3d | 1 | 1.00mi |
| 1514 Alice Ave Lakeland, FL | 3.0 | 2.0 | 924 | $1,250 | $1.35 | 14d | 1 | 1.16mi |
| 512 Dade Ave Lakeland, FL | 2.0 | 1.0 | 936 | $1,149 | $1.23 | 23d | 1 | 1.21mi |
| 510 Dade Ave Lakeland, FL | 2.0 | 1.0 | 936 | $1,149 | $1.23 | 14d | 1 | 1.21mi |
| 1301 W Walnut St Lakeland, FL | 3.0 | 1.0 | 756 | $1,300 | $1.72 | 14d | 1 | 1.25mi |
| 518 Pinewood Ave Lakeland, FL | 2.0 | 1.0 | 891 | $1,175 | $1.32 | 23d | 1 | 1.26mi |
| 1206 W Highland St Lakeland, FL | 2.0 | 1.0 | 972 | $1,495 | $1.54 | 23d | 1 | 1.28mi |
| 1213 W Patterson St Lakeland, FL | 3.0 | 1.0 | 840 | $1,350 | $1.61 | 14d | 1 | 1.29mi |
| 1113 S Central Ave Lakeland, FL | 3.0 | 1.0 | 672 | $1,700 | $2.53 | 11d | 1 | 1.33mi |
| 808 S Central Ave Lakeland, FL | 2.0 | 1.0 | 700 | $1,100 | $1.57 | 23d | 1 | 1.33mi |
| 1149 Sycamore St Unit 1149 Lakeland, FL | 2.0 | 2.0 | 970 | $1,700 | $1.75 | 23d | 1 | 1.41mi |
| 1139 Olive St Lakeland, FL | 2.0 | 2.0 | 984 | $1,725 | $1.75 | 3d | 1 | 1.42mi |
| 806 N Swindell Ave Lakeland, FL | 3.0 | 2.0 | 995 | $1,450 | $1.46 | 23d | 1 | 1.43mi |
| 1040 Ruby St Lakeland, FL | 3.0 | 2.0 | 1110 | $1,595 | $1.44 | 10d | 1 | 1.49mi |
Listing history 2 events
-
2026-06-18remarks 699-char remark
-
2026-06-18$60,000 Active 1 DOM
ⓘ Source: listings_history table (triggers on properties + properties_extension) + one-shot
backfill from property_details.listing_events for pre-trigger history.
Tax reassessment forecast FL · Resets to sale price
- Current annual tax
- $1,417 · $118/mo
- Projected year-2 tax
- $1,417 · $118/mo
- Expected delta
- $0/yr ($0/mo · 0.0%)
ⓘ Screening estimate from a state-policy table — verify with the county assessor before closing.
Climate risk First Street
- Flood 4/10 Moderate FEMA zone X (unshaded) · 20% chance over 30 yrs
- Wildfire 3/10 Moderate
- Heat 8/10 Severe 7 d/yr ≥108°F today · 22 d/yr by 30 yrs out
- Wind 10/10 Extreme 99% chance of damaging wind over 30 yrs
- Air quality 2/10 Low 1 unhealthy d/yr today · 2 by 30 yrs out
Nearby sold comps map
Loading sold comps map…
Walkable amenities ~0.75 mi
Loading nearby amenities…
Taxation est. · year 1
- Rental income
- $17,362
- − Mortgage interest
- −$3,361
- − Property taxes
- −$1,417
- − Insurance
- −$300
- − Repairs & maintenance
- −$1,389
- − Management
- −$1,389
- − Depreciation
- −$1,745
- Taxable income
- $7,760
- Est. tax owed @ 24.0%
- −$1,862
- After-tax cash flow
- $6,360/yr
For passive investors: Depreciation is non-cash, so a rental often shows a tax loss while cash-flowing — sheltering income. Rental losses are passive: they offset passive income freely, and up to $25,000/yr can offset ordinary (W-2) income if you actively participate and your MAGI is under $100k (phasing out to $0 by $150k); unused losses carry forward. On sale, claimed depreciation is recaptured at up to 25%, and gains may owe capital-gains tax (a 1031 exchange can defer both). Figures are a year-1 estimate at your 24.0% rate — not tax advice; consult a CPA.
Schools (NCES district)
- District
- Polk
- NCES district ID
- 1201590
- Math proficiency
- 39% ▼ -11.00%
- Reading proficiency
- 43% ▼ -4.00%
- Median HH income
- $43,979
- Composite
- 34.74/100
- National rank
- #5132
- State rank
- #62 of 73 in FL
Livability — Lakeland
- Score
- 77/100
- State rank
- #206
- US rank
- #3179
Category grades
Schools grade is shown separately in the Schools card above.
Census & demographics
- County
- Polk County · 740,051 people
- City population
- 277,690
- Metro
- Lakeland-Winter Haven, FL
- Population (ZIP)
- 13,975
- Household income
- $37,487
- Rent vs Own
- Severe rent burden
- 700.0
Population outlook (Polk County) Hauer SSP2
- Today (2025)
- 752,975 people
- By 2030
- 804,621 · +6.9%
- By 2040
- 906,117 · +20.3%
- By 2050
- 1,000,476 · +32.9%
- By 2075
- 1,197,520 · +59.0%
- By 2100
- 1,271,518 · +68.9%
Race, ethnicity, and origin ACS 2023
- Neighborhood character
- Diverse neighborhood (Simpson 0.67)
- Race & ethnicity
- White 43% Black 27% Hispanic / Latino 26% Two or more races 10% Asian 1%
- Hispanic origin (detail)
- Mexican 12% Puerto Rican 10%
- Common ancestry
- Romanian 1% German 1% Lithuanian 1%
- Foreign-born
- 11% · Canada, Jamaica, China
- Languages at home
- 75% English-only · Spanish 23% German/W. Germanic 1%
Political lean MEDSL · Polk
- 2024 margin
- Strong R (+20.7) · D 39.2% · R 59.9%
- 2008→2024 swing
- -14.6pp toward R · 2008: -6.1pp · 2024: -20.7pp
- All cycles
- 2024: R+20.7 2020: R+14.4 2016: R+14.1 2012: R+6.8 2008: R+6.1
Not yet ingested
- Civics
- —
Market trends
- HPI YoY
- ▲ 47.45%
- Current HPI
- 424.0956
- Rent YoY
- ▲ 6.14%
- Metro
- Lakeland-Winter Haven, FL
- State GDP YoY
- ▲ 3.28%
- F500 in state
- 36
Industry mix (Fortune 500 HQ in FL)
| Industry | F500 HQs | Revenue |
|---|---|---|
| Industrial Technology | 2 | $29B |
|
||
| Insurance | 2 | $17B |
|
||
| Retail | 1 | $60B |
|
||
| Technology Distribution | 1 | $58B |
|
||
| Homebuilding | 1 | $35B |
|
||
| Technology Manufacturing | 1 | $35B |
|
||
Price history
+172.7% since first listed3 events — show timeline
- 2026-06-18 Listed $60,000 Stellar MLS as Distributed by MLS Grid
- 1996-09-16 Sold (Public Records) $37,000 Public Records
- 1990-05-01 Sold (Public Records) $22,000 Public Records
Property tax history
+18.9%/yrLatest (2025): $1,417 · +12.4% YoY. Source: county tax records.
Cash-flow waterfall
monthlySold comps — $/sqft
last 12 mo · ≤1 miLoading sold comps…