 🏷️ Likely Rental
2423 Eagle Ct #2423 · Hoover, AL
Flood risk 1/10 · Minimal
- FEMA flood zone
- X (unshaded)
- Chance of flooding over 30 yrs
- 0.0%
- Est. flood insurance / yr
- $507 – $1,088
Fire risk 1/10 · Minimal
- Est. fire insurance / yr
- $916 – $1,700
Heat risk 7/10 · Major
- Hot days now (above 107°F)
- 7 days/yr
- Hot days in 30 yrs
- 19 days/yr
Wind risk 6/10 · Moderate
- Chance of severe wind over 30 yrs
- 27.0%
Air-quality risk 4/10 · Minor
- Unhealthy air days now
- 6 days/yr
- Unhealthy air days in 30 yrs
- 6 days/yr
Risk factors via First Street. Map © Google.
Why this score? — see what drove the C+ grade
The composite is a weighted blend of 9 inputs, each scored 0–100. Each bar is that input's sub-score; the figure is the points it added to the 100-point composite (weight × sub-score).
- Cash flow +20.3/30.0
- ARV discount +15.0/15.0
- DSCR +6.4/10.0
- 1% rule +5.4/10.0
- Livability +4.2/5.0
- Condition / age +4.0/5.0
- Rent growth +3.1/5.0
- Schools +1.8/10.0
- Appreciation +0.0/10.0
$230,000
🖨 Deal sheet 📄 Offer letter ✓ Due diligence
Listing remarks MLS
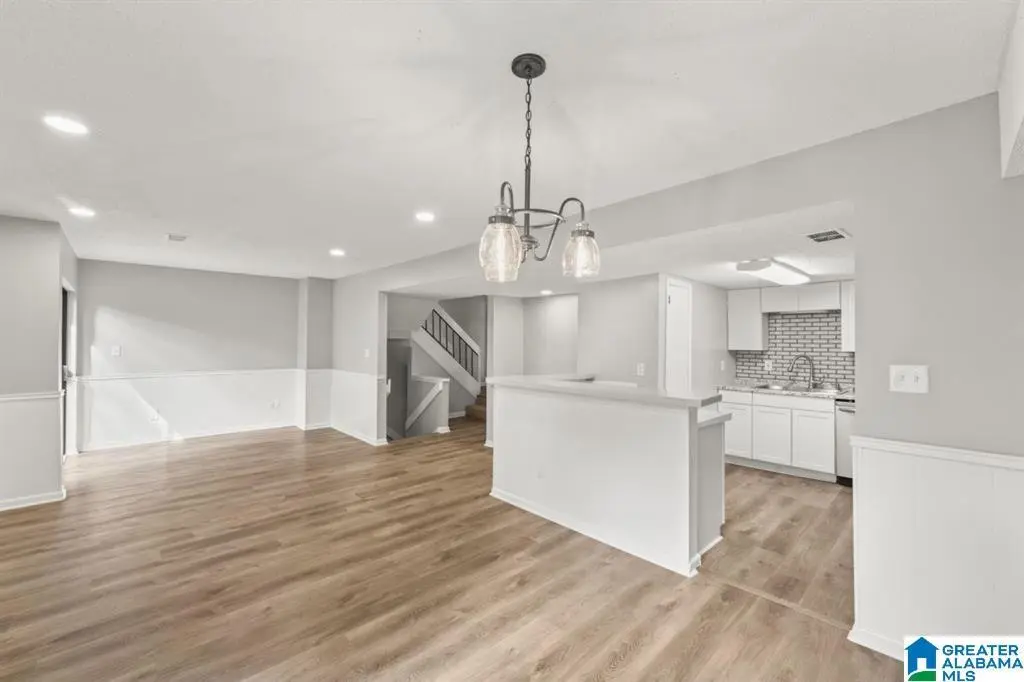
Est Mortgage Payment $2,300 a month Including HOA fee. This unique 5-bedroom, 3-bath condo offers a rare combination of space, flexibility, and opportunity. Currently tenant-occupied, the property can be purchased with tenants in place for immediate cash flow or delivered vacant for owner-occupancy. The versatile layout allows for multiple living arrangements, making it ideal for investors, house-hackers, or buyers seeking extra room. The HOA is actively completing major exterior renovations, including a new roof, new siding, fresh paint, and additional upgrades, adding long-term value and curb appeal. Whether you’re looking to invest or move in, this property checks the boxes.
Key facts
- Additional upgrades
- New siding
- Fresh paint
Tags
Neighborhood map
What this means for you Summary
Snapshot
- This is a 5-bed/2.5-bath condo listed at $230k. Condition is rated good.
Deal economics
- At list price, monthly cash flow is $295 ($4k/yr) — positive.
- The deal already cash-flows at list — no discount required.
- Meets the 1% rule at list price ($2k rent vs $230k).
- Recommended offer: $202k (12.0% below list) — sets the bar for market timing.
- Cap rate 7.8% vs local median 2.4% in Hoover — top-decile yield for the area; either an underpriced asset or a hidden risk that comps aren't pricing in. Stress-test before assuming the spread holds.
Location & tenants
- Location reads 84/100 on livability (#1 in AL, #630 nationally) — a professional / high-income tenant draw. Strengths: crime A+, employment A+, housing A+.
- Jefferson County (suburban): math 9% / reading 32% proficiency, ranked #104 of 129 in AL (top 81%) — low school quality limits family demand, transient renter base, plan for 1-2y turnover.
- Market conditions: Rents rising (+2.6%/yr); 135 active listings in the ZIP; 3 comparable units currently listed for rent nearby; rentals at typical pace (median 14d on market — plan ~3-4 weeks tenant-placement turnaround); 2,114 units permitted in Jefferson County in 2024 (556 in 5+ unit buildings).
- This rent runs 38% of the median local income ($75k/yr) — at the standard rent-burdened threshold; future hikes will face affordability resistance.
Forward outlook
- Local home prices are declining (-3.0%/yr); year-one equity from $2k of loan paydown is wiped out by about $7k of value loss. Plan a longer hold.
- Jefferson County population projected to shrink 4% by 2050 — rents likely to lag national; underwrite the cash flow, not the appreciation.
Negotiation context
- It's been on market 136 days — a 12% lower offer ($202k) is reasonable based on typical stale-listing flexibility.
Risks & watch-outs
- Climate carrying-cost: major wind risk, 27% chance of damaging wind over 30y; extreme-heat days projected 7→19/yr by 2055 (HVAC capex compounding) — expect insurance premiums to compound above CPI over the hold.
Questions for the listing agent
- It's been on market 136 days. Have you received any prior offers? Is the seller open to a 12% concession, seller financing, or rate buy-down credit?
- Built in 1978 — when were the roof, HVAC, electrical panel, plumbing, and water heater last replaced?
- Any open or pending special assessments — roof, HVAC, plumbing, elevator, façade? What's the per-unit balance and payoff schedule, and is the seller paying it off at close or rolling it to the buyer?
- Why hasn't it sold? Are there any deal-killer items the seller is aware of (foundation, flood, title, zoning, code violations)?
- Is there a deadline driving the sale (1031 exchange, divorce, estate, relocation)? That informs how much negotiation room exists.
- Schools are A-rated — typically a magnet for longer-tenancy family renters. What's the average tenant stay here, and is there a school-zone premium baked into asking?
- What's the average days-on-market for RENTAL listings here right now (not sales)? A rising rental-DOM trend means longer vacancies and softer asking-rent achievability than the comps imply.
- What's the recent tenant-quality profile in this submarket — average credit score on applications, eviction rate, late-payment / NSF rate, and stable-employment percentage? A property-management company in the area should have these aggregated.
- How much new apartment / multifamily construction is in the pipeline within 1–3 miles? Heavy new supply (>2% of stock underway) typically softens rents 12–24 months out; light construction supports rent growth.
Investment metrics
- 1% rule
- 1.04% ✓
- Cap rate
- 7.83%
- Cash-on-cash
- 5.50%
- DSCR
- 1.24
- GRM
- 8.0
CMA / ARV
- ARV (median comp)
- $327,738
- List price
- $230,000
- Delta
- -29.82%
- Verdict
- UNDERPRICED
- Comps
- 11 within 1.0 mi
Projected returns pro-forma
-3.0% appreciation · 2.59% rent growth · sell at horizon
- IRR
- -8.2%
- Equity multiple
- 0.70×
- Total profit
- $-19,410
- Equity at exit
- $34,294
- IRR
- 0.8%
- Equity multiple
- 1.05×
- Total profit
- $3,468
- Equity at exit
- $19,886
Cash invested: $64,400 (down + closing). Projections, not guarantees.
Landlord ↔ Tenant lean methodology
- Overall (STATE)
- 90 Strongly Landlord-Friendly
- State Alabama
- 90 Strongly Landlord-Friendly · R+15
- County
- — inherits STATE
- City
- — inherits STATE
ZIP-level market 35216
- Rents YoY
- 2.6%
- Active inventory
- 135
- Price-to-rent
- 8.0×
Monthly cashflow live
- Estimated rent
- $2,386 medium interval (Pro) →
- Mortgage (P&I)
- −$1,206
- Tax est. 1.5%
- −$288 /mo · $3,450/yr
- Insurance
- −$96
- HOA
- −$0
- Vacancy / Maint / Mgmt
- −$501
- Net cashflow
- $295
Break-even live
UW: 25.0% down · 7.5% · 30yr · 1.5% tax · 5.0% vac · 8.0% maint · 8.0% mgmt
Financing live
Cash to close
- Down payment
- $57,500
- Closing costs
- $6,900
- Reserves months
- —
- Total cash needed
- —
Loan-product check · same deal, 3 products live
Conventional
25% down · 7.5% · 30yr
- Down + closing
- —
- Monthly P&I
- —
- Monthly cashflow
- —
- DSCR
- —
- Eligible?
- —
Personal DTI + credit; lowest rate.
DSCR
20% down · 8.5% · 30yr
- Down + closing
- —
- Monthly P&I
- —
- Monthly cashflow
- —
- DSCR
- —
- Eligible?
- —
No personal income docs; deal must DSCR.
Hard money
10% down · 12.0% · 12mo
- Down + closing
- —
- Monthly P&I
- —
- Monthly cashflow
- —
- DSCR
- —
- Eligible?
- —
Short-term bridge; refi at stabilization.
Rent comps 3 comps
| Address | Beds | Baths | Sqft | Rent | $/sqft | DOM | Units | Dist |
|---|---|---|---|---|---|---|---|---|
| 1212 Riverford Dr Hoover, AL | 4.0 | 2.5 | 2368 | $2,320 | $0.98 | 14d | 1 | 0.18mi |
| 1208 Riverford Dr Hoover, AL | 4.0 | 3.5 | 2396 | $2,270 | $0.95 | 1d | 1 | 0.19mi |
| 3454 Heather Ln Hoover, AL | 4.0 | 3.0 | 2176 | $2,600 | $1.19 | 21d | 1 | 0.87mi |
HOA detail condo
- Monthly dues
- $0 · $0/yr
- Assessments
- None detected in remarks — confirm with the listing agent.
Listing history 19 events
-
2026-06-18days on market $230,000 Active 136 DOM
-
2026-06-17days on market $230,000 Active 135 DOM
-
2026-06-16days on market $230,000 Active 134 DOM
-
2026-06-15days on market $230,000 Active 133 DOM
-
2026-06-13days on market $230,000 Active 131 DOM
-
2026-06-10days on market $230,000 Active 128 DOM
-
2026-06-09days on market $230,000 Active 127 DOM
-
2026-06-08days on market $230,000 Active 126 DOM
-
2026-06-07days on market $230,000 Active 125 DOM
-
2026-06-03days on market $230,000 Active 121 DOM
-
2026-06-02days on market $230,000 Active 120 DOM
-
2026-06-01days on market $230,000 Active 119 DOM
-
2026-05-31days on market $230,000 Active 118 DOM
-
2026-02-02$230,000 Active 692-char remark
Show marketing remark (692 chars)
Est Mortgage Payment $2,300 a month Including HOA fee. This unique 5-bedroom, 3-bath condo offers a rare combination of space, flexibility, and opportunity. Currently tenant-occupied, the property can be purchased with tenants in place for immediate cash flow or delivered vacant for owner-occupancy. The versatile layout allows for multiple living arrangements, making it ideal for investors, house-hackers, or buyers seeking extra room. The HOA is actively completing major exterior renovations, including a new roof, new siding, fresh paint, and additional upgrades, adding long-term value and curb appeal. Whether you’re looking to invest or move in, this property checks the boxes.
-
2024-10-12price $215,000
-
2024-02-12price $235,000
-
2024-01-27price $245,000
-
2024-01-12price $249,900
-
2023-09-22price $254,900
ⓘ Source: listings_history table (triggers on properties + properties_extension) + one-shot
backfill from property_details.listing_events for pre-trigger history.
Climate risk First Street
- Flood 1/10 Low FEMA zone X (unshaded) · 0% chance over 30 yrs
- Wildfire 1/10 Low
- Heat 7/10 Severe 7 d/yr ≥107°F today · 19 d/yr by 30 yrs out
- Wind 6/10 Major 27% chance of damaging wind over 30 yrs
- Air quality 4/10 Moderate 6 unhealthy d/yr today · 6 by 30 yrs out
Nearby sold comps map
Loading sold comps map…
Walkable amenities ~0.75 mi
Loading nearby amenities…
Taxation est. · year 1
- Rental income
- $28,629
- − Mortgage interest
- −$12,884
- − Property taxes
- −$3,450
- − Insurance
- −$1,150
- − Repairs & maintenance
- −$2,290
- − Management
- −$2,290
- − Depreciation
- −$6,691
- Taxable loss
- −$126
- Est. tax savings @ 24.0%
- +$30
- After-tax cash flow
- $3,573/yr
For passive investors: Depreciation is non-cash, so a rental often shows a tax loss while cash-flowing — sheltering income. Rental losses are passive: they offset passive income freely, and up to $25,000/yr can offset ordinary (W-2) income if you actively participate and your MAGI is under $100k (phasing out to $0 by $150k); unused losses carry forward. On sale, claimed depreciation is recaptured at up to 25%, and gains may owe capital-gains tax (a 1031 exchange can defer both). Figures are a year-1 estimate at your 24.0% rate — not tax advice; consult a CPA.
Condition & rehab AI · 1 photo
This well-maintained and updated condo is in excellent condition, ready for immediate occupancy. It offers a spacious layout and is located in a desirable area, making it an attractive investment opportunity.
Value-add opportunities
- Both Painting the interior walls — Fresh paint can enhance the home's appeal and value.
- Both Landscaping improvements — Enhanced curb appeal can attract more buyers and renters.
- Both Adding smart home features — Modern technology can increase the home's marketability and rental potential.
- Both Upgrading the kitchen appliances — Modern appliances can make the kitchen more functional and attractive to potential buyers and renters.
Renovation cost estimate screening
Value-add ROI direction
- Both Painting the interior walls — Fresh paint can enhance the home's appeal and value. ↑
- Both Landscaping improvements — Enhanced curb appeal can attract more buyers and renters. ↑
- Both Adding smart home features — Modern technology can increase the home's marketability and rental potential. ↑
- Both Upgrading the kitchen appliances — Modern appliances can make the kitchen more functional and attractive to potential buyers and renters. ↑
ⓘ Cost ranges are severity-bucket heuristics (US national rule-of-thumb). Get contractor quotes + a written scope before underwriting a rehab budget.
Schools (NCES district)
- District
- Jefferson County
- NCES district ID
- 0101920
- Math proficiency
- 9% ▼ -24.00%
- Reading proficiency
- 32% ▼ -5.00%
- Median HH income
- $51,712
- Composite
- 18.4/100
- National rank
- #8937
- State rank
- #104 of 129 in AL
Livability — Hoover
- Score
- 84/100
- State rank
- #1
- US rank
- #630
Category grades
Schools grade is shown separately in the Schools card above.
Census & demographics
- County
- Jefferson County · 527,445 people
- City population
- 76,805
- Metro
- Birmingham-Hoover, AL
- Population (ZIP)
- 34,327
- Household income
- $74,525
- Rent vs Own
- Severe rent burden
- 1747.0
Population outlook (Jefferson County) Hauer SSP2
- Today (2025)
- 669,185 people
- By 2030
- 669,694 · +0.1%
- By 2040
- 661,388 · -1.2%
- By 2050
- 643,086 · -3.9%
- By 2075
- 577,267 · -13.7%
- By 2100
- 474,758 · -29.1%
Race, ethnicity, and origin ACS 2023
- Neighborhood character
- Diverse neighborhood (Simpson 0.56)
- Race & ethnicity
- White 61% Black 24% Hispanic / Latino 8% Asian 5% Two or more races 4% Native American 1%
- Hispanic origin (detail)
- Mexican 4%
- Common ancestry
- Slovak 3% Serbian 2% Italian 2%
- Foreign-born
- 8% · Canada, China, South Korea
- Languages at home
- 88% English-only · Spanish 6% Other Indo-European 2% Arabic 1%
Political lean MEDSL · Jefferson
- 2024 margin
- D (+10.4) · D 54.6% · R 44.2% · Other 1.2%
- 2008→2024 swing
- +5.4pp toward D · 2008: 5.1pp · 2024: 10.4pp
- All cycles
- 2024: D+10.4 2020: D+13.2 2016: D+7.2 2012: D+6.0 2008: D+5.1
Not yet ingested
- Civics
- —
Market trends
- HPI YoY
- ▼ -259.83%
- Current HPI
- 239.8705
- Rent YoY
- ▲ 2.59%
- Metro
- Birmingham-Hoover, AL
- State GDP YoY
- ▲ 2.94%
- F500 in state
- 4
Industry mix (Fortune 500 HQ in AL)
| Industry | F500 HQs | Revenue |
|---|---|---|
| Financial Services | 1 | $8B |
|
||
| Healthcare | 1 | $5B |
|
||
Price history
-9.8% since first listed6 events — show timeline
- 2026-02-02 Listed $230,000 Greater Alabama MLS
- 2024-10-12 Price Changed $215,000 Greater Alabama MLS
- 2024-02-12 Price Changed $235,000 Greater Alabama MLS
- 2024-01-27 Price Changed $245,000 Greater Alabama MLS
- 2024-01-12 Price Changed $249,900 Greater Alabama MLS
- 2023-09-22 Price Changed $254,900 Greater Alabama MLS
Cash-flow waterfall
monthlySold comps — $/sqft
last 12 mo · ≤1 miLoading sold comps…