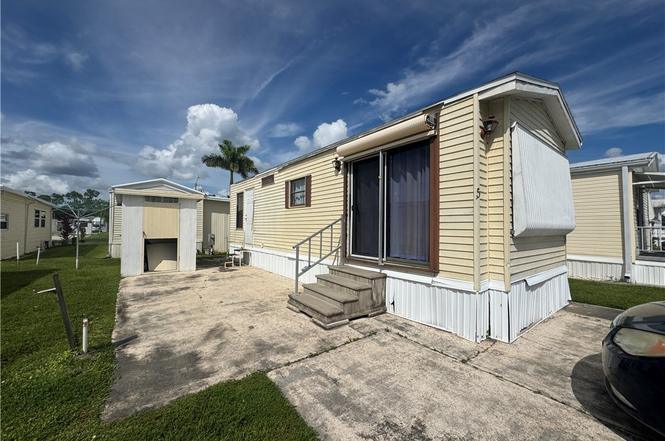
5 Fountain View Blvd · North Fort Myers, FL
Flood risk 1/10 · Minimal
- FEMA flood zone
- X (unshaded)
- Chance of flooding over 30 yrs
- 0.0%
- Est. flood insurance / yr
- $507 – $1,088
Fire risk 6/10 · Moderate
- Est. fire insurance / yr
- $947 – $1,759
Heat risk 10/10 · Severe
- Hot days now (above 107°F)
- 7 days/yr
- Hot days in 30 yrs
- 31 days/yr
Wind risk 10/10 · Severe
- Chance of severe wind over 30 yrs
- 99.0%
Air-quality risk 2/10 · Minimal
- Unhealthy air days now
- 1 days/yr
- Unhealthy air days in 30 yrs
- 1 days/yr
Risk factors via First Street. Map © Google.
Why this score? — see what drove the B+ grade
The composite is a weighted blend of 9 inputs, each scored 0–100. Each bar is that input's sub-score; the figure is the points it added to the 100-point composite (weight × sub-score).
- Cash flow +30.0/30.0
- ARV discount +15.0/15.0
- 1% rule +10.0/10.0
- DSCR +10.0/10.0
- Schools +4.1/10.0
- Livability +3.7/5.0
- Condition / age +2.5/5.0
- Rent growth +2.0/5.0
- Appreciation +0.0/10.0
$49,950
🖨 Deal sheet 📄 Offer letter ✓ Due diligence
Listing remarks MLS
J. U. S. T. .. .R. E. D. U. C. E. D. .. . $ 5 , 0 0 0.. .. .To. .. .. $ 2 4 , 9 9 9 . Beautiful Very Active Park, Dancing, Dinners Swimming, Hot Tub, Tennis, Sauna, Pool Tables, Volleyball Etc. All For $ 8 3 . 0 0 / Mo. Vacantnote: Fee Incl. Water/Sewer & Cable. Adult Park
Key facts
- Small detached shed
- Laminate flooring
- Turnkey property
Tags
Property features AI
Finance
- Other: Zoning described as RV
- Financial info: Pets allowed with conditions (call for details); maximum 1 pet up to 20 lb
- HOA & community: Homeowners association with a monthly fee of $265; Association covers cable TV, grounds maintenance, recreation facilities, reserve fund, road maintenance, sewer, street lights, and water; Association amenities include clubhouse, pool, spa/hot tub, sport courts (tennis, basketball), bocce court, laundry facilities, RV/boat storage, and management; Community is non-gated with street lights; Senior community; Community contains approximately 400 units
Exterior
- Parking: No parking details provided
- Security: No security features listed
- Utilities: Public water; Public sewer; Cable available
- Home design: Manufactured home; Single-story; Entry level: 1; Faces south; North exposure
- Construction: Vinyl siding; Shingle roof; Resale property
- Exterior features: No notable exterior features listed; Community pool
Interior
- Kitchen: Freezer; Microwave; Range; Refrigerator
- Bedrooms: No room-specific bedroom info provided
- Flooring: Laminate
- Bathrooms: 1 full bathroom
- Heating & cooling: Central heating (electric); Central air conditioning (electric)
- Interior features: Furnished; Living/Dining room; Single hung windows
- Laundry & utility: Common area laundry
Neighborhood map
What this means for you Summary
Snapshot
- This is a 1-bed/1.0-bath manufactured listed at $50k.
Deal economics
- At list price, monthly cash flow is $323 ($4k/yr) — positive.
- The deal already cash-flows at list — no discount required.
- Meets the 1% rule at list price ($1k rent vs $50k).
- Recommended offer: $44k (12.0% below list) — sets the bar for market timing.
- Cap rate 14.0% vs local median 3.6% in North Fort Myers — top-decile yield for the area; either an underpriced asset or a hidden risk that comps aren't pricing in. Stress-test before assuming the spread holds.
Location & tenants
- Location reads 74/100 on livability (#269 in FL, #4,409 nationally) — a middle-class / working-renter tenant base. Strengths: cost of living A+, housing A+, health & safety A+; Watch: employment C-, amenities F, commute F.
- Lee (suburban): math 47% / reading 50% proficiency, ranked #42 of 73 in FL (top 58%) — families likely to look elsewhere, expect single-tenant / working-renter base with shorter leases.
- Market conditions: Rents soft (-1.9%/yr); 472 active listings in the ZIP; 15,411 units permitted in Lee County in 2024 (4,686 in 5+ unit buildings).
Forward outlook
- Local home prices are declining (-3.0%/yr); year-one equity from $346 of loan paydown is wiped out by about $1k of value loss. Plan a longer hold.
- Lee County population projected at +44% by 2050 — long-run rental-demand tailwind backs the buy-and-hold thesis.
- At projected returns (-3.0% appreciation + 0.0% rent growth), your $14k cash investment doubles in ~6 years — after that, you're playing with house money.
Negotiation context
- It's been on market 218 days — a 12% lower offer ($44k) is reasonable based on typical stale-listing flexibility.
- 2 sale attempts; this cycle's ask has dropped $5k (9%) from the opening price — seller is motivated, your offer sets the floor, not the list.
- Current owner paid $20k; list at $50k implies a 150% gain — meaningful room to come down on a strong offer.
Risks & watch-outs
- Watch-outs: HOA is 22% of rent.
- Climate carrying-cost: severe wind risk, 99% chance of damaging wind over 30y; major wildfire risk; extreme-heat days projected 7→31/yr by 2055 (HVAC capex compounding) — expect insurance premiums to compound above CPI over the hold.
Questions for the listing agent
- It's been on market 218 days. Have you received any prior offers? Is the seller open to a 12% concession, seller financing, or rate buy-down credit?
- What does the HOA fee cover, when was the last increase, and are there any pending special assessments or reserve-fund shortfalls?
- Why hasn't it sold? Are there any deal-killer items the seller is aware of (foundation, flood, title, zoning, code violations)?
- Is there a deadline driving the sale (1031 exchange, divorce, estate, relocation)? That informs how much negotiation room exists.
- What's the average days-on-market for RENTAL listings here right now (not sales)? A rising rental-DOM trend means longer vacancies and softer asking-rent achievability than the comps imply.
- What's the recent tenant-quality profile in this submarket — average credit score on applications, eviction rate, late-payment / NSF rate, and stable-employment percentage? A property-management company in the area should have these aggregated.
- How much new for-sale + rental construction is in the pipeline within 1–3 miles? Heavy new supply typically softens prices + rents 12–24 months out; constrained supply supports both.
Investment metrics
- 1% rule
- 2.46% ✓
- Cap rate
- 14.04%
- Cash-on-cash
- 27.67%
- DSCR
- 2.23
- GRM
- 3.4
CMA / ARV
- ARV (on-the-fly)
- $61,200
- Comps found
- 2
Show comp detail 2 sales within ~0.75 mi
| Address | Dist | Beds/Ba | Sqft | Sold | Price | $/sf | Match |
|---|---|---|---|---|---|---|---|
| 169 Vista Mar Dr | 0.16mi | 1/1.0 | 386 (-5%) | 6mo | $30,000 | $78 | 78 |
| 10 Fountain View Blvd | 0.03mi | 1/1.5 | 442 (+8%) | 22mo | $66,500 | $150 | 64 |
Match score weights: distance 35% · size 25% · config 20% · recency 20%. Top-matched comps best support the ARV.
Projected returns pro-forma
-3.0% appreciation · 0.0% rent growth · sell at horizon
- IRR
- 16.9%
- Equity multiple
- 1.65×
- Total profit
- $9,045
- Equity at exit
- $7,448
- IRR
- 22.1%
- Equity multiple
- 2.52×
- Total profit
- $21,219
- Equity at exit
- $4,319
Cash invested: $13,986 (down + closing). Projections, not guarantees.
Landlord ↔ Tenant lean methodology
- Overall (STATE)
- 87 Strongly Landlord-Friendly
- State Florida
- 87 Strongly Landlord-Friendly · R+3
- County
- — inherits STATE
- City
- — inherits STATE
ZIP-level market 33903
- Rents YoY
- -1.9%
- Active inventory
- 472
- Price-to-rent
- 3.4×
Monthly cashflow live
- Estimated rent
- $1,231 medium interval (Pro) →
- Mortgage (P&I)
- −$262
- Tax from tax record
- −$102 /mo · $1,229/yr
- Insurance
- −$21
- HOA
- −$265
- Vacancy / Maint / Mgmt
- −$259
- Net cashflow
- $323
Break-even live
UW: 25.0% down · 7.5% · 30yr · 1.5% tax · 5.0% vac · 8.0% maint · 8.0% mgmt
Financing live
Cash to close
- Down payment
- $12,488
- Closing costs
- $1,498
- Reserves months
- —
- Total cash needed
- —
Loan-product check · same deal, 3 products live
Conventional
25% down · 7.5% · 30yr
- Down + closing
- —
- Monthly P&I
- —
- Monthly cashflow
- —
- DSCR
- —
- Eligible?
- —
Personal DTI + credit; lowest rate.
DSCR
20% down · 8.5% · 30yr
- Down + closing
- —
- Monthly P&I
- —
- Monthly cashflow
- —
- DSCR
- —
- Eligible?
- —
No personal income docs; deal must DSCR.
Hard money
10% down · 12.0% · 12mo
- Down + closing
- —
- Monthly P&I
- —
- Monthly cashflow
- —
- DSCR
- —
- Eligible?
- —
Short-term bridge; refi at stabilization.
HOA detail
- Monthly dues
- $265 · $3,180/yr
- Likely covers
- watersewercablepool
Listing history 8 events
-
2026-05-20status Pending
-
2026-04-01price $49,950
-
2026-03-02status Active
-
2026-02-14status Pending
-
2025-09-22$55,000 Active
-
2002-11-27soldstatus $20,000 280-char remark
Show marketing remark (280 chars)
J. U. S. T. .. .R. E. D. U. C. E. D. .. . $ 5 , 0 0 0.. .. .To. .. .. $ 2 4 , 9 9 9 . Beautiful Very Active Park, Dancing, Dinners Swimming, Hot Tub, Tennis, Sauna, Pool Tables, Volleyball Etc. All For $ 8 3 . 0 0 / Mo. Vacantnote: Fee Incl. Water/Sewer & Cable. Adult Park
-
2002-11-08price $24,999 280-char remark
Show marketing remark (280 chars)
J. U. S. T. .. .R. E. D. U. C. E. D. .. . $ 5 , 0 0 0.. .. .To. .. .. $ 2 4 , 9 9 9 . Beautiful Very Active Park, Dancing, Dinners Swimming, Hot Tub, Tennis, Sauna, Pool Tables, Volleyball Etc. All For $ 8 3 . 0 0 / Mo. Vacantnote: Fee Incl. Water/Sewer & Cable. Adult Park
-
1990-03-13soldstatus $18,500
ⓘ Source: listings_history table (triggers on properties + properties_extension) + one-shot
backfill from property_details.listing_events for pre-trigger history.
Tax reassessment forecast FL · Resets to sale price
- Current annual tax
- $1,229 · $102/mo
- Projected year-2 tax
- $1,229 · $102/mo
- Expected delta
- $0/yr ($0/mo · 0.0%)
ⓘ Screening estimate from a state-policy table — verify with the county assessor before closing.
Climate risk First Street
- Flood 1/10 Low FEMA zone X (unshaded) · 0% chance over 30 yrs
- Wildfire 6/10 Major
- Heat 10/10 Extreme 7 d/yr ≥107°F today · 31 d/yr by 30 yrs out
- Wind 10/10 Extreme 99% chance of damaging wind over 30 yrs
- Air quality 2/10 Low 1 unhealthy d/yr today · 1 by 30 yrs out
Nearby sold comps map
Loading sold comps map…
Walkable amenities ~0.75 mi
Loading nearby amenities…
Taxation est. · year 1
- Rental income
- $14,775
- − Mortgage interest
- −$2,798
- − Property taxes
- −$1,229
- − Insurance
- −$250
- − Repairs & maintenance
- −$1,182
- − Management
- −$1,182
- − HOA
- −$3,180
- − Depreciation
- −$1,453
- Taxable income
- $3,501
- Est. tax owed @ 24.0%
- −$840
- After-tax cash flow
- $3,030/yr
For passive investors: Depreciation is non-cash, so a rental often shows a tax loss while cash-flowing — sheltering income. Rental losses are passive: they offset passive income freely, and up to $25,000/yr can offset ordinary (W-2) income if you actively participate and your MAGI is under $100k (phasing out to $0 by $150k); unused losses carry forward. On sale, claimed depreciation is recaptured at up to 25%, and gains may owe capital-gains tax (a 1031 exchange can defer both). Figures are a year-1 estimate at your 24.0% rate — not tax advice; consult a CPA.
Schools (NCES district)
- District
- Lee
- NCES district ID
- 1201080
- Math proficiency
- 47% ▼ -11.00%
- Reading proficiency
- 50% ▼ -4.00%
- Median HH income
- $49,518
- Composite
- 41.49/100
- National rank
- #3458
- State rank
- #42 of 73 in FL
Livability — North Fort Myers
- Score
- 74/100
- State rank
- #269
- US rank
- #4409
Category grades
Schools grade is shown separately in the Schools card above.
Census & demographics
- Census place
- North Fort Myers, FL
- County
- Lee County · 788,662 people
- City population
- 57,035
- Metro
- Cape Coral-Fort Myers, FL
- Population (ZIP)
- 23,655
- Household income
- $56,993
- Rent vs Own
- Severe rent burden
- 468.0
Population outlook (Lee County) Hauer SSP2
- Today (2025)
- 871,946 people
- By 2030
- 955,468 · +9.6%
- By 2040
- 1,113,587 · +27.7%
- By 2050
- 1,256,891 · +44.1%
- By 2075
- 1,560,270 · +78.9%
- By 2100
- 1,726,848 · +98.0%
Race, ethnicity, and origin ACS 2023
- Neighborhood character
- Predominantly White (81%)
- Race & ethnicity
- White 81% Hispanic / Latino 14% Two or more races 8% Black 2%
- Hispanic origin (detail)
- Mexican 3% Puerto Rican 3% Cuban 3%
- Common ancestry
- Lithuanian 4% Romanian 4% Italian 3%
- Foreign-born
- 11% · Canada
- Languages at home
- 88% English-only · Spanish 9% Other Indo-European 1%
Political lean MEDSL · Lee
- 2024 margin
- Strong R (+28.4) · D 35.5% · R 63.9%
- 2008→2024 swing
- -18.0pp toward R · 2008: -10.4pp · 2024: -28.4pp
- All cycles
- 2024: R+28.4 2020: R+19.2 2016: R+20.4 2012: R+16.6 2008: R+10.4
Not yet ingested
- Civics
- —
Market trends
- HPI YoY
- ▼ -172.26%
- Current HPI
- 256.773
- Rent YoY
- ▼ -1.94%
- Metro
- Cape Coral-Fort Myers, FL
- State GDP YoY
- ▲ 3.28%
- F500 in state
- 36
Industry mix (Fortune 500 HQ in FL)
| Industry | F500 HQs | Revenue |
|---|---|---|
| Industrial Technology | 2 | $29B |
|
||
| Insurance | 2 | $17B |
|
||
| Retail | 1 | $60B |
|
||
| Technology Distribution | 1 | $58B |
|
||
| Homebuilding | 1 | $35B |
|
||
| Technology Manufacturing | 1 | $35B |
|
||
Price history
+170.0% since first listed8 events — show timeline
- 2026-05-20 Pending — FORTMLS
- 2026-04-01 Price Changed $49,950 FORTMLS
- 2026-03-02 Relisted — FORTMLS
- 2026-02-14 Pending — FORTMLS
- 2025-09-22 Listed $55,000 FORTMLS
- 2002-11-27 Sold (MLS) $20,000 FORTMLS
- 2002-11-08 Price Changed $24,999 FORTMLS
- 1990-03-13 Sold (Public Records) $18,500 Public Records
Property tax history
+9.9%/yrLatest (2025): $1,229 · +10.0% YoY. Source: county tax records.
Cash-flow waterfall
monthlySold comps — $/sqft
last 12 mo · ≤1 miLoading sold comps…