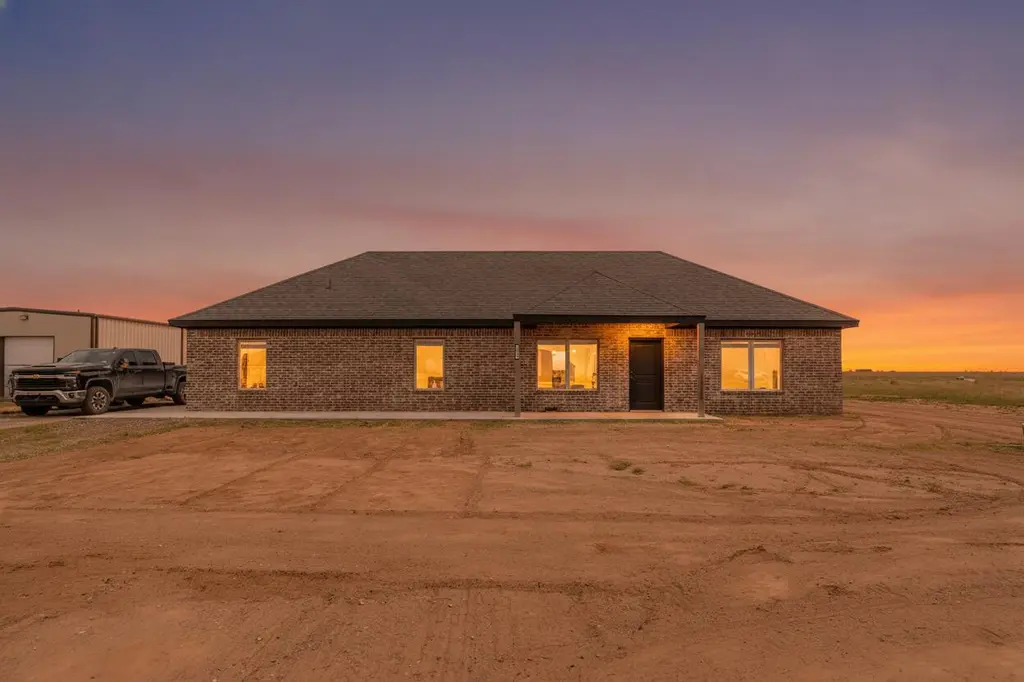
1389 Redhead Rd · New Home, TX
Flood risk No data
- FEMA flood zone
- —
- Chance of flooding over 30 yrs
- —
- Est. flood insurance / yr
- —
Fire risk No data
- Est. fire insurance / yr
- —
Heat risk No data
- Hot days now (above threshold)
- —
- Hot days in 30 yrs
- —
Wind risk No data
- Chance of severe wind over 30 yrs
- —
Air-quality risk No data
- Unhealthy air days now
- —
- Unhealthy air days in 30 yrs
- —
Risk factors via First Street. Map © Google.
Why this score? — see what drove the C grade
The composite is a weighted blend of 9 inputs, each scored 0–100. Each bar is that input's sub-score; the figure is the points it added to the 100-point composite (weight × sub-score).
- Cash flow +18.0/30.0
- ARV discount +7.5/15.0
- Appreciation +6.6/10.0
- Schools +6.1/10.0
- DSCR +5.6/10.0
- 1% rule +4.6/10.0
- Livability +3.5/5.0
- Rent growth +2.5/5.0
- Condition / age +2.5/5.0
$310,000
🖨 Deal sheet 📄 Offer letter ✓ Due diligence
Listing remarks
Experience the best of country living in this beautiful 4-bedroom, 2-bath home built in late 2022 and situated on just over one acre in the highly sought-after New Home Independent School District. With modern construction and room to grow, this property offers the perfect blend of comfort, convenience, and wide-open space. Inside, you'll find a well designed floor plan with spacious living areas and all the benefits of newer construction and 4 true bedrooms! Open concept living space offers sightlines from front to back. The kitchen offers granite counters, A LOT of counter space & Storage PLUS a Texas sized Pantry. Outside, the possibilities are endless. Create your dream shop, add
Key facts
- Modern construction
- Texas sized pantry
- Over an acre of land
Tags
Property features AI
Finance
- Other: Approximately 1.04-acre lot; Road frontage is unimproved with dirt and gravel road surface
Exterior
- Parking: Gravel off-street parking
- Security: Smoke detectors
- Utilities: Private well water; Septic tank sewer
- Home design: Single family residence; One-story
- Construction: Brick construction; Slab foundation; Composition roof; Built as 1,728 above-grade finished area
- Exterior features: Rear porch; Outside storage
Interior
- Bathrooms: 2 full bathrooms
- Heating & cooling: Central heating; Central electric air conditioning
- Interior features: High ceilings; Kitchen island
Neighborhood map
What this means for you Summary
Snapshot
- This is a 4-bed/1.0-bath single-family listed at $310k.
Deal economics
- At list price, monthly cash flow is $265 ($3k/yr) — positive.
- The deal already cash-flows at list — no discount required.
- To meet the 1% rule (rent ≥ 1% of price), the offer needs to be $297k (4.2% below list).
- Recommended offer: $297k (4.2% below list) — sets the bar for 1% rule.
Location & tenants
- Location reads 70/100 on livability (#343 in TX) — a middle-class / working-renter tenant base. Strengths: cost of living A+, housing A+, employment A-; Watch: health & safety C-, crime D+, amenities F.
- New Home ISD (rural): math 71% / reading 70% proficiency, ranked #16 of 826 in TX (top 2%) — strong family-tenant draw, lease renewals of 3-5y typical.
- Market conditions: 34 active listings in the ZIP.
Forward outlook
- In year one you build about $12k of equity ($2k loan paydown + $10k appreciation (3.2% local appreciation)).
- Lynn County population projected at -18% by 2050 — secular population decline; favor cash flow + early exit over multi-decade hold.
- At projected returns (3.2% appreciation + 3.0% rent growth), your $87k cash investment doubles in ~5 years — after that, you're playing with house money.
- By year 4, paydown + projected appreciation supports a ~$41k cash-out refi (75% LTV) — recoverable capital for the next deal without selling this one.
Negotiation context
- Only 6 days on market — expect competitive offers; lowballing is unlikely to land.
Questions for the listing agent
- Is there a deadline driving the sale (1031 exchange, divorce, estate, relocation)? That informs how much negotiation room exists.
- Schools are B-rated — typically a magnet for longer-tenancy family renters. What's the average tenant stay here, and is there a school-zone premium baked into asking?
- Crime grade is D in this area — have there been break-ins, vandalism, or insurance claims at this property in the last 3 years? What carrier currently insures it and at what premium?
- What's the average days-on-market for RENTAL listings here right now (not sales)? A rising rental-DOM trend means longer vacancies and softer asking-rent achievability than the comps imply.
- What's the recent tenant-quality profile in this submarket — average credit score on applications, eviction rate, late-payment / NSF rate, and stable-employment percentage? A property-management company in the area should have these aggregated.
- How much new for-sale + rental construction is in the pipeline within 1–3 miles? Heavy new supply typically softens prices + rents 12–24 months out; constrained supply supports both.
Investment metrics
- 1% rule
- 0.96% ✗
- Cap rate
- 7.32%
- Cash-on-cash
- 3.67%
- DSCR
- 1.16
- GRM
- 8.7
CMA / ARV
No comps found within radius.
Projected returns pro-forma
3.17% appreciation · 3.0% rent growth · sell at horizon
- IRR
- 11.4%
- Equity multiple
- 1.66×
- Total profit
- $57,004
- Equity at exit
- $142,328
- IRR
- 13.4%
- Equity multiple
- 3.03×
- Total profit
- $175,914
- Equity at exit
- $221,657
Cash invested: $86,800 (down + closing). Projections, not guarantees.
Landlord ↔ Tenant lean methodology
- Overall (STATE)
- 87 Strongly Landlord-Friendly
- State Texas
- 87 Strongly Landlord-Friendly · R+5
- County
- — inherits STATE
- City
- — inherits STATE
ZIP-level market 79381
- Home prices YoY
- 2.6%
- Active inventory
- 34
- Price-to-rent
- 8.7×
Monthly cashflow live
- Estimated rent
- $2,971 medium interval (Pro) →
- Mortgage (P&I)
- −$1,626
- Tax from tax record
- −$327 /mo · $3,922/yr
- Insurance
- −$129
- HOA
- −$0
- Vacancy / Maint / Mgmt
- −$624
- Net cashflow
- $265
Break-even live
UW: 25.0% down · 7.5% · 30yr · 1.5% tax · 5.0% vac · 8.0% maint · 8.0% mgmt
Financing live
Cash to close
- Down payment
- $77,500
- Closing costs
- $9,300
- Reserves months
- —
- Total cash needed
- —
Loan-product check · same deal, 3 products live
Conventional
25% down · 7.5% · 30yr
- Down + closing
- —
- Monthly P&I
- —
- Monthly cashflow
- —
- DSCR
- —
- Eligible?
- —
Personal DTI + credit; lowest rate.
DSCR
20% down · 8.5% · 30yr
- Down + closing
- —
- Monthly P&I
- —
- Monthly cashflow
- —
- DSCR
- —
- Eligible?
- —
No personal income docs; deal must DSCR.
Hard money
10% down · 12.0% · 12mo
- Down + closing
- —
- Monthly P&I
- —
- Monthly cashflow
- —
- DSCR
- —
- Eligible?
- —
Short-term bridge; refi at stabilization.
Listing history 6 events
-
2026-06-18days on market $310,000 Active 6 DOM
-
2026-06-17days on market $310,000 Active 5 DOM
-
2026-06-16days on market $310,000 Active 4 DOM
-
2026-06-15days on market $310,000 Active 3 DOM
-
2026-06-14remarks 695-char remark
-
2026-06-14$310,000 Active 1 DOM
ⓘ Source: listings_history table (triggers on properties + properties_extension) + one-shot
backfill from property_details.listing_events for pre-trigger history.
Tax reassessment forecast TX · Resets to sale price
- Current annual tax
- $3,922 · $327/mo
- Projected year-2 tax
- $5,673 · $473/mo
- Expected delta
- +$1,751/yr (+$146/mo · 44.6%)
ⓘ Screening estimate from a state-policy table — verify with the county assessor before closing.
Nearby sold comps map
Loading sold comps map…
Walkable amenities ~0.75 mi
Loading nearby amenities…
Taxation est. · year 1
- Rental income
- $35,648
- − Mortgage interest
- −$17,365
- − Property taxes
- −$3,922
- − Insurance
- −$1,550
- − Repairs & maintenance
- −$2,852
- − Management
- −$2,852
- − Depreciation
- −$9,018
- Taxable loss
- −$1,910
- Est. tax savings @ 24.0%
- +$458
- After-tax cash flow
- $3,641/yr
For passive investors: Depreciation is non-cash, so a rental often shows a tax loss while cash-flowing — sheltering income. Rental losses are passive: they offset passive income freely, and up to $25,000/yr can offset ordinary (W-2) income if you actively participate and your MAGI is under $100k (phasing out to $0 by $150k); unused losses carry forward. On sale, claimed depreciation is recaptured at up to 25%, and gains may owe capital-gains tax (a 1031 exchange can defer both). Figures are a year-1 estimate at your 24.0% rate — not tax advice; consult a CPA.
Schools (NCES district)
- District
- New Home ISD
- NCES district ID
- 4832490
- Math proficiency
- 71% ▼ -9.00%
- Reading proficiency
- 70% ▬ 0.00%
- Median HH income
- $57,372
- Composite
- 60.5/100
- National rank
- #845
- State rank
- #16 of 826 in TX
Livability — New Home
- Score
- 70/100
- State rank
- #343
- US rank
- #7488
Category grades
Schools grade is shown separately in the Schools card above.
Census & demographics
- City population
- 47
- Population (ZIP)
- 1,457
Population outlook (Lynn County) Hauer SSP2
- Today (2025)
- 5,360 people
- By 2030
- 5,162 · -3.7%
- By 2040
- 4,811 · -10.2%
- By 2050
- 4,422 · -17.5%
- By 2075
- 3,362 · -37.3%
- By 2100
- 2,177 · -59.4%
Race, ethnicity, and origin ACS 2023
- Neighborhood character
- Majority White (51%)
- Race & ethnicity
- White 51% Hispanic / Latino 48% Two or more races 20%
- Hispanic origin (detail)
- Mexican 40% Cuban 2%
- Common ancestry
- Slovak 2% Iranian 2% Romanian 1%
- Foreign-born
- 3% · Canada
- Languages at home
- 76% English-only · Spanish 22% German/W. Germanic 1%
Political lean MEDSL · Lynn
- 2024 margin
- Solid R (+70.3) · D 14.4% · R 84.7%
- 2008→2024 swing
- -30.3pp toward R · 2008: -40.0pp · 2024: -70.3pp
- All cycles
- 2024: R+70.3 2020: R+62.1 2016: R+57.2 2012: R+49.3 2008: R+40.0
Not yet ingested
- Civics
- —
Market trends
- HPI YoY
- ▲ 3.17%
- Current HPI
- 125.9221
- Rent YoY
- —
- Metro
- —
- State GDP YoY
- ▲ 3.95%
- F500 in state
- 110
Industry mix (Fortune 500 HQ in TX)
| Industry | F500 HQs | Revenue |
|---|---|---|
| Energy | 16 | $1,198B |
|
||
| Technology | 5 | $198B |
|
||
| Engineering / Construction | 4 | $72B |
|
||
| Energy Services | 3 | $60B |
|
||
| Utilities | 3 | $41B |
|
||
| Healthcare | 2 | $330B |
|
||
Price history
1 event — show timeline
- 2026-06-01 Listed $310,000 LARMLS
Property tax history
+422.0%/yrLatest (2025): $3,922 · +3.7% YoY. Source: county tax records.
Cash-flow waterfall
monthlySold comps — $/sqft
last 12 mo · ≤1 miLoading sold comps…