 🏷️ Likely Rental
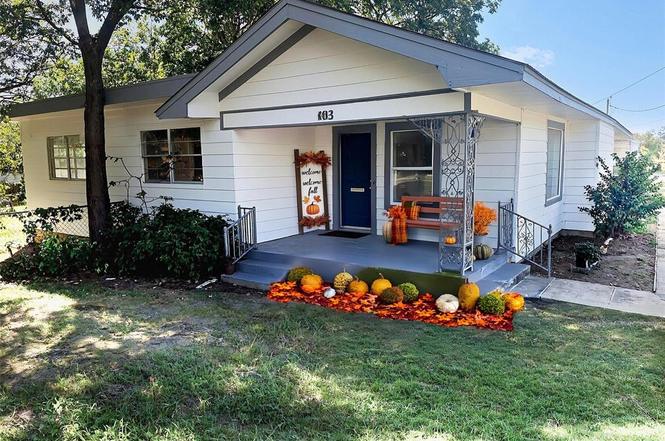
403 SE Carter St · Ardmore, OK
Flood risk 1/10 · Minimal
- FEMA flood zone
- X (unshaded)
- Chance of flooding over 30 yrs
- 0.0%
- Est. flood insurance / yr
- $507 – $1,088
Fire risk 5/10 · Moderate
- Est. fire insurance / yr
- $2,463 – $4,575
Heat risk 6/10 · Moderate
- Hot days now (above 112°F)
- 7 days/yr
- Hot days in 30 yrs
- 20 days/yr
Wind risk 4/10 · Minor
- Chance of severe wind over 30 yrs
- 11.0%
Air-quality risk 3/10 · Minor
- Unhealthy air days now
- 2 days/yr
- Unhealthy air days in 30 yrs
- 3 days/yr
Risk factors via First Street. Map © Google.
Why this score? — see what drove the C+ grade
The composite is a weighted blend of 9 inputs, each scored 0–100. Each bar is that input's sub-score; the figure is the points it added to the 100-point composite (weight × sub-score).
- Cash flow +22.9/30.0
- ARV discount +15.0/15.0
- DSCR +7.3/10.0
- 1% rule +5.2/10.0
- Rent growth +4.3/5.0
- Livability +2.9/5.0
- Condition / age +2.5/5.0
- Schools +1.1/10.0
- Appreciation +0.0/10.0
$138,000
🖨 Deal sheet (PDF) 📄 Offer letter ✓ Due diligence
Listing remarks
Tenant occupied, fully remodeled home featuring 3 bed, 2 bath, 2 living, utility room, and dining area. Situated on a corner lot, this spacious property offers both comfort and convenience. Step inside and be greeted by an abundance of natural light streaming through the numerous large windows. The bright and airy atmosphere creates a welcoming ambiance throughout the home. The large living room provides ample space for relaxation and entertainment, while the adjoining dining room is perfect for family meals and gatherings. The kitchen is a true highlight, having undergone a total remodel. It now boasts stainless steel appliances and plenty of room for culinary adventures. The spacious laun
Key facts
- Large windows
- Natural light
- Large living room
Tags
Property features AI
Finance
- Other: Corner lot approximately 0.27 acres
- Financial info: Loan qualification available; Not assumable
- HOA & community: No mandatory association dues
Exterior
- Parking: 1-car garage
- Home design: Single family residence; One story; East-facing; Residential property
- Construction: Frame construction with vinyl siding; Composition roof; Conventional foundation; Existing property; Below-ground storm shelter
- Exterior features: Covered patio; Covered porch; Chain-link fencing; Corner lot
Interior
- Kitchen: Free-stand electric range; Free-stand electric oven
- Bedrooms: 3 bedrooms
- Flooring: Vinyl flooring
- Bathrooms: 2 full bathrooms
- Heating & cooling: Central gas heating
- Interior features: Dishwasher; Disposal; Microwave; Water heater
Neighborhood map
What this means for you Summary
Snapshot
- This is a 3-bed/2.0-bath single-family listed at $138k.
Deal economics
- At list price, monthly cash flow is $242 ($3k/yr) — positive.
- The deal already cash-flows at list — no discount required.
- Meets the 1% rule at list price ($1k rent vs $138k).
- Recommended offer: $121k (12.0% below list) — sets the bar for market timing.
- Cap rate 8.4% vs local median 4.6% in Ardmore — top-decile yield for the area; either an underpriced asset or a hidden risk that comps aren't pricing in. Stress-test before assuming the spread holds.
Location & tenants
- Location reads 58/100 on livability (#447 in OK) — a working-class tenant base; expect higher turnover. Strengths: cost of living A+, housing A+; Watch: crime F, amenities F, commute F.
- Ardmore (town): math 12% / reading 15% proficiency, ranked #241 of 270 in OK (top 89%) — low school quality limits family demand, transient renter base, plan for 1-2y turnover; 73% free/reduced lunch — lower-income household profile, screen leases tightly.
- Zoned schools: Jefferson Es (math 17% / reading 8%, grade F, #652 of 845 statewide, top 79%, 266 students, 0% FRL); Ardmore Ms (math 7% / reading 12%, grade F, #299 of 345 statewide, top 88%, 498 students, 0% FRL); Ardmore Hs (math 12% / reading 17%, grade F, #348 of 447 statewide, top 79%, 751 students, 0% FRL) — zoned schools average 0% FRL vs 73% district-wide (73 pts lower); this property's tenant base skews higher-income than the district average.
- Market conditions: Rents rising fast (+7.4%/yr); 381 active listings in the ZIP; 73 units permitted in Carter County in 2024 (0 in 5+ unit buildings).
Forward outlook
- Local home prices are declining (-3.0%/yr); year-one equity from $954 of loan paydown is wiped out by about $4k of value loss. Plan a longer hold.
- Carter County population projected at +9% by 2050 — modest demand growth; plan on rents tracking national, not racing it.
- At projected returns (-3.0% appreciation + 7.4% rent growth), your $39k cash investment doubles in ~9 years — after that, you're playing with house money.
Negotiation context
- It's been on market 262 days — a 12% lower offer ($121k) is reasonable based on typical stale-listing flexibility.
- 4 sale attempts since 3y ago with the ask held roughly flat each time — persistent listings suggest the price (not the market) is what's stuck; bring a comps-based counter.
- Current owner paid $50k; list at $138k implies a 176% gain — meaningful room to come down on a strong offer.
Risks & watch-outs
- Watch-outs: built in 1935 — expect roof / HVAC / electrical / plumbing capex.
- Climate carrying-cost: moderate wildfire risk; extreme-heat days projected 7→20/yr by 2055 (HVAC capex compounding) — expect insurance premiums to compound above CPI over the hold.
Questions for the listing agent
- It's been on market 262 days. Have you received any prior offers? Is the seller open to a 12% concession, seller financing, or rate buy-down credit?
- Built in 1935 — when were the roof, HVAC, electrical panel, plumbing, and water heater last replaced?
- Why hasn't it sold? Are there any deal-killer items the seller is aware of (foundation, flood, title, zoning, code violations)?
- Is there a deadline driving the sale (1031 exchange, divorce, estate, relocation)? That informs how much negotiation room exists.
- Schools are F-rated, which usually means shorter tenancies and higher turnover. Who's the typical renter profile here, and what's been the actual vacancy rate?
- Crime grade is F in this area — have there been break-ins, vandalism, or insurance claims at this property in the last 3 years? What carrier currently insures it and at what premium?
- What's the average days-on-market for RENTAL listings here right now (not sales)? A rising rental-DOM trend means longer vacancies and softer asking-rent achievability than the comps imply.
- What's the recent tenant-quality profile in this submarket — average credit score on applications, eviction rate, late-payment / NSF rate, and stable-employment percentage? A property-management company in the area should have these aggregated.
- How much new for-sale + rental construction is in the pipeline within 1–3 miles? Heavy new supply typically softens prices + rents 12–24 months out; constrained supply supports both.
Investment metrics
- 1% rule
- 1.02% ✓
- Cap rate
- 8.39%
- Cash-on-cash
- 7.51%
- DSCR
- 1.33
- GRM
- 8.2
CMA / ARV
- ARV (on-the-fly)
- $213,642
- Comps found
- 4
Show comp detail 4 sales within ~0.75 mi
| Address | Dist | Beds/Ba | Sqft | Sold | Price | $/sf | Match |
|---|---|---|---|---|---|---|---|
| 602 SE 8th | 0.35mi | 3/2.0 | 1,722 (-6%) | 24mo | $175,000 | $102 | 54 |
| 509 G St SW | 0.73mi | 4/2.0 (+1) | 1,911 (+5%) | 2mo | $224,000 | $117 | 52 |
| 225 E St SE | 0.16mi | 2/1.0 (-1) | 1,582 (-13%) | 23mo | $70,000 | $44 | 42 |
| 1138 SE Heath St | 0.73mi | 3/2.0 | 1,560 (-15%) | 14mo | $188,900 | $121 | 30 |
Match score weights: distance 35% · size 25% · config 20% · recency 20%. Top-matched comps best support the ARV.
Projected returns pro-forma
-3.0% appreciation · 7.38% rent growth · sell at horizon
- IRR
- -0.3%
- Equity multiple
- 0.99×
- Total profit
- $-511
- Equity at exit
- $20,576
- IRR
- 13.2%
- Equity multiple
- 2.25×
- Total profit
- $48,404
- Equity at exit
- $11,932
Cash invested: $38,640 (down + closing). Projections, not guarantees.
Landlord ↔ Tenant lean methodology
- Overall (STATE)
- 83 Strongly Landlord-Friendly
- State Oklahoma
- 83 Strongly Landlord-Friendly · R+20
- County
- — inherits STATE
- City
- — inherits STATE
ZIP-level market 73401
- Home prices YoY
- -21.7%
- Rents YoY
- 7.4%
- Active inventory
- 381
- Price-to-rent
- 8.2×
Monthly cashflow live
- Estimated rent
- $1,410 medium interval (Pro) →
- Mortgage (P&I)
- −$724
- Tax from tax record
- −$91 /mo · $1,093/yr
- Insurance
- −$58
- HOA
- −$0
- Vacancy / Maint / Mgmt
- −$296
- Net cashflow
- $242
Break-even live
Sensitivity live
| Price | -10% $320 | -5% $281 | +0% $242 | +5% $203 | +10% $164 |
|---|---|---|---|---|---|
| Rent | -10% $130 | -5% $186 | +0% $242 | +5% $297 | +10% $353 |
| Rate | -1.0pp $311 | -0.5pp $277 | base $242 | +0.5pp $206 | +1.0pp $170 |
UW: 25.0% down · 7.5% · 30yr · 1.5% tax · 5.0% vac · 8.0% maint · 8.0% mgmt
Financing live
Cash to close
- Down payment
- $34,500
- Closing costs
- $4,140
- Reserves months
- —
- Total cash needed
- —
Loan-product check · same deal, 3 products live
Conventional
25% down · 7.5% · 30yr
- Down + closing
- —
- Monthly P&I
- —
- Monthly cashflow
- —
- DSCR
- —
- Eligible?
- —
Personal DTI + credit; lowest rate.
DSCR
20% down · 8.5% · 30yr
- Down + closing
- —
- Monthly P&I
- —
- Monthly cashflow
- —
- DSCR
- —
- Eligible?
- —
No personal income docs; deal must DSCR.
Hard money
10% down · 12.0% · 12mo
- Down + closing
- —
- Monthly P&I
- —
- Monthly cashflow
- —
- DSCR
- —
- Eligible?
- —
Short-term bridge; refi at stabilization.
Listing history 33 events
-
2026-06-21days on market $138,000 Active 262 DOM
-
2026-06-19days on market $138,000 Active 260 DOM
-
2026-06-18days on market $138,000 Active 259 DOM
-
2026-06-17days on market $138,000 Active 258 DOM
-
2026-06-16days on market $138,000 Active 257 DOM
-
2026-06-15days on market $138,000 Active 256 DOM
-
2026-06-14days on market $138,000 Active 254 DOM
-
2026-06-12days on market $138,000 Active 253 DOM
-
2026-06-09days on market $138,000 Active 250 DOM
-
2026-06-08days on market $138,000 Active 249 DOM
-
2026-06-07days on market $138,000 Active 248 DOM
-
2026-06-05days on market $138,000 Active 245 DOM
-
2026-06-03days on market $138,000 Active 244 DOM
-
2026-06-02days on market $138,000 Active 243 DOM
-
2026-06-01days on market $138,000 Active 242 DOM
-
2026-05-31days on market $138,000 Active 241 DOM
-
2026-05-30days on market $138,000 Active 240 DOM
-
2025-10-02$138,000 Active
-
2025-08-23historical
-
2025-07-11price $165,900
-
2025-05-09status Active
-
2025-03-16status Pending
-
2025-02-27price $167,900
-
2025-01-08price $185,000
-
2024-11-22price $198,500
-
2024-10-17price $209,000
-
2024-09-16price $223,900
-
2024-08-24$235,000 Active
-
2023-07-24soldstatus $50,000 Closed
-
2023-07-24soldstatus $50,000
-
2023-07-13status Pending
-
2023-04-27$63,000 Active
-
2006-07-07soldstatus $36,500
ⓘ Source: listings_history table (triggers on properties + properties_extension) + one-shot
backfill from property_details.listing_events for pre-trigger history.
Tax reassessment forecast OK · Resets to sale price
- Current annual tax
- $1,093 · $91/mo
- Projected year-2 tax
- $1,242 · $104/mo
- Expected delta
- +$149/yr (+$12/mo · 13.6%)
ⓘ Screening estimate from a state-policy table — verify with the county assessor before closing.
Climate risk First Street
- Flood 1/10 Low FEMA zone X (unshaded) · 0% chance over 30 yrs
- Wildfire 5/10 Major
- Heat 6/10 Major 7 d/yr ≥112°F today · 20 d/yr by 30 yrs out
- Wind 4/10 Moderate 11% chance of damaging wind over 30 yrs
- Air quality 3/10 Moderate 2 unhealthy d/yr today · 3 by 30 yrs out
Nearby sold comps map
Loading sold comps map…
Walkable amenities ~0.75 mi
Loading nearby amenities…
Taxation est. · year 1
- Rental income
- $16,921
- − Mortgage interest
- −$7,730
- − Property taxes
- −$1,093
- − Insurance
- −$690
- − Repairs & maintenance
- −$1,354
- − Management
- −$1,354
- − Depreciation
- −$4,015
- Taxable income
- $686
- Est. tax owed @ 24.0%
- −$165
- After-tax cash flow
- $2,735/yr
For passive investors: Depreciation is non-cash, so a rental often shows a tax loss while cash-flowing — sheltering income. Rental losses are passive: they offset passive income freely, and up to $25,000/yr can offset ordinary (W-2) income if you actively participate and your MAGI is under $100k (phasing out to $0 by $150k); unused losses carry forward. On sale, claimed depreciation is recaptured at up to 25%, and gains may owe capital-gains tax (a 1031 exchange can defer both). Figures are a year-1 estimate at your 24.0% rate — not tax advice; consult a CPA.
Schools (NCES district)
- District
- Ardmore
- NCES district ID
- 4003180
- Math proficiency
- 12% ▼ -7.00%
- Reading proficiency
- 15% ▼ -6.00%
- Median HH income
- $35,194
- Composite
- 11.1/100
- National rank
- #9733
- State rank
- #241 of 270 in OK
Livability — Ardmore
- Score
- 58/100
- State rank
- #447
- US rank
- #21387
Category grades
Schools grade is shown separately in the Schools card above.
Census & demographics
- Census place
- Ardmore, OK
- County
- Carter County · 36,833 people
- City population
- 36,833
- Metro
- Ardmore, OK
- Population (ZIP)
- 36,833
- Household income
- $61,989
- Rent vs Own
- Severe rent burden
- 1026.0
Population outlook (Carter County) Hauer SSP2
- Today (2025)
- 50,892 people
- By 2030
- 51,913 · +2.0%
- By 2040
- 53,857 · +5.8%
- By 2050
- 55,604 · +9.3%
- By 2075
- 60,670 · +19.2%
- By 2100
- 62,366 · +22.5%
Race, ethnicity, and origin ACS 2023
- Neighborhood character
- Diverse neighborhood (Simpson 0.57)
- Race & ethnicity
- White 65% Two or more races 14% Hispanic / Latino 9% Native American 8% Black 7% Asian 1%
- Hispanic origin (detail)
- Mexican 7%
- Common ancestry
- Slovak 2% Lithuanian 1% Italian 1%
- Foreign-born
- 4% · Canada
- Languages at home
- 92% English-only · Spanish 5%
Political lean MEDSL · Carter
- 2024 margin
- Solid R (+54.7) · D 21.9% · R 76.7% · Other 1.4%
- 2008→2024 swing
- -14.2pp toward R · 2008: -40.5pp · 2024: -54.7pp
- All cycles
- 2024: R+54.7 2020: R+52.5 2016: R+52.6 2012: R+42.7 2008: R+40.5
Not yet ingested
- Civics
- —
Market trends
- HPI YoY
- ▼ -74.93%
- Current HPI
- 269.7381
- Rent YoY
- ▲ 7.38%
- Metro
- Ardmore, OK
- State GDP YoY
- ▲ 1.55%
- F500 in state
- 6
Industry mix (Fortune 500 HQ in OK)
| Industry | F500 HQs | Revenue |
|---|---|---|
| Energy | 3 | $48B |
|
||
Price history
+278.1% since first listed16 events — show timeline
- 2025-10-02 Listed $138,000 MLSOK
- 2025-08-23 Listing Removed — MLSOK
- 2025-07-11 Price Changed $165,900 MLSOK
- 2025-05-09 Relisted — MLSOK
- 2025-03-16 Pending — MLSOK
- 2025-02-27 Price Changed $167,900 MLSOK
- 2025-01-08 Price Changed $185,000 MLSOK
- 2024-11-22 Price Changed $198,500 MLSOK
- 2024-10-17 Price Changed $209,000 MLSOK
- 2024-09-16 Price Changed $223,900 MLSOK
- 2024-08-24 Listed $235,000 MLSOK
- 2023-07-24 Sold (Public Records) $50,000 Public Records
- 2023-07-24 Sold (MLS) $50,000 MLS Technology, Inc.
- 2023-07-13 Pending — MLS Technology, Inc.
- 2023-04-27 Listed $63,000 MLS Technology, Inc.
- 2006-07-07 Sold (Public Records) $36,500 Public Records
Property tax history
+10.1%/yrLatest (2025): $1,093 · +5.0% YoY. Source: county tax records.
Cash-flow waterfall
monthlySold comps — $/sqft
last 12 mo · ≤1 miLoading sold comps…