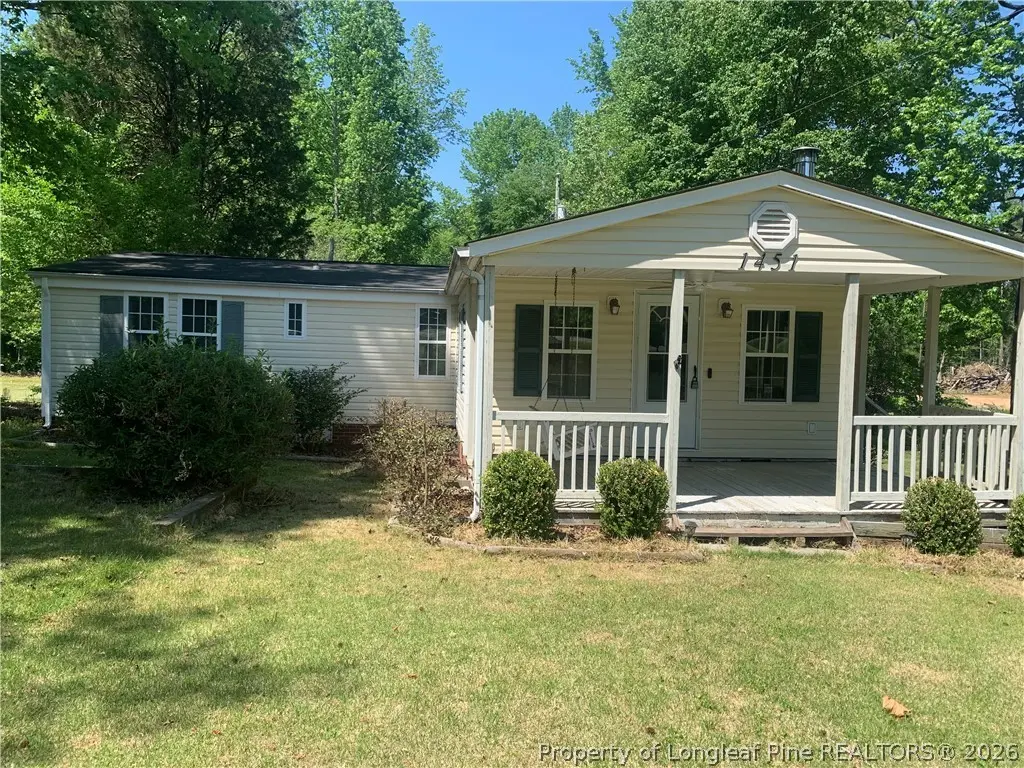
1451 Deep River Rd · Sanford, NC
Flood risk 1/10 · Minimal
- FEMA flood zone
- X (unshaded)
- Chance of flooding over 30 yrs
- 0.0%
- Est. flood insurance / yr
- $507 – $1,088
Fire risk 4/10 · Minor
- Est. fire insurance / yr
- $906 – $1,684
Heat risk 6/10 · Moderate
- Hot days now (above 105°F)
- 7 days/yr
- Hot days in 30 yrs
- 17 days/yr
Wind risk 6/10 · Moderate
- Chance of severe wind over 30 yrs
- 47.0%
Air-quality risk 2/10 · Minimal
- Unhealthy air days now
- 1 days/yr
- Unhealthy air days in 30 yrs
- 1 days/yr
Risk factors via First Street. Map © Google.
Why this score? — see what drove the C+ grade
The composite is a weighted blend of 9 inputs, each scored 0–100. Each bar is that input's sub-score; the figure is the points it added to the 100-point composite (weight × sub-score).
- Cash flow +25.9/30.0
- DSCR +8.7/10.0
- ARV discount +7.5/15.0
- 1% rule +5.8/10.0
- Rent growth +3.7/5.0
- Livability +3.6/5.0
- Schools +3.0/10.0
- Condition / age +2.5/5.0
- Appreciation +0.0/10.0
$170,000
🖨 Deal sheet (PDF) 📄 Offer letter ✓ Due diligence
Listing remarks
Don’t miss this incredible opportunity. This 3BR/2BA home sits on 1.04 acres and delivers 1,140 sq. ft. of smart, efficient living space. The property offers room to spread out, create, and enjoy the outdoors—all in a prime location that keeps you close to shopping, schools, and major routes. A great find for first-time buyers, downsizers, or investors. Home has a transferable A/c warranty. Wired Workshop for hobbies
Key facts
- Wired workshop
- Prime location
- 1.04 acre lot
Tags
Property features AI
Exterior
- Parking: Detached carport; 2 covered parking spaces; 2 carport spaces
- Security: Smoke detectors
- Utilities: Public water; No sewer (sewer not available)
- Home design: Manufactured residential home; Single-story (one level)
- Construction: Brick veneer and vinyl siding exterior
- Exterior features: Front, rear and covered porches with a deck; Fire pit; Storage; Workshop (other structure); Cleared, level yard
Interior
- Kitchen: Gas oven; Free-standing refrigerator
- Bedrooms: Total of 8 rooms (includes bedrooms and living spaces)
- Flooring: Vinyl flooring; Carpet
- Bathrooms: 2 full bathrooms
- Heating & cooling: Heat pump; Central electric air conditioning; Ceiling fans
- Interior features: Ceiling fans; Laminate countertops; Window coverings and blinds; Storm windows; Fireplace in den (wood burning)
- Laundry & utility: Laundry on main level; Tankless gas water heater; Gas water heater
Neighborhood map
What this means for you Summary
Snapshot
- This is a 3-bed/1.5-bath manufactured listed at $170k.
Deal economics
- At list price, monthly cash flow is $420 ($5k/yr) — positive.
- The deal already cash-flows at list — no discount required.
- Meets the 1% rule at list price ($2k rent vs $170k).
- Recommended offer: $165k (3.0% below list) — sets the bar for market timing.
- Cap rate 9.3% vs local median 3.6% in Sanford — top-decile yield for the area; either an underpriced asset or a hidden risk that comps aren't pricing in. Stress-test before assuming the spread holds.
Location & tenants
- Location reads 72/100 on livability (#92 in NC) — a middle-class / working-renter tenant base. Strengths: cost of living A+, housing A+, health & safety A+; Watch: employment D, crime D-, commute F.
- Lee County Schools (rural): math 31% / reading 39% proficiency, ranked #131 of 178 in NC (top 74%) — families likely to look elsewhere, expect single-tenant / working-renter base with shorter leases.
- Zoned schools: Tramway Elementary (math 45% / reading 47%, grade D-, #551 of 1,410 statewide, top 40%, 545 students, 47% FRL); East Lee Middle (math 21% / reading 37%, grade F, #350 of 475 statewide, top 74%, 531 students, 71% FRL); Lee County High (math 39% / reading 44%, grade F, #381 of 535 statewide, top 72%, 1,508 students, 60% FRL) — zoned schools at 59% FRL track the district average.
- Market conditions: Rents rising fast (+4.7%/yr); 528 active listings in the ZIP; 5 comparable units currently listed for rent nearby; rentals at typical pace (median 19d on market — plan ~3-4 weeks tenant-placement turnaround); 602 units permitted in Lee County in 2024 (0 in 5+ unit buildings).
- This rent runs 36% of the median local income ($61k/yr) — at the standard rent-burdened threshold; future hikes will face affordability resistance.
Forward outlook
- Local home prices are declining (-3.0%/yr); year-one equity from $1k of loan paydown is wiped out by about $5k of value loss. Plan a longer hold.
- Lee County population projected at +8% by 2050 — modest demand growth; plan on rents tracking national, not racing it.
- At projected returns (-3.0% appreciation + 4.7% rent growth), your $48k cash investment doubles in ~9 years — after that, you're playing with house money.
Negotiation context
- It's been on market 47 days — a 3% lower offer ($165k) is reasonable based on typical stale-listing flexibility.
- 2 sale attempts; this cycle's ask has dropped $10k (6%) from the opening price — seller is motivated, your offer sets the floor, not the list.
- Current owner paid $50k; list at $170k implies a 240% gain — meaningful room to come down on a strong offer.
Risks & watch-outs
- Climate carrying-cost: major wind risk, 47% chance of damaging wind over 30y; extreme-heat days projected 7→17/yr by 2055 (HVAC capex compounding) — expect insurance premiums to compound above CPI over the hold.
Questions for the listing agent
- It's been on market 47 days. Have you received any prior offers? Is the seller open to a 3% concession, seller financing, or rate buy-down credit?
- Built in 1979 — when were the roof, HVAC, electrical panel, plumbing, and water heater last replaced?
- Is there a deadline driving the sale (1031 exchange, divorce, estate, relocation)? That informs how much negotiation room exists.
- Schools are F-rated, which usually means shorter tenancies and higher turnover. Who's the typical renter profile here, and what's been the actual vacancy rate?
- Crime grade is D in this area — have there been break-ins, vandalism, or insurance claims at this property in the last 3 years? What carrier currently insures it and at what premium?
- What's the average days-on-market for RENTAL listings here right now (not sales)? A rising rental-DOM trend means longer vacancies and softer asking-rent achievability than the comps imply.
- What's the recent tenant-quality profile in this submarket — average credit score on applications, eviction rate, late-payment / NSF rate, and stable-employment percentage? A property-management company in the area should have these aggregated.
- How much new for-sale + rental construction is in the pipeline within 1–3 miles? Heavy new supply typically softens prices + rents 12–24 months out; constrained supply supports both.
Investment metrics
- 1% rule
- 1.08% ✓
- Cap rate
- 9.26%
- Cash-on-cash
- 10.58%
- DSCR
- 1.47
- GRM
- 7.7
CMA / ARV
No comps found within radius.
Projected returns pro-forma
-3.0% appreciation · 4.66% rent growth · sell at horizon
- IRR
- 1.2%
- Equity multiple
- 1.05×
- Total profit
- $2,250
- Equity at exit
- $25,348
- IRR
- 12.3%
- Equity multiple
- 2.04×
- Total profit
- $49,379
- Equity at exit
- $14,698
Cash invested: $47,600 (down + closing). Projections, not guarantees.
Landlord ↔ Tenant lean methodology
- Overall (STATE)
- 85 Strongly Landlord-Friendly
- State North Carolina
- 85 Strongly Landlord-Friendly · R+3
- County
- — inherits STATE
- City
- — inherits STATE
ZIP-level market 27330
- Home prices YoY
- -19.4%
- Rents YoY
- 4.7%
- Active inventory
- 528
- Price-to-rent
- 7.7×
Monthly cashflow live
- Estimated rent
- $1,836 high interval (Pro) →
- Mortgage (P&I)
- −$891
- Tax from tax record
- −$69 /mo · $822/yr
- Insurance
- −$71
- HOA
- −$0
- Vacancy / Maint / Mgmt
- −$386
- Net cashflow
- $420
Break-even live
Sensitivity live
| Price | -10% $516 | -5% $468 | +0% $420 | +5% $372 | +10% $324 |
|---|---|---|---|---|---|
| Rent | -10% $275 | -5% $347 | +0% $420 | +5% $492 | +10% $565 |
| Rate | -1.0pp $505 | -0.5pp $463 | base $420 | +0.5pp $376 | +1.0pp $331 |
UW: 25.0% down · 7.5% · 30yr · 1.5% tax · 5.0% vac · 8.0% maint · 8.0% mgmt
Financing live
Cash to close
- Down payment
- $42,500
- Closing costs
- $5,100
- Reserves months
- —
- Total cash needed
- —
Loan-product check · same deal, 3 products live
Conventional
25% down · 7.5% · 30yr
- Down + closing
- —
- Monthly P&I
- —
- Monthly cashflow
- —
- DSCR
- —
- Eligible?
- —
Personal DTI + credit; lowest rate.
DSCR
20% down · 8.5% · 30yr
- Down + closing
- —
- Monthly P&I
- —
- Monthly cashflow
- —
- DSCR
- —
- Eligible?
- —
No personal income docs; deal must DSCR.
Hard money
10% down · 12.0% · 12mo
- Down + closing
- —
- Monthly P&I
- —
- Monthly cashflow
- —
- DSCR
- —
- Eligible?
- —
Short-term bridge; refi at stabilization.
Rent comps 5 comps
| Address | Beds | Baths | Sqft | Rent | $/sqft | DOM | Units | Dist |
|---|---|---|---|---|---|---|---|---|
| 221 Starlight St Buffalo Lake, NC | 3.0 | 2.5 | 1429 | $1,790 | $1.25 | 25d | 1 | 0.88mi |
| 112 Starlight St Unit 1 Sanford, NC | 3.0 | 2.5 | 1482 | $1,695 | $1.14 | 9d | 1 | 0.88mi |
| 111 Starlight St Sanford, NC | 3.0 | 2.5 | 1416 | $1,695 | $1.20 | 19d | 1 | 0.90mi |
| 455 David Hill Dr Unit 1 Buffalo Lake, NC | 3.0 | 2.5 | 1450 | $1,795 | $1.24 | 18d | 1 | 0.98mi |
| 455 David Hill Dr Sanford, NC | 3.0 | 3.0 | 1450 | $1,795 | $1.24 | 14d | 1 | 0.99mi |
Listing history 21 events
-
2026-06-17status $170,000 Pending 47 DOM
-
2026-06-16days on market $170,000 Active 47 DOM
-
2026-06-15days on market $170,000 Active 46 DOM
-
2026-06-14days on market $170,000 Active 44 DOM
-
2026-06-13days on market $170,000 Active 43 DOM
-
2026-06-10days on market $170,000 Active 41 DOM
-
2026-06-09days on market $170,000 Active 40 DOM
-
2026-06-08days on market $170,000 Active 39 DOM
-
2026-06-07days on market $170,000 Active 38 DOM
-
2026-06-05days on market $170,000 Active 35 DOM
-
2026-06-03days on market $170,000 Active 34 DOM
-
2026-06-02days on market $170,000 Active 33 DOM
-
2026-06-01days on market $170,000 Active 32 DOM
-
2026-05-31days on market $170,000 Active 31 DOM
-
2026-05-30days on market $170,000 Active 30 DOM
-
2026-05-20price $170,000
-
2026-05-05status Active
-
2026-04-21status Pending
-
2026-04-14$180,000 Active
-
2019-05-10soldstatus $50,000
-
1995-12-18soldstatus $11,500
ⓘ Source: listings_history table (triggers on properties + properties_extension) + one-shot
backfill from property_details.listing_events for pre-trigger history.
Tax reassessment forecast NC · Resets to sale price
- Current annual tax
- $822 · $69/mo
- Projected year-2 tax
- $1,394 · $116/mo
- Expected delta
- +$572/yr (+$48/mo · 69.5%)
ⓘ Screening estimate from a state-policy table — verify with the county assessor before closing.
Climate risk First Street
- Flood 1/10 Low FEMA zone X (unshaded) · 0% chance over 30 yrs
- Wildfire 4/10 Moderate
- Heat 6/10 Major 7 d/yr ≥105°F today · 17 d/yr by 30 yrs out
- Wind 6/10 Major 47% chance of damaging wind over 30 yrs
- Air quality 2/10 Low 1 unhealthy d/yr today · 1 by 30 yrs out
Nearby sold comps map
Loading sold comps map…
Walkable amenities ~0.75 mi
Loading nearby amenities…
Taxation est. · year 1
- Rental income
- $22,036
- − Mortgage interest
- −$9,523
- − Property taxes
- −$822
- − Insurance
- −$850
- − Repairs & maintenance
- −$1,763
- − Management
- −$1,763
- − Depreciation
- −$4,945
- Taxable income
- $2,370
- Est. tax owed @ 24.0%
- −$569
- After-tax cash flow
- $4,469/yr
For passive investors: Depreciation is non-cash, so a rental often shows a tax loss while cash-flowing — sheltering income. Rental losses are passive: they offset passive income freely, and up to $25,000/yr can offset ordinary (W-2) income if you actively participate and your MAGI is under $100k (phasing out to $0 by $150k); unused losses carry forward. On sale, claimed depreciation is recaptured at up to 25%, and gains may owe capital-gains tax (a 1031 exchange can defer both). Figures are a year-1 estimate at your 24.0% rate — not tax advice; consult a CPA.
Schools (NCES district)
- District
- Lee County Schools
- NCES district ID
- 3702560
- Math proficiency
- 31% ▼ -6.00%
- Reading proficiency
- 39% ▬ 0.00%
- Median HH income
- $45,300
- Composite
- 29.87/100
- National rank
- #6403
- State rank
- #131 of 178 in NC
Livability — Sanford
- Score
- 72/100
- State rank
- #92
- US rank
- #6134
Category grades
Schools grade is shown separately in the Schools card above.
Census & demographics
- County
- Lee County · 76,725 people
- City population
- 76,725
- Metro
- Sanford, NC
- Population (ZIP)
- 39,778
- Household income
- $61,300
- Rent vs Own
- Severe rent burden
- 928.0
Population outlook (Lee County) Hauer SSP2
- Today (2025)
- 63,008 people
- By 2030
- 64,443 · +2.3%
- By 2040
- 66,898 · +6.2%
- By 2050
- 68,310 · +8.4%
- By 2075
- 70,920 · +12.6%
- By 2100
- 70,402 · +11.7%
Race, ethnicity, and origin ACS 2023
- Neighborhood character
- Diverse neighborhood (Simpson 0.63)
- Race & ethnicity
- White 54% Hispanic / Latino 21% Black 19% Two or more races 10% Asian 1%
- Hispanic origin (detail)
- Mexican 12% Puerto Rican 2%
- Common ancestry
- Slovak 4% Serbian 2% Italian 1%
- Foreign-born
- 10% · Canada
- Languages at home
- 81% English-only · Spanish 17%
Political lean MEDSL · Lee
- 2024 margin
- R (+17.5) · D 40.8% · R 58.3%
- 2008→2024 swing
- -9.1pp toward R · 2008: -8.4pp · 2024: -17.5pp
- All cycles
- 2024: R+17.5 2020: R+14.9 2016: R+13.2 2012: R+10.2 2008: R+8.4
Not yet ingested
- Civics
- —
Market trends
- HPI YoY
- ▼ -72.62%
- Current HPI
- 302.3589
- Rent YoY
- ▲ 4.66%
- Metro
- Sanford, NC
- State GDP YoY
- ▲ 3.28%
- F500 in state
- 26
Industry mix (Fortune 500 HQ in NC)
| Industry | F500 HQs | Revenue |
|---|---|---|
| Financial Services | 2 | $213B |
|
||
| Retail | 2 | $95B |
|
||
| Industrial Conglomerate | 1 | $38B |
|
||
| Metals / Steel | 1 | $35B |
|
||
| Utilities | 1 | $30B |
|
||
| Industrial Machinery | 1 | $19B |
|
||
Price history
+1378.3% since first listed6 events — show timeline
- 2026-05-20 Price Changed $170,000 LPRMLS
- 2026-05-05 Relisted — LPRMLS
- 2026-04-21 Pending — LPRMLS
- 2026-04-14 Listed $180,000 LPRMLS
- 2019-05-10 Sold (Public Records) $50,000 Public Records
- 1995-12-18 Sold (Public Records) $11,500 Public Records
Property tax history
+5.1%/yrLatest (2025): $822 · +1.2% YoY. Source: county tax records.
Cash-flow waterfall
monthlySold comps — $/sqft
last 12 mo · ≤1 miLoading sold comps…