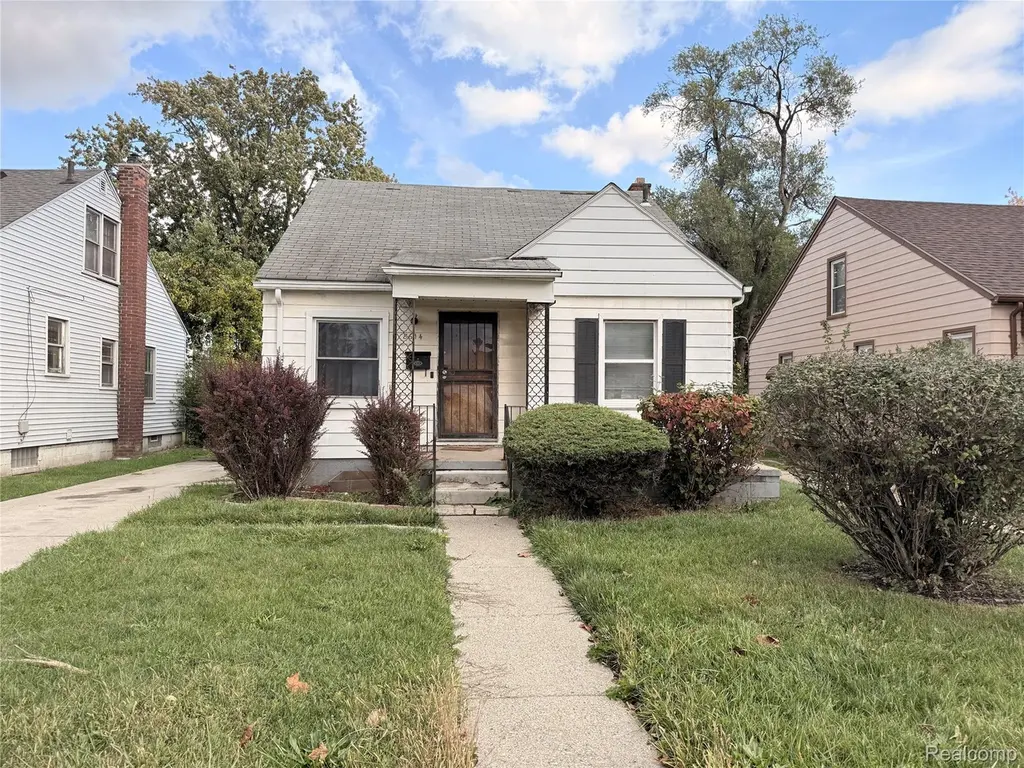
8614 Hubbell St · Detroit, MI
Flood risk 6/10 · Moderate
- FEMA flood zone
- X (unshaded)
- Chance of flooding over 30 yrs
- 0.72%
- Est. flood insurance / yr
- $473 – $860
Fire risk 1/10 · Minimal
- Est. fire insurance / yr
- $784 – $1,456
Heat risk 3/10 · Minor
- Hot days now (above 97°F)
- 7 days/yr
- Hot days in 30 yrs
- 15 days/yr
Wind risk 2/10 · Minimal
- Chance of severe wind over 30 yrs
- —
Air-quality risk 3/10 · Minor
- Unhealthy air days now
- 2 days/yr
- Unhealthy air days in 30 yrs
- 5 days/yr
Risk factors via First Street. Map © Google.
Why this score? — see what drove the C+ grade
The composite is a weighted blend of 9 inputs, each scored 0–100. Each bar is that input's sub-score; the figure is the points it added to the 100-point composite (weight × sub-score).
- Cash flow +30.0/30.0
- 1% rule +10.0/10.0
- DSCR +10.0/10.0
- ARV discount +5.6/15.0
- Livability +3.7/5.0
- Condition / age +2.5/5.0
- Rent growth +1.9/5.0
- Schools +1.3/10.0
- Appreciation +0.0/10.0
$62,000
🖨 Deal sheet 📄 Offer letter ✓ Due diligence
Listing remarks MLS
Great opportunity for investors or buyers looking to build equity on Detroit's west side. Property is being sold as is and offers strong potential. Cash preferred. Seller may consider conventional financing if buyer installs a functional furnace and hot water tank prior to closing. Buyer to verify all information and measurements. Schedule your showing today.
Key facts
- 4,792 sq ft lot
- Built 1943
- Listed 107 days
Neighborhood map
What this means for you Summary
Snapshot
- This is a 3-bed/1.0-bath single-family listed at $62k.
Deal economics
- At list price, monthly cash flow is $586 ($7k/yr) — positive.
- The deal already cash-flows at list — no discount required.
- Meets the 1% rule at list price ($1k rent vs $62k).
- Recommended offer: $56k (9.0% below list) — sets the bar for market timing.
- Cap rate 17.6% vs local median 10.2% in Detroit — top-decile yield for the area; either an underpriced asset or a hidden risk that comps aren't pricing in. Stress-test before assuming the spread holds.
Location & tenants
- Location reads 73/100 on livability (#218 in MI) — a middle-class / working-renter tenant base. Strengths: amenities A+, commute A+, cost of living A+; Watch: schools F, crime F, employment F.
- Detroit Public Schools Community District (urban): math 10% / reading 24% proficiency, ranked #499 of 540 in MI (top 92%) — low school quality limits family demand, transient renter base, plan for 1-2y turnover; 90% free/reduced lunch — lower-income household profile, screen leases tightly.
- Market conditions: Rents soft (-2.3%/yr); 363 active listings in the ZIP; 40 comparable units currently listed for rent nearby; rentals lingering (median 44d on market — plan ~5-8 weeks vacancy on turnover, expect pricing pressure); 60% of comp listings sitting > 30 days — soft ceiling on asking rent; lower-income renter base — watch delinquency; 2,639 units permitted in Wayne County in 2024 (1,216 in 5+ unit buildings).
- At $1,290/mo this rent would consume 50% of the median local household income ($31k/yr) (locally 4144% of renters already pay >50% of income on rent) — very limited rent-growth headroom before tenants either downsize or default.
Forward outlook
- Local home prices are declining (-3.0%/yr); year-one equity from $429 of loan paydown is wiped out by about $2k of value loss. Plan a longer hold.
- Wayne County population projected at -17% by 2050 — secular population decline; favor cash flow + early exit over multi-decade hold.
- At projected returns (-3.0% appreciation + 0.0% rent growth), your $17k cash investment doubles in ~4 years — after that, you're playing with house money.
Negotiation context
- It's been on market 107 days — a 9% lower offer ($56k) is reasonable based on typical stale-listing flexibility.
- 7 sale attempts since 7y ago; this cycle's ask has dropped $8k (11%) from the opening price — seller is motivated, your offer sets the floor, not the list.
Risks & watch-outs
- Watch-outs: built in 1943 — expect roof / HVAC / electrical / plumbing capex.
- Climate carrying-cost: major flood risk — expect insurance premiums to compound above CPI over the hold.
Questions for the listing agent
- It's been on market 107 days. Have you received any prior offers? Is the seller open to a 9% concession, seller financing, or rate buy-down credit?
- Built in 1943 — when were the roof, HVAC, electrical panel, plumbing, and water heater last replaced?
- Why hasn't it sold? Are there any deal-killer items the seller is aware of (foundation, flood, title, zoning, code violations)?
- Is there a deadline driving the sale (1031 exchange, divorce, estate, relocation)? That informs how much negotiation room exists.
- Schools are F-rated, which usually means shorter tenancies and higher turnover. Who's the typical renter profile here, and what's been the actual vacancy rate?
- Crime grade is F in this area — have there been break-ins, vandalism, or insurance claims at this property in the last 3 years? What carrier currently insures it and at what premium?
- What's the average days-on-market for RENTAL listings here right now (not sales)? A rising rental-DOM trend means longer vacancies and softer asking-rent achievability than the comps imply.
- What's the recent tenant-quality profile in this submarket — average credit score on applications, eviction rate, late-payment / NSF rate, and stable-employment percentage? A property-management company in the area should have these aggregated.
- How much new for-sale + rental construction is in the pipeline within 1–3 miles? Heavy new supply typically softens prices + rents 12–24 months out; constrained supply supports both.
Investment metrics
- 1% rule
- 2.08% ✓
- Cap rate
- 17.64%
- Cash-on-cash
- 40.52%
- DSCR
- 2.80
- GRM
- 4.0
CMA / ARV
- ARV (median comp)
- $59,435
- List price
- $62,000
- Delta
- 4.32%
- Verdict
- FAIR
- Comps
- 20 within 1.0 mi
Show comp detail 12 sales within ~0.75 mi
| Address | Dist | Beds/Ba | Sqft | Sold | Price | $/sf | Match |
|---|---|---|---|---|---|---|---|
| 8254 Sussex St | 0.40mi | 3/1.0 | 1,006 (-1%) | 3mo | $108,000 | $107 | 78 |
| 8871 Sussex St | 0.38mi | 3/1.0 | 1,049 (+4%) | 1mo | $118,000 | $112 | 75 |
| 8348 Terry St | 0.22mi | 3/1.0 | 932 (-8%) | 4mo | $82,500 | $89 | 73 |
| 8277 Sussex St | 0.41mi | 3/1.0 | 1,038 (+3%) | 4mo | $120,000 | $116 | 73 |
| 8160 Sussex St | 0.45mi | 3/1.0 | 960 (-5%) | 1mo | $58,000 | $60 | 70 |
| 8255 Marlowe St | 0.24mi | 3/1.0 | 915 (-10%) | 4mo | $27,400 | $30 | 70 |
| 8121 Hubbell ST St | 0.33mi | 3/1.0 | 918 (-9%) | 2mo | $48,500 | $53 | 67 |
| 9316 Whitcomb St | 0.57mi | 3/1.5 | 1,029 (+2%) | 4mo | $100,000 | $97 | 65 |
| 8125 Hubbell St | 0.32mi | 3/1.0 | 864 (-15%) | 4mo | $52,500 | $61 | 57 |
| 8154 Decatur St | 0.48mi | 3/1.0 | 864 (-15%) | 1mo | $70,000 | $81 | 53 |
| 9606 Sussex St | 0.74mi | 3/2.0 | 1,060 (+5%) | 4mo | $76,000 | $72 | 51 |
| 7733 Barrie St | 0.71mi | 2/1.0 (-1) | 909 (-10%) | 4mo | $140,000 | $154 | 42 |
Match score weights: distance 35% · size 25% · config 20% · recency 20%. Top-matched comps best support the ARV.
Projected returns pro-forma
-3.0% appreciation · 0.0% rent growth · sell at horizon
- IRR
- 33.5%
- Equity multiple
- 2.36×
- Total profit
- $23,530
- Equity at exit
- $9,244
- IRR
- 38.8%
- Equity multiple
- 4.11×
- Total profit
- $54,047
- Equity at exit
- $5,361
Cash invested: $17,360 (down + closing). Projections, not guarantees.
Landlord ↔ Tenant lean methodology
- Overall (STATE)
- 62 Landlord-Friendly
- State Michigan
- 62 Landlord-Friendly · EVEN
- County
- — inherits STATE
- City
- — inherits STATE
ZIP-level market 48228
- Rents YoY
- -2.3%
- Active inventory
- 363
- Price-to-rent
- 4.0×
Monthly cashflow live
- Estimated rent
- $1,290 high interval (Pro) →
- Mortgage (P&I)
- −$325
- Tax from tax record
- −$82 /mo · $979/yr
- Insurance
- −$26
- HOA
- −$0
- Vacancy / Maint / Mgmt
- −$271
- Net cashflow
- $586
Break-even live
UW: 25.0% down · 7.5% · 30yr · 1.5% tax · 5.0% vac · 8.0% maint · 8.0% mgmt
Financing live
Cash to close
- Down payment
- $15,500
- Closing costs
- $1,860
- Reserves months
- —
- Total cash needed
- —
Loan-product check · same deal, 3 products live
Conventional
25% down · 7.5% · 30yr
- Down + closing
- —
- Monthly P&I
- —
- Monthly cashflow
- —
- DSCR
- —
- Eligible?
- —
Personal DTI + credit; lowest rate.
DSCR
20% down · 8.5% · 30yr
- Down + closing
- —
- Monthly P&I
- —
- Monthly cashflow
- —
- DSCR
- —
- Eligible?
- —
No personal income docs; deal must DSCR.
Hard money
10% down · 12.0% · 12mo
- Down + closing
- —
- Monthly P&I
- —
- Monthly cashflow
- —
- DSCR
- —
- Eligible?
- —
Short-term bridge; refi at stabilization.
Rent comps 40 comps
| Address | Beds | Baths | Sqft | Rent | $/sqft | DOM | Units | Dist |
|---|---|---|---|---|---|---|---|---|
| 8212 Lauder St Detroit, MI | 3.0 | 1.0 | 1026 | $1,150 | $1.12 | 43d | 1 | 0.31mi |
| 8114 Marlowe St Unit home Detroit, MI | 3.0 | 1.0 | 985 | $1,350 | $1.37 | 43d | 1 | 0.37mi |
| 8604 Whitcomb St Detroit, MI | 3.0 | 2.0 | 1033 | $1,300 | $1.26 | 43d | 1 | 0.39mi |
| 8331 Whitcomb St Detroit, MI | 4.0 | 1.0 | 1342 | $1,350 | $1.01 | 21d | 1 | 0.45mi |
| 8047 Robson St Detroit, MI | 3.0 | 2.0 | 1184 | $1,200 | $1.01 | 43d | 1 | 0.49mi |
| 9386 Coyle St Detroit, MI | 3.0 | 1.0 | 1000 | $1,300 | $1.30 | 1d | 1 | 0.54mi |
| 14740 W Chicago Unit B Detroit, MI | 2.0 | 1.0 | 900 | $845 | $0.94 | 43d | 1 | 0.54mi |
| 9501 Lauder St Detroit, MI | 3.0 | 2.0 | 1152 | $1,350 | $1.17 | 43d | 1 | 0.55mi |
| 9590 Marlowe St Detroit, MI | 2.0 | 1.0 | 877 | $1,430 | $1.63 | 43d | 1 | 0.62mi |
| 9546 Sussex St Detroit, MI | 3.0 | 1.0 | 1000 | $1,400 | $1.40 | 43d | 1 | 0.67mi |
| 9340 Hartwell St Detroit, MI | 3.0 | 1.0 | 1000 | $1,364 | $1.36 | 43d | 1 | 0.70mi |
| 9222 Forrer St Detroit, MI | 3.0 | 1.0 | 947 | $1,450 | $1.53 | 16d | 1 | 0.76mi |
| 9917 Sussex St Detroit, MI | 2.0 | 1.0 | 800 | $1,375 | $1.72 | 43d | 1 | 0.80mi |
| 9355 Ward St Detroit, MI | 3.0 | 1.0 | 1200 | $1,327 | $1.11 | 43d | 1 | 0.85mi |
| 10015 Robson St Detroit, MI | 3.0 | 2.0 | 1000 | $1,400 | $1.40 | 17d | 1 | 0.85mi |
| 13717 Keal St Detroit, MI | 2.0 | 1.0 | 799 | $1,000 | $1.25 | 43d | 1 | 0.90mi |
| 9220 Mansfield St Detroit, MI | 3.0 | 1.0 | 1200 | $1,300 | $1.08 | 43d | 1 | 0.91mi |
| 9345 Rutherford St Unit 3 Detroit, MI | 2.0 | 1.0 | 850 | $1,050 | $1.24 | 24d | 1 | 0.92mi |
| 9936 Montrose St Detroit, MI | 3.0 | 1.0 | 963 | $1,200 | $1.25 | 16d | 1 | 0.96mi |
| 9973 Winthrop St Detroit, MI | 3.0 | 1.0 | 960 | $1,400 | $1.46 | 43d | 1 | 0.97mi |
| 11431 Marlowe St Detroit, MI | 3.0 | 1.0 | 1172 | $1,400 | $1.19 | 16d | 1 | 0.99mi |
| 9589 Mansfield St Detroit, MI | 4.0 | 1.0 | 1250 | $1,500 | $1.20 | 4d | 1 | 1.04mi |
| 11397 Whitcomb St Detroit, MI | 3.0 | 1.0 | 1070 | $1,400 | $1.31 | 16d | 1 | 1.04mi |
| 11345 Greenfield Rd Detroit, MI | 2.0 | 1.0 | 700 | $1,050 | $1.50 | 12d | 1 | 1.05mi |
| 11393 Prest St Detroit, MI | 3.0 | 1.0 | 900 | $1,550 | $1.72 | 16d | 1 | 1.06mi |
| 7419 Rutherford St Detroit, MI | 2.0 | 1.0 | 981 | $1,150 | $1.17 | 14d | 1 | 1.11mi |
| 11634 Sussex St Detroit, MI | 3.0 | 1.0 | 1091 | $1,326 | $1.22 | 24d | 1 | 1.11mi |
| 8283 Pinehurst St Unit 2 Detroit, MI | 2.0 | 1.0 | 1000 | $900 | $0.90 | 43d | 1 | 1.12mi |
| 9558 Meyers Rd Detroit, MI | 3.0 | 1.0 | 950 | $1,150 | $1.21 | 43d | 1 | 1.17mi |
| 7312 Mansfield St Detroit, MI | 4.0 | 1.0 | 1300 | $1,400 | $1.08 | 16d | 1 | 1.17mi |
| 12014 Terry St Detroit, MI | 2.0 | 1.0 | 1361 | $1,200 | $0.88 | 43d | 1 | 1.20mi |
| 12039 Lauder St Detroit, MI | 3.0 | 1.5 | 1000 | $1,500 | $1.50 | 24d | 1 | 1.22mi |
| 10002 Manor Unit 1 Detroit, MI | 2.0 | 1.0 | 1000 | $1,050 | $1.05 | 43d | 1 | 1.35mi |
| 10002 Manor Unit 2 Detroit, MI | 3.0 | 1.0 | 1100 | $1,150 | $1.05 | 43d | 1 | 1.35mi |
| 11641 Mansfield St Unit 2 Detroit, MI | 3.0 | 1.0 | 1449 | $1,300 | $0.90 | 43d | 1 | 1.36mi |
| 12775 Plymouth Rd Unit 16 Detroit, MI | 2.0 | 1.0 | 1009 | $825 | $0.82 | 43d | 1 | 1.39mi |
| 10359 Violetlawn St Unit 1 Detroit, MI | 2.0 | 1.0 | 1200 | $985 | $0.82 | 43d | 1 | 1.39mi |
| 10303 Morley St #1 Detroit, MI | 2.0 | 1.0 | 950 | $950 | $1.00 | 43d | 1 | 1.42mi |
| 10345 Crocuslawn Ave Unit 2 Detroit, MI | 2.0 | 1.0 | 850 | $950 | $1.12 | 43d | 1 | 1.43mi |
| 10030 Abington Ave Detroit, MI | 4.0 | 2.0 | 1350 | $1,475 | $1.09 | 10d | 1 | 1.44mi |
Listing history 35 events
-
2026-06-18days on market $62,000 Active 107 DOM
-
2026-06-17days on market $62,000 Active 106 DOM
-
2026-06-15days on market $62,000 Active 104 DOM
-
2026-06-13days on market $62,000 Active 102 DOM
-
2026-06-13days on market $62,000 Active 101 DOM
-
2026-06-09days on market $62,000 Active 98 DOM
-
2026-06-08days on market $62,000 Active 97 DOM
-
2026-06-07pricedays on market $62,000 Active 96 DOM
-
2026-06-04days on market $65,000 Active 93 DOM
-
2026-06-03days on market $65,000 Active 92 DOM
-
2026-06-01days on market $65,000 Active 90 DOM
-
2026-05-31days on market $65,000 Active 89 DOM
-
2026-04-05price $65,000 361-char remark
Show marketing remark (367 chars)
Great opportunity for investors or buyers looking to build equity on Detroit’s west side. Property is being sold as is and offers strong potential. Cash preferred. Seller may consider conventional financing if buyer installs a functional furnace and hot water tank prior to closing. Buyer to verify all information and measurements. Schedule your showing today.
-
2026-04-05price $65,000 367-char remark
Show marketing remark (367 chars)
Great opportunity for investors or buyers looking to build equity on Detroit’s west side. Property is being sold as is and offers strong potential. Cash preferred. Seller may consider conventional financing if buyer installs a functional furnace and hot water tank prior to closing. Buyer to verify all information and measurements. Schedule your showing today.
-
2026-03-03$69,900 Active 361-char remark
Show marketing remark (367 chars)
Great opportunity for investors or buyers looking to build equity on Detroit’s west side. Property is being sold as is and offers strong potential. Cash preferred. Seller may consider conventional financing if buyer installs a functional furnace and hot water tank prior to closing. Buyer to verify all information and measurements. Schedule your showing today.
-
2026-03-03$69,900 Active 367-char remark
Show marketing remark (367 chars)
Great opportunity for investors or buyers looking to build equity on Detroit’s west side. Property is being sold as is and offers strong potential. Cash preferred. Seller may consider conventional financing if buyer installs a functional furnace and hot water tank prior to closing. Buyer to verify all information and measurements. Schedule your showing today.
-
2021-03-30soldstatus $65,550
-
2020-09-21soldstatus $30,000 Sold
-
2020-09-21soldstatus $30,000 Closed
-
2020-09-04status Pending
-
2020-09-01historical
-
2020-07-30status Pending
-
2020-07-30status Pending
-
2020-07-10status Active
-
2020-07-08historical
-
2020-05-08status Active
-
2020-05-05historical
-
2020-03-04price $35,000
-
2020-03-03price $35,000
-
2020-01-25price $45,000
-
2020-01-24price $45,000
-
2020-01-10status Active
-
2020-01-07historical
-
2019-12-15$50,000 Active
-
2019-12-15$50,000 Active
ⓘ Source: listings_history table (triggers on properties + properties_extension) + one-shot
backfill from property_details.listing_events for pre-trigger history.
Tax reassessment forecast MI · Partial reset (capped growth)
- Current annual tax
- $979 · $82/mo
- Projected year-2 tax
- $979 · $82/mo
- Expected delta
- $0/yr ($0/mo · 0.0%)
ⓘ Screening estimate from a state-policy table — verify with the county assessor before closing.
Climate risk First Street
- Flood 6/10 Major FEMA zone X (unshaded) · 72% chance over 30 yrs
- Wildfire 1/10 Low
- Heat 3/10 Moderate 7 d/yr ≥97°F today · 15 d/yr by 30 yrs out
- Wind 2/10 Low
- Air quality 3/10 Moderate 2 unhealthy d/yr today · 5 by 30 yrs out
Nearby sold comps map
Loading sold comps map…
Walkable amenities ~0.75 mi
Loading nearby amenities…
Taxation est. · year 1
- Rental income
- $15,474
- − Mortgage interest
- −$3,473
- − Property taxes
- −$979
- − Insurance
- −$310
- − Repairs & maintenance
- −$1,238
- − Management
- −$1,238
- − Depreciation
- −$1,804
- Taxable income
- $6,433
- Est. tax owed @ 24.0%
- −$1,544
- After-tax cash flow
- $5,490/yr
For passive investors: Depreciation is non-cash, so a rental often shows a tax loss while cash-flowing — sheltering income. Rental losses are passive: they offset passive income freely, and up to $25,000/yr can offset ordinary (W-2) income if you actively participate and your MAGI is under $100k (phasing out to $0 by $150k); unused losses carry forward. On sale, claimed depreciation is recaptured at up to 25%, and gains may owe capital-gains tax (a 1031 exchange can defer both). Figures are a year-1 estimate at your 24.0% rate — not tax advice; consult a CPA.
Schools (NCES district)
- District
- Detroit Public Schools Community District
- NCES district ID
- 2601103
- Math proficiency
- 10% ▼ -2.00%
- Reading proficiency
- 24% ▲ 6.00%
- Median HH income
- $25,815
- Composite
- 13.06/100
- National rank
- #9564
- State rank
- #499 of 540 in MI
Livability — Detroit
- Score
- 73/100
- State rank
- #218
- US rank
- #5427
Category grades
Schools grade is shown separately in the Schools card above.
Census & demographics
- Census place
- Detroit, MI
- County
- Wayne County · 1,562,939 people
- City population
- 572,865
- Metro
- Detroit-Warren-Dearborn, MI
- Population (ZIP)
- 50,117
- Household income
- $30,680
- Rent vs Own
- Severe rent burden
- 4144.0
Population outlook (Wayne County) Hauer SSP2
- Today (2025)
- 1,675,273 people
- By 2030
- 1,620,300 · -3.3%
- By 2040
- 1,502,341 · -10.3%
- By 2050
- 1,384,039 · -17.4%
- By 2075
- 1,124,592 · -32.9%
- By 2100
- 881,193 · -47.4%
Race, ethnicity, and origin ACS 2023
- Neighborhood character
- Predominantly Black (71%)
- Race & ethnicity
- Black 71% White 16% Two or more races 7% Hispanic / Latino 6%
- Hispanic origin (detail)
- Mexican 3% Puerto Rican 2%
- Common ancestry
- Arab 2% Romanian 2% Lithuanian 1%
- Foreign-born
- 11% · Canada
- Languages at home
- 82% English-only · Arabic 11% Spanish 5%
Political lean MEDSL · Wayne
- 2024 margin
- Strong D (+29.0) · D 62.7% · R 33.7% · Other 3.6%
- 2008→2024 swing
- -20.5pp toward R · 2008: 49.5pp · 2024: 29.0pp
- All cycles
- 2024: D+29.0 2020: D+38.1 2016: D+37.3 2012: D+46.9 2008: D+49.5
Not yet ingested
- Civics
- —
Market trends
- HPI YoY
- ▼ -160.81%
- Current HPI
- 168.6843
- Rent YoY
- ▼ -2.30%
- Metro
- Detroit-Warren-Dearborn, MI
- State GDP YoY
- ▲ 1.37%
- F500 in state
- 28
Industry mix (Fortune 500 HQ in MI)
| Industry | F500 HQs | Revenue |
|---|---|---|
| Automotive Parts | 3 | $48B |
|
||
| Automotive | 2 | $372B |
|
||
| Chemicals | 1 | $45B |
|
||
| Automotive Retail | 1 | $29B |
|
||
| Healthcare / Medical Devices | 1 | $23B |
|
||
| Automotive Technology | 1 | $20B |
|
||
Price history
+30.0% since first listed23 events — show timeline
- 2026-04-05 Price Changed $65,000 MiRealSource-MiMLS
- 2026-04-05 Price Changed $65,000 REALCOMP
- 2026-03-03 Listed $69,900 REALCOMP
- 2026-03-03 Listed $69,900 MiRealSource-MiMLS
- 2021-03-30 Sold (Public Records) $65,550 Public Records
- 2020-09-21 Sold (MLS) $30,000 MiRealSource-MiMLS
- 2020-09-21 Sold (MLS) $30,000 REALCOMP
- 2020-09-04 Pending — REALCOMP
- 2020-09-01 Listing Removed — REALCOMP
- 2020-07-30 Pending — MiRealSource-MiMLS
- 2020-07-30 Pending — REALCOMP
- 2020-07-10 Relisted — REALCOMP
- 2020-07-08 Listing Removed — REALCOMP
- 2020-05-08 Relisted — REALCOMP
- 2020-05-05 Listing Removed — REALCOMP
- 2020-03-04 Price Changed $35,000 MiRealSource-MiMLS
- 2020-03-03 Price Changed $35,000 REALCOMP
- 2020-01-25 Price Changed $45,000 MiRealSource-MiMLS
- 2020-01-24 Price Changed $45,000 REALCOMP
- 2020-01-10 Relisted — REALCOMP
- 2020-01-07 Listing Removed — REALCOMP
- 2019-12-15 Listed $50,000 MiRealSource-MiMLS
- 2019-12-15 Listed $50,000 REALCOMP
Property tax history
-2.9%/yrLatest (2025): $979 · -8.1% YoY. Source: county tax records.
Cash-flow waterfall
monthlySold comps — $/sqft
last 12 mo · ≤1 miLoading sold comps…