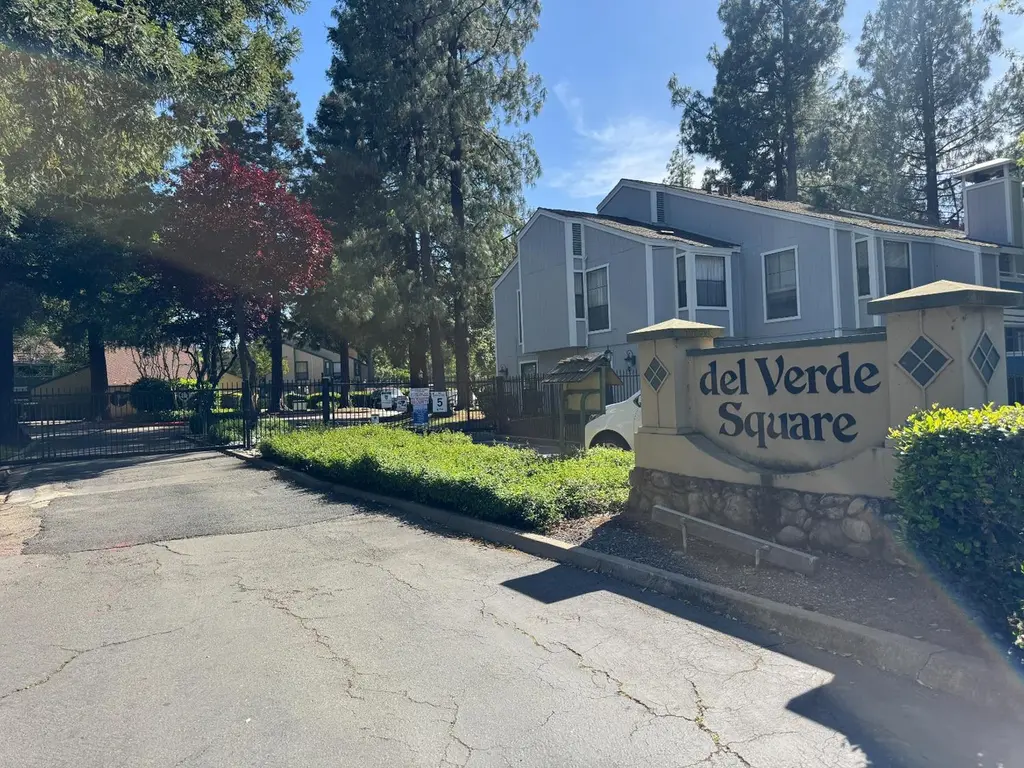
600 Del Verde Cir #6 · Sacramento, CA
Flood risk No data
- FEMA flood zone
- —
- Chance of flooding over 30 yrs
- —
- Est. flood insurance / yr
- —
Fire risk No data
- Est. fire insurance / yr
- —
Heat risk No data
- Hot days now (above threshold)
- —
- Hot days in 30 yrs
- —
Wind risk No data
- Chance of severe wind over 30 yrs
- —
Air-quality risk No data
- Unhealthy air days now
- —
- Unhealthy air days in 30 yrs
- —
Risk factors via First Street. Map © Google.
Why this score? — see what drove the D grade
The composite is a weighted blend of 9 inputs, each scored 0–100. Each bar is that input's sub-score; the figure is the points it added to the 100-point composite (weight × sub-score).
- ARV discount +15.0/15.0
- Cash flow +6.4/30.0
- 1% rule +4.3/10.0
- Schools +4.1/10.0
- Livability +3.6/5.0
- Rent growth +3.5/5.0
- Condition / age +2.5/5.0
- DSCR +0.7/10.0
- Appreciation +0.0/10.0
$215,000
🖨 Deal sheet (PDF) 📄 Offer letter ✓ Due diligence
Listing remarks
Welcome to Del Verde Square in desirable North Natomaswhere comfort meets convenience! This spacious 2-bedroom, 1-bath home offers an ideal layout with generously sized rooms and stylish laminate flooring throughout. The inviting living area features a cozy electric fireplace, perfect for relaxing evenings at home. Enjoy recent upgrades including a newer HVAC system (2022) and a beautifully updated shower (2022), providing peace of mind and modern comfort. Step outside to your private deck off the patioperfect for morning coffee or unwinding after a long day. The Del Verde Square community offers resort-style amenities including a sparkling pool, spa, and clubhouse. Even more exciting, the
Key facts
- Private deck
- Clubhouse
- Spa
Tags
Property features AI
Finance
- HOA & community: Mandatory association with monthly fee; Association amenities include pool, clubhouse, roof deck and barbeque; Association fee covers cable TV, exterior and grounds maintenance, security, trash, water, and pool
Exterior
- Parking: Assigned covered parking
- Security: Community security included in association services
- Utilities: 220 volt electric service; Public water with meter on site; Public sewer; Irrigation meter on site
- Home design: Detached condominium; Two-story property (one level noted in levels)
- Construction: Built in 1982; Composition roof
- Exterior features: Gated community; Built-in private pool (gunite) and community pool; Built-in spa / hot tub
Interior
- Kitchen: Hood over range; Dishwasher; Microwave; Free-standing electric oven
- Bedrooms: 2 bedrooms
- Flooring: Laminate flooring
- Bathrooms: 1 full bathroom; Shower stall(s); Double sinks
- Heating & cooling: Central heating; Central air conditioning; Ceiling fans
- Interior features: Great room living area; Ceramic counters in the kitchen; Electric fireplace in the family room
- Laundry & utility: Washer and dryer included and located inside the unit
Neighborhood map
What this means for you Summary
Snapshot
- This is a 2-bed/1.0-bath condo listed at $215k.
Deal economics
- At list price, monthly cash flow is $-370 ($-4k/yr) — negative.
- To cash-flow at today's rent, offer at most $150k (30.4% below list).
- To meet the 1% rule (rent ≥ 1% of price), the offer needs to be $200k (7.2% below list).
- Recommended offer: $150k (30.4% below list) — sets the bar for cash-flow.
- Cap rate 4.2% vs local median 3.0% in Sacramento — top-decile yield for the area; either an underpriced asset or a hidden risk that comps aren't pricing in. Stress-test before assuming the spread holds.
Location & tenants
- Location reads 71/100 on livability (#218 in CA) — a middle-class / working-renter tenant base. Strengths: amenities A+, commute A+, housing A; Watch: crime F, cost of living F.
- Natomas Unified (urban): math 33% / reading 60% proficiency, ranked #155 of 517 in CA (top 30%) — families likely to look elsewhere, expect single-tenant / working-renter base with shorter leases.
- Zoned schools: Jefferson (713 students, 68% FRL); Natomas Middle (662 students, 65% FRL); Natomas High (math 17% / reading 37%, grade F, #788 of 1,170 statewide, top 69%, 1,229 students, 63% FRL) — zoned schools average 65% FRL vs 45% district-wide (21 pts higher); higher-poverty schools than district average — tighter screening recommended.
- Zoned-school proficiency averages 27% at this address vs 46% district-wide (-20 pts) — the specific schools serving this property underperform the Natomas Unified average; the district grade overstates school quality for this exact location.
- Market conditions: Rents rising (+3.8%/yr); 136 active listings in the ZIP; 36 comparable units currently listed for rent nearby; rentals leasing fast (median 0d on market — plan ~1-2 weeks tenant-placement turnaround); solid renter incomes; 6,825 units permitted in Sacramento County in 2024 (1,752 in 5+ unit buildings).
Forward outlook
- Local home prices are declining (-3.0%/yr); year-one equity from $1k of loan paydown is wiped out by about $6k of value loss. Plan a longer hold.
- Sacramento County population projected at +17% by 2050 — long-run rental-demand tailwind backs the buy-and-hold thesis.
Negotiation context
- Only 14 days on market — expect competitive offers; lowballing is unlikely to land.
- Current owner paid $160k; 34% above their basis — modest negotiation headroom, anchor on the comps not their cost.
Risks & watch-outs
- Watch-outs: HOA is 27% of rent.
Questions for the listing agent
- What do current leases actually rent for vs. the listed asking? Can we see a recent rent roll and the last 12 months of T-12 income?
- What does the HOA fee cover, when was the last increase, and are there any pending special assessments or reserve-fund shortfalls?
- Any open or pending special assessments — roof, HVAC, plumbing, elevator, façade? What's the per-unit balance and payoff schedule, and is the seller paying it off at close or rolling it to the buyer?
- Is there a deadline driving the sale (1031 exchange, divorce, estate, relocation)? That informs how much negotiation room exists.
- Schools are D-rated, which usually means shorter tenancies and higher turnover. Who's the typical renter profile here, and what's been the actual vacancy rate?
- Crime grade is F in this area — have there been break-ins, vandalism, or insurance claims at this property in the last 3 years? What carrier currently insures it and at what premium?
- The area grade is low — what's the realistic commute time and amenity access for the typical tenant pool here? Any planned neighborhood developments (good or bad) we should know about?
- What's the average days-on-market for RENTAL listings here right now (not sales)? A rising rental-DOM trend means longer vacancies and softer asking-rent achievability than the comps imply.
- What's the recent tenant-quality profile in this submarket — average credit score on applications, eviction rate, late-payment / NSF rate, and stable-employment percentage? A property-management company in the area should have these aggregated.
- How much new apartment / multifamily construction is in the pipeline within 1–3 miles? Heavy new supply (>2% of stock underway) typically softens rents 12–24 months out; light construction supports rent growth.
Investment metrics
- 1% rule
- 0.93% ✗
- Cap rate
- 4.23%
- Cash-on-cash
- -7.37%
- DSCR
- 0.67
- GRM
- 9.0
CMA / ARV
- ARV (median comp)
- $259,350
- List price
- $215,000
- Delta
- -17.10%
- Verdict
- UNDERPRICED
- Comps
- 20 within 1.0 mi
Projected returns pro-forma
-3.0% appreciation · 3.82% rent growth · sell at horizon
- IRR
- -27.7%
- Equity multiple
- 0.06×
- Total profit
- $-56,426
- Equity at exit
- $32,057
- IRR
- -21.8%
- Equity multiple
- -0.18×
- Total profit
- $-71,274
- Equity at exit
- $18,589
Cash invested: $60,200 (down + closing). Projections, not guarantees.
Landlord ↔ Tenant lean methodology
- Overall (STATE)
- 18 Strongly Tenant-Friendly
- State California
- 18 Strongly Tenant-Friendly · D+13
- County
- — inherits STATE
- City
- — inherits STATE
ZIP-level market 95833
- Rents YoY
- 3.8%
- Active inventory
- 136
- Price-to-rent
- 9.0×
Monthly cashflow live
- Estimated rent
- $1,995 high interval (Pro) →
- Mortgage (P&I)
- −$1,127
- Tax from tax record
- −$191 /mo · $2,294/yr
- Insurance
- −$90
- HOA
- −$538
- Vacancy / Maint / Mgmt
- −$419
- Net cashflow
- $-370
Break-even live
Sensitivity live
| Price | -10% $-248 | -5% $-309 | +0% $-370 | +5% $-431 | +10% $-492 |
|---|---|---|---|---|---|
| Rent | -10% $-528 | -5% $-449 | +0% $-370 | +5% $-291 | +10% $-212 |
| Rate | -1.0pp $-262 | -0.5pp $-315 | base $-370 | +0.5pp $-426 | +1.0pp $-482 |
UW: 25.0% down · 7.5% · 30yr · 1.5% tax · 5.0% vac · 8.0% maint · 8.0% mgmt
Financing live
Cash to close
- Down payment
- $53,750
- Closing costs
- $6,450
- Reserves months
- —
- Total cash needed
- —
Loan-product check · same deal, 3 products live
Conventional
25% down · 7.5% · 30yr
- Down + closing
- —
- Monthly P&I
- —
- Monthly cashflow
- —
- DSCR
- —
- Eligible?
- —
Personal DTI + credit; lowest rate.
DSCR
20% down · 8.5% · 30yr
- Down + closing
- —
- Monthly P&I
- —
- Monthly cashflow
- —
- DSCR
- —
- Eligible?
- —
No personal income docs; deal must DSCR.
Hard money
10% down · 12.0% · 12mo
- Down + closing
- —
- Monthly P&I
- —
- Monthly cashflow
- —
- DSCR
- —
- Eligible?
- —
Short-term bridge; refi at stabilization.
Rent comps 36 comps
| Address | Beds | Baths | Sqft | Rent | $/sqft | DOM | Units | Dist |
|---|---|---|---|---|---|---|---|---|
| 600 Del Verde Cir #7 Sacramento, CA | 2.0 | 1.0 | 956 | $1,600 | $1.67 | 45d | 1 | 0.02mi |
| 600 Del Verde Cir #2 Sacramento, CA | 2.0 | 1.0 | 956 | $1,950 | $2.04 | 45d | 1 | 0.02mi |
| 3310 Winter Park Dr Sacramento, CA | 1.0–2.0 | 1.0–2.0 | 786 | $1,915 | $2.44 | 0d | 6 | 0.22mi |
| 2028 San Juan Rd Sacramento, CA | 2.0 | 2.0 | 875 | $2,070 | $2.37 | 25d | 1 | 0.33mi |
| 2028 San Juan Rd Sacramento, CA | 1.0 | 1.0 | 655 | $1,520 | $2.32 | 14d | 1 | 0.33mi |
| 2028 San Juan Rd Sacramento, CA | 2.0 | 2.0 | 875 | $1,915 | $2.19 | 0d | 1 | 0.33mi |
| 3334 Smoketree Dr Sacramento, CA | 1.0–2.0 | 1.0–2.0 | 749 | $1,965 | $2.62 | 0d | 25 | 0.34mi |
| 3271 Azevedo Dr Unit 140 Sacramento, CA | 2.0 | 2.0 | 875 | $1,800 | $2.06 | 45d | 1 | 0.44mi |
| 3271 Azevedo Dr Unit 0222 Sacramento, CA | 2.0 | 2.0 | 875 | $1,800 | $2.06 | 5d | 1 | 0.44mi |
| 3271 Azevedo Dr Unit 0254 Sacramento, CA | 1.0 | 1.0 | 655 | $1,499 | $2.29 | 25d | 1 | 0.44mi |
| 3271 Azevedo Dr Unit 266 Sacramento, CA | 2.0 | 1.0 | 825 | $1,600 | $1.94 | 25d | 1 | 0.44mi |
| 3271 Azevedo Dr Unit 164 Sacramento, CA | 2.0 | 1.0 | 825 | $1,695 | $2.05 | 45d | 1 | 0.44mi |
| 3271 Azevedo Dr Sacramento, CA | 1.0–2.0 | 1.0–2.0 | 765 | $1,800 | $2.35 | 12d | 21 | 0.49mi |
| 3525 Cattle Dr Sacramento, CA | 3.0 | 2.0 | 1025 | $2,295 | $2.24 | 25d | 1 | 0.59mi |
| 2025 W El Camino Ave Sacramento, CA | 1.0–2.0 | 1.0–2.0 | 744 | $2,053 | $2.76 | 0d | 1 | 0.80mi |
| 2660 Stonecreek Dr Sacramento, CA | 1.0 | 1.0 | 680 | $1,620 | $2.38 | 0d | 1 | 0.94mi |
| 2660 Stonecreek Dr Sacramento, CA | 2.0 | 2.0 | 887 | $2,055 | $2.32 | 21d | 1 | 0.94mi |
| 3421 N Freeway Blvd Sacramento, CA | 2.0 | 1.0–2.0 | 862 | $3,030 | $3.51 | 0d | 86 | 0.97mi |
| 2593 Millcreek Dr Sacramento, CA | 1.0–2.0 | 1.0–2.0 | 787 | $1,800 | $2.29 | 0d | 9 | 0.97mi |
| 2490 Quiet Trail Ln Sacramento, CA | 1.0–3.0 | 1.0–2.0 | 1113 | $2,924 | $2.63 | 0d | 14 | 0.98mi |
| 2450 Seamist Dr Sacramento, CA | 1.0–2.0 | 1.0–2.0 | 755 | $1,804 | $2.39 | 0d | 20 | 1.04mi |
| 3741 Tice Creek Way Sacramento, CA | 2.0 | 2.5 | 1027 | $2,295 | $2.23 | 9d | 1 | 1.05mi |
| 801 San Juan Rd Sacramento, CA | 1.0–2.0 | 1.0–2.0 | 765 | $1,660 | $2.17 | 3d | 3 | 1.07mi |
| 2900 Weald Way Sacramento, CA | 1.0–3.0 | 1.0–2.0 | 1055 | $2,616 | $2.48 | 0d | 16 | 1.13mi |
| 1560 Waterwheel Dr Sacramento, CA | 1.0 | 1.0 | 770 | $1,745 | $2.27 | 5d | 1 | 1.14mi |
| 1560 Waterwheel Dr Sacramento, CA | 2.0 | 2.0 | 1119 | $2,115 | $1.89 | 25d | 1 | 1.14mi |
| 1560 Waterwheel Dr Sacramento, CA | 2.0 | 2.0 | 1070 | $1,925 | $1.80 | 0d | 1 | 1.14mi |
| 2205 Natomas Park Dr Sacramento, CA | 1.0–3.0 | 1.0–2.0 | 900 | $2,590 | $2.88 | 0d | 20 | 1.20mi |
| 2800 Grasslands Dr Sacramento, CA | 1.0–2.0 | 1.0–2.0 | 941 | $2,495 | $2.65 | 0d | 12 | 1.20mi |
| 3351 Duckhorn Dr Sacramento, CA | 1.0 | 1.0 | 981 | $1,988 | $2.03 | 0d | 8 | 1.23mi |
| 3761 E Commerce Way Sacramento, CA | 2.0 | 1.0–2.0 | 865 | $3,231 | $3.74 | 3d | 29 | 1.31mi |
| 3791 E Commerce Way Sacramento, CA | 2.0 | 1.0–2.0 | 834 | $2,920 | $3.50 | 0d | 20 | 1.35mi |
| 2580 W El Camino Ave #14103 Sacramento, CA | 2.0 | 1.0 | 1113 | $2,095 | $1.88 | 0d | 1 | 1.37mi |
| 4101 Innovator Dr Sacramento, CA | 1.0–2.0 | 1.0–2.0 | 950 | $2,730 | $2.87 | 0d | 10 | 1.41mi |
| 4100 Innovator Dr Sacramento, CA | 2.0 | 1.0–2.0 | 860 | $2,990 | $3.47 | 0d | 20 | 1.43mi |
| 3610 Duckhorn Dr Sacramento, CA | 1.0–3.0 | 1.0–2.0 | 927 | $2,615 | $2.82 | 0d | 29 | 1.45mi |
HOA detail condo
- Monthly dues
- $538 · $6,456/yr
- Likely covers
- electricpool
- Assessments
- None detected in remarks — confirm with the listing agent.
Listing history 3 events
-
2019-08-20soldstatus $160,000
-
2003-05-30soldstatus $125,000
-
1982-11-30soldstatus $66,000
ⓘ Source: listings_history table (triggers on properties + properties_extension) + one-shot
backfill from property_details.listing_events for pre-trigger history.
Tax reassessment forecast CA · Resets to sale price
- Current annual tax
- $2,294 · $191/mo
- Projected year-2 tax
- $2,294 · $191/mo
- Expected delta
- $0/yr ($0/mo · 0.0%)
ⓘ Screening estimate from a state-policy table — verify with the county assessor before closing.
Nearby sold comps map
Loading sold comps map…
Walkable amenities ~0.75 mi
Loading nearby amenities…
Taxation est. · year 1
- Rental income
- $23,944
- − Mortgage interest
- −$12,043
- − Property taxes
- −$2,294
- − Insurance
- −$1,075
- − Repairs & maintenance
- −$1,916
- − Management
- −$1,916
- − HOA
- −$6,456
- − Depreciation
- −$6,255
- Taxable loss
- −$8,010
- Est. tax savings @ 24.0%
- +$1,922
- After-tax cash flow
- $-2,516/yr
For passive investors: Depreciation is non-cash, so a rental often shows a tax loss while cash-flowing — sheltering income. Rental losses are passive: they offset passive income freely, and up to $25,000/yr can offset ordinary (W-2) income if you actively participate and your MAGI is under $100k (phasing out to $0 by $150k); unused losses carry forward. On sale, claimed depreciation is recaptured at up to 25%, and gains may owe capital-gains tax (a 1031 exchange can defer both). Figures are a year-1 estimate at your 24.0% rate — not tax advice; consult a CPA.
Schools (NCES district)
- District
- Natomas Unified
- NCES district ID
- 0600036
- Math proficiency
- 33% ▼ -1.00%
- Reading proficiency
- 60% ▲ 13.00%
- Median HH income
- $67,969
- Composite
- 41.49/100
- National rank
- #3457
- State rank
- #155 of 517 in CA
Livability — Sacramento
- Score
- 71/100
- State rank
- #218
- US rank
- #6957
Category grades
Schools grade is shown separately in the Schools card above.
Census & demographics
- Census place
- Sacramento, CA
- County
- Sacramento County · 1,539,646 people
- City population
- 761,410
- Metro
- Sacramento-Roseville-Folsom, CA
- Population (ZIP)
- 42,265
- Household income
- $97,792
- Rent vs Own
- Severe rent burden
- 1743.0
Population outlook (Sacramento County) Hauer SSP2
- Today (2025)
- 1,660,763 people
- By 2030
- 1,732,990 · +4.3%
- By 2040
- 1,855,755 · +11.7%
- By 2050
- 1,941,335 · +16.9%
- By 2075
- 2,046,162 · +23.2%
- By 2100
- 1,961,444 · +18.1%
Race, ethnicity, and origin ACS 2023
- Neighborhood character
- Highly diverse neighborhood (Simpson 0.73)
- Race & ethnicity
- Hispanic / Latino 41% White 27% Two or more races 20% Black 12% Asian 10% Pacific Islander 1%
- Hispanic origin (detail)
- Mexican 35%
- Common ancestry
- Russian 2% Lithuanian 1% Italian 1%
- Foreign-born
- 19% · Canada, China, Vietnam
- Languages at home
- 66% English-only · Spanish 22% Other Indo-European 4% Other Asian/Pacific 2%
Political lean MEDSL · Sacramento
- 2024 margin
- D (+19.7) · D 58.1% · R 38.4% · Other 3.5%
- 2008→2024 swing
- +0.7pp no change · 2008: 19.0pp · 2024: 19.7pp
- All cycles
- 2024: D+19.7 2020: D+25.3 2016: D+23.7 2012: D+16.3 2008: D+19.0
Not yet ingested
- Civics
- —
Market trends
- HPI YoY
- ▼ -230.78%
- Current HPI
- 307.7212
- Rent YoY
- ▲ 3.82%
- Metro
- Sacramento-Roseville-Folsom, CA
- State GDP YoY
- ▲ 3.21%
- F500 in state
- 116
Industry mix (Fortune 500 HQ in CA)
| Industry | F500 HQs | Revenue |
|---|---|---|
| Technology | 27 | $1,492B |
|
||
| Financial Services | 3 | $174B |
|
||
| Retail | 3 | $44B |
|
||
| Insurance | 3 | $26B |
|
||
| Media / Entertainment | 2 | $115B |
|
||
| Pharmaceuticals / Biotech | 2 | $62B |
|
||
Price history
+142.4% since first listed3 events — show timeline
- 2019-08-20 Sold (Public Records) $160,000 Public Records
- 2003-05-30 Sold (Public Records) $125,000 Public Records
- 1982-11-30 Sold (Public Records) $66,000 Public Records
Property tax history
+1.7%/yrLatest (2025): $2,294 · -4.0% YoY. Source: county tax records.
Cash-flow waterfall
monthlySold comps — $/sqft
last 12 mo · ≤1 miLoading sold comps…